Empirical prediction models of time-averaged shear wave velocity vS20 and vS30 in Sichuan and Yunnan areas
-
摘要: 利用四川和云南地区共973个工程场地钻孔资料,分别基于常速度外推模型、对数线性模型和条件独立模型的经验外推方法建立了该区域20 m和30 m平均剪切波速vS20和vS30的经验预测模型。研究表明常速度外推模型的预测误差最大,当波速资料深度小于10 m时,常速度外推方法会显著低估实际场地平均波速。基于对数线性外推方法建立了四川和云南地区波速经验预测模型,对比结果表明四川和云南地区平均波速预测结果与北京和加州地区较接近,明显低于日本地区。基于三种不同外推方法的预测误差对比分析结果表明条件独立性模型的预测结果在不同深度时误差均为最小,建议优先采用该方法建立的区域波速预测模型。Abstract: The time-averaged shear wave velocity of overburden soil is an important parameter for site classification and reflecting site effects on ground motion, which is widely used in earthquake ground motion prediction models. Using the lithology and wave velocity profile data of 973 boreholes in Sichuan and Yunnan, we study the regional prediction model of the average shear wave velocity. Based on the bottom constant velocity (BCV) model, log-linear model and Markov independent model, the empirical prediction models of vS20 and vS30 in this region were established. The results show that, the BCV method has the largest prediction error. When the depth of the shear wave velocity is less than 10 m, this method will significantly underestimate the average wave velocity of the actual site. Based on the log-linear model of Boore method, we establish an empirical prediction model. By comparison, we find that the average wave speed prediction results in Sichuan and Yunnan are close to those in Beijing and California, and significantly lower than those in Japan. Through the comparative analysis of prediction error of three different extrapolation methods, we find that the prediction results based on Markov independence model have the smallest error at different depths, and it is preferred to use this method to set up regional prediction model.
-
引言
覆盖土层的平均剪切波速是进行场地分类和反映场地地震动影响的重要参数,作为地震动预测中一个重要的解释变量,近年被广泛应用于地震动预测方程(汪闻韶,1994;李小军,2013;Bozorgnia et al,2014)。中国现行的建筑抗震设计规范GB50011—2010 (中华人民共和国住房和城乡建设部,中华人民共和国质量监督检验检疫总局,2016)在确定场地类别时,是以地表以下不超过20 m深度的覆盖土层的等效剪切波速vSe及覆盖层厚度作为分类指标。美国和欧洲等一些国家和地区主要以地表以下30 m深度内岩土层的平均剪切波速vS30作为场地类别划分的依据(Building Seismic Safety Council,2015)。
如果能够获得至少30 m深度的钻孔实测剪切波速,就可以据此计算场地平均剪切波速vS30。由于中国与欧美对于场地分类标准的不同,我国工程建设中钻孔和剪切波速测量深度达到30 m的往往较少。在工程钻孔和波速测量数据深度小于需要的计算深度(30或20 m)时,需要采用基于已有深度波速数据的经验外推方法,即根据已有的剪切波速vS剖面,通过波速外推的方法估测场地剪切波速vS30或vSe值,常见速度外推法有常速度外推法和对数线性外推法等(Boore,2004;Kuo et al,2009)。需要指出的是,由于不同地区的浅层波速结构具有区域性差异,外推方法得到的波速预测结果往往具有区域性(Boore,2004;Stewart et al,2014;Xie et al,2016)。例如,Boore等(2011)结合日本、美国加州、土耳其的数据进一步分析认为外推模型的线性相关具有显著的区域差异;Xie等(2016)研究显示北京平原地区的浅层剪切波速低于日本地区,但略高于美国加州地区。此外,一些研究(Stewart et al,2014;Yong,2016)显示区域沉积环境和岩粒粗细对场地剪切波速有显著影响,如河流上游高能沉积环境产生的沉积物比下游低能环境产生的沉积物更硬、更粗糙,尤其是对于第四系沉积物而言,细颗粒材料的剪切波速往往比粗颗粒沉积物低(Wills,Clahan,2006;Stewart et al,2014)。
在工程建设中,往往需要针对场地开展工程地质勘察以及剪切波速测量,以获取场地平均波速进行场地分类。在缺少钻孔或钻孔深度不够时,利用区域已有的钻孔资料,开展区域场地剪切波速预测模型和外推方法的研究,对于工程场地分类、地震动参数确定和工程抗震设防具有重要意义。本文将利用四川和云南地区在工程建设、地震小区划研究和强震动台站建设中获取的钻孔岩性和波速测量数据,研究适用于该地区的区域平均剪切波速预测外推方法,分析不同外推方法的预测精度和可行性,探讨适用于该地区场地平均剪切波速的预测模型。
1. 钻孔资料及区域工程地质概况
四川地区地势西高东低,由西北向东南倾斜,地跨横断山脉、云贵高原、秦巴山地、青藏高原、四川盆地等几大地貌单元,第四系以河流相为主,伴有冲洪积、湖积、冰川堆积、风积等。云南地区地势西北高东南低,东部为滇东、滇中高原,发育着各种类型的岩溶地形,西部为横断山脉纵谷区,第四系以冲洪积相为主,断陷盆地以河湖相、沼泽相为主(姚冬生等,1990)。图1给出了本研究收集的四川和云南地区共计973个钻孔的空间分布,其中:四川地区收集到钻孔716个,分布相对较均匀,在川西地区和四川盆地内均有分布;云南地区有钻孔257个,多位于云南省东部,而西部获取钻孔较少,钻孔分布不均匀。表1统计了973个钻孔的深度分布,其中:剪切波速测量深度超过30 m的271个,不到全部钻孔的1/3;超过20 m的钻孔共640个,约占总钻孔数的2/3;有约1/3的钻孔深度不足20 m。根据钻孔的岩性和波速测量结果,深度超过30 m的271个钻孔中,覆盖土层(等效剪切波速小于500 m/s)厚度超过30 m的有200个;深度超过20 m的640个钻孔中,覆盖土层厚度超过20 m的有543个。
![]() 图 1 收集的四川和云南地区973个钻孔的位置分布Ⅰ : 扬子准地台;Ⅱ : 秦岭—大别造山带;Ⅲ : 松潘—甘孜造山带;Ⅳ : 羌塘地带;Ⅴ : 中缅地块;Ⅵ : 改则—那曲造山带;Ⅶ : 右江造山带Figure 1. Location of 973 borehole sites of Sichuan and Yunnan Provinces used in this studyⅠ : Yantze paraplatform;Ⅱ : Qinling-Dabie orogenic belt;Ⅲ : Songpan-Garze orogenic belt;Ⅳ : Qiangtang block;Ⅴ : China-Myanmar block;Ⅵ : Greze-Nakchu orogenic belt;Ⅶ : Youjiang orogenic belt表 1 钻孔深度统计表Table 1. Drilling depth statistics
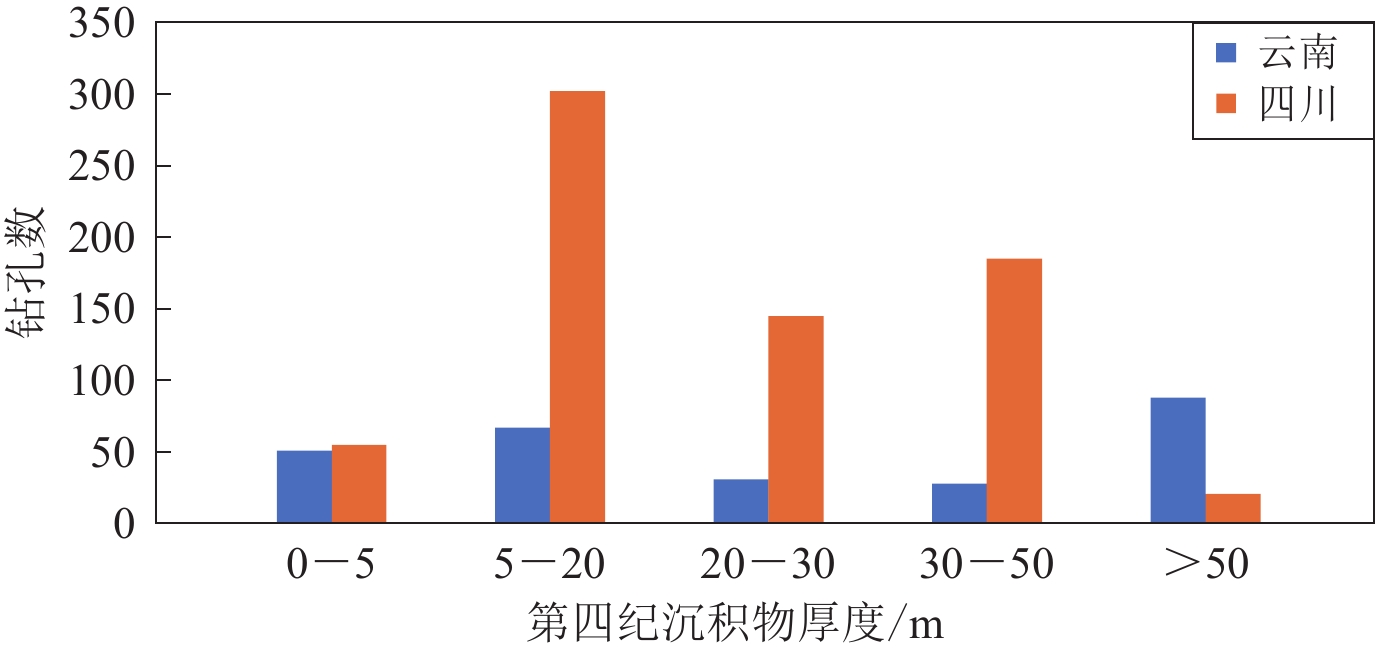
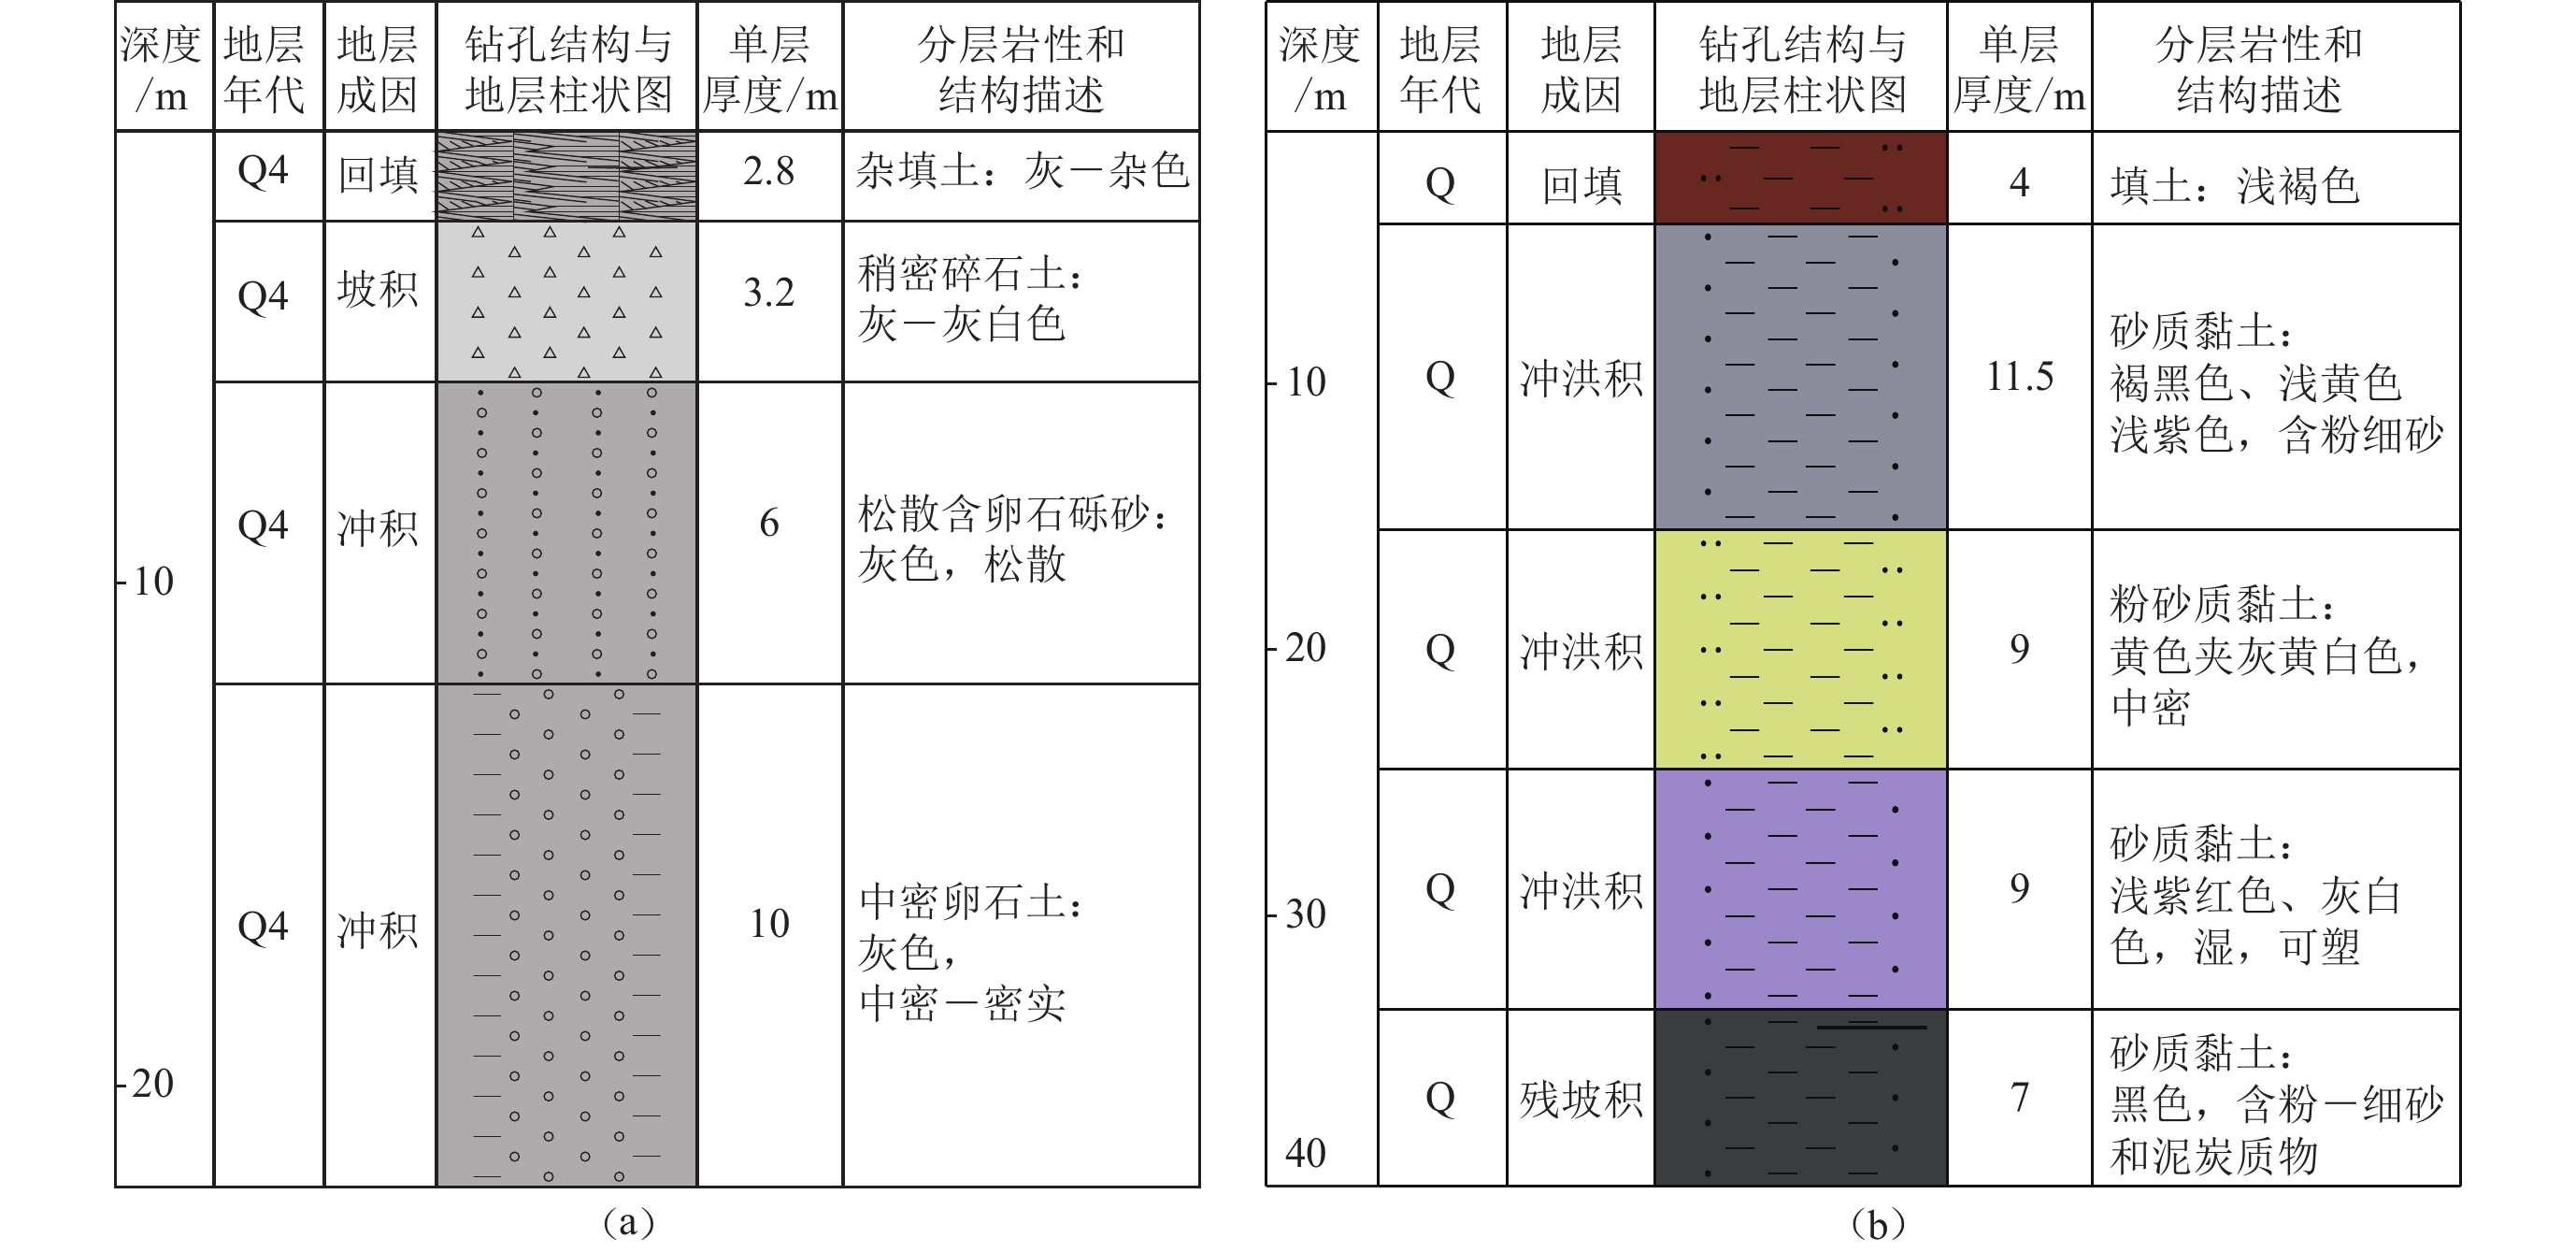
图 1 收集的四川和云南地区973个钻孔的位置分布Ⅰ : 扬子准地台;Ⅱ : 秦岭—大别造山带;Ⅲ : 松潘—甘孜造山带;Ⅳ : 羌塘地带;Ⅴ : 中缅地块;Ⅵ : 改则—那曲造山带;Ⅶ : 右江造山带Figure 1. Location of 973 borehole sites of Sichuan and Yunnan Provinces used in this studyⅠ : Yantze paraplatform;Ⅱ : Qinling-Dabie orogenic belt;Ⅲ : Songpan-Garze orogenic belt;Ⅳ : Qiangtang block;Ⅴ : China-Myanmar block;Ⅵ : Greze-Nakchu orogenic belt;Ⅶ : Youjiang orogenic belt表 1 钻孔深度统计表Table 1. Drilling depth statistics钻孔深度d /m 钻孔个数 0<d<5 3 5≤d<20 330 20≤d<30 369 d≥30 271 从收集的钻孔资料来看,云南地区第四系沉积物厚度分布差异较大,尤其是断陷盆地周边差异更大。图2统计了云南地区257个钻孔和四川地区716个钻孔的第四系沉积物厚度分布。从图1中钻孔空间分布和图2中的钻孔第四系沉积物厚度分布情况的对比结果来看,四川地区钻孔多数位于西部山区,钻孔的第四系沉积物厚度较小,5—20 m的沉积厚度较为常见,可以推测这与钻孔位置所处的地形和地势相关。四川西部地区褶皱和断层分布密集,第四系沉积相对较薄,暴露地表的往往是基岩和基岩风化壳。云南地区钻孔多数位于昆明和玉溪地区,显示第四系沉积较厚,且很多超过50 m,推测与钻孔位置的断陷湖盆有关。结合四川和云南地区钻孔分布(图1)和较典型的钻孔柱状图(图3)来看:云南地区钻孔岩性中多见黏土、粉土等细粒沉积物,处于相对低能的沉积环境(超过50 m的多为湖积沼泽沉积);而四川地区钻孔多数位于西部山区的河流峡谷(钻探点多选在山区中交通较便利、地势较平缓的位置),钻孔岩性较常见冲洪积相的沉积物,处于一个相对高能的沉积环境,岩粒相对较粗,多见块石、卵石等。从图2中钻孔的第四系沉积物厚度分布情况来看,四川地区钻孔中沉积物厚度小于20 m的较多(超过350个),而云南地区钻孔中第四系沉积物厚度超过50 m的较多(接近100个)。
2. 基于钻孔资料的波速外推方法
我国建筑抗震设计规范中采用覆盖土层厚度和等效剪切波速的双参数进行场地类别划分,该方法取不超过20 m深度的覆盖土层计算等效剪切波速vSe,即
$$ v_{{\rm{Se}}}{\text{=}}\frac{{d}_{0}}t {\text{,}} $$ (1) $$ t{\text{=}}{\sum\limits_{i{\text{=}}1}^{n} }\left(\frac{{d}_{i}}{v_{{\rm{S}}i}}\right) {\text{,}} $$ (2) 式中:vSe为土层等效剪切波速;d0为计算深度,取覆盖土层厚度与20 m中的较小值;di和vSi分别为计算深度范围内第i层土的厚度和剪切波速。
我国抗震规范中采用的等效剪切波速与国外普遍采用的平均剪切波速有区别亦有联系。根据规范中关于等效剪切波速的定义,等效剪切波速的计算深度取覆盖土层厚度与20 m中的较小值。因此,等效剪切波速的计算深度针对不同场地是不固定的,而国外采用的平均剪切波速是取地表以下固定深度(如30 m)的土层来考虑。针对我国规范的等效剪切波速的计算方法,当场地覆盖层厚度超过20 m时,计算深度则固定取为20 m,此时覆盖土层等效剪切波速即为地表以下20 m的平均剪切波速(以下简称平均剪切波速)vS20。在式(1)和(2)中取深度d0为20 m即可计算vS20。
当钻孔和波速测量深度z足够时,可以直接采用平均波速的定义计算场地覆盖土层的平均波速,即
$$v_{{\rm{S}}{\textit{z}}}{\text{=}} \frac{{{\textit{z}}}_{{\rm{p}}}}{\Delta t_{\textit{z}}} {\text{,}}$$ (3) 式中Δtz是剪切波速从深度zp到地表的传播时间。
对于波速剖面深度zp小于所需计算深度的情况,不能直接计算场地平均剪切波速vS20或vS30,需要利用经验外推方法进行估计。近年来发展了几种波速估计的外推方法,常见的有常速度外推模型(bottom constant velocity,缩写为BCV)(Kuo et al,2009,2011),线性或二次外推模型(Boore,2004;Boore et al,2011)和基于Markov独立过程的外推模型(Dai et al,2013)。
目前,我国建筑抗震设计规范GB50011—2010在确定场地类别时采用地表以下不超过20 m深度的覆盖土层的等效剪切波速。随着经济的发展,我国超高层建筑、大跨桥梁和空间结构日益增多,这些结构空间跨度大、自振周期长,仅用20 m以内的等效剪切波速对场地进行分类并确定设计地震动反应谱,可能难以反映深厚覆盖土层的影响。为此很多研究人员建议将场地分类考虑的覆盖土层深度从20 m增加到30 m (李小军,2013;陈国兴等,2020)。为了满足目前和将来长周期建筑抗震设防的研究需要,同时便于与国内外相关结果进行对比,本文将同时研究vS20和vS30的经验预测模型。
2.1 常速度外推 ( BCV ) 法
常速度外推法(BCV)假设底部速度恒定,即假设波速在zp到30 m范围内保持不变(Kuo et al,2011),进而估算场地平均波速,即
$$ {v}_{{\rm{S}}30}{\text{=}}\frac{30}{\Delta {t}_{{\textit{z}}}{\text{+}}\dfrac{30{\text{-}}{{\textit{z}}}_{{\rm{p}}}}{{v}_{{\rm{S}}}{\text{(}}{{\textit{z}}}_{{\rm{p}}}{\text{)}}}} {\text{,}} $$ (4) 式中,Δtz是剪切波从深度zp到地表的传播时间,vS(zp)为钻孔底部zp深度的瞬时剪切波速。
前人研究发现常速度外推法通常会低估场地实际平均波速。一般情况下,在钻孔剖面中,剪切波速随深度的增加而增大,因此常速模型通常低估实际结果,存在一定偏差。但当钻孔深度超过20 m时,估计值vS30可信程度较高(Kuo et al,2011;Xie et al,2016)。根据表1的统计结果,四川和云南地区波速测量深度超过20 m的钻孔有640个,约占全部钻孔数量的约2/3,可以利用这些数据建立研究区的波速外推模型。
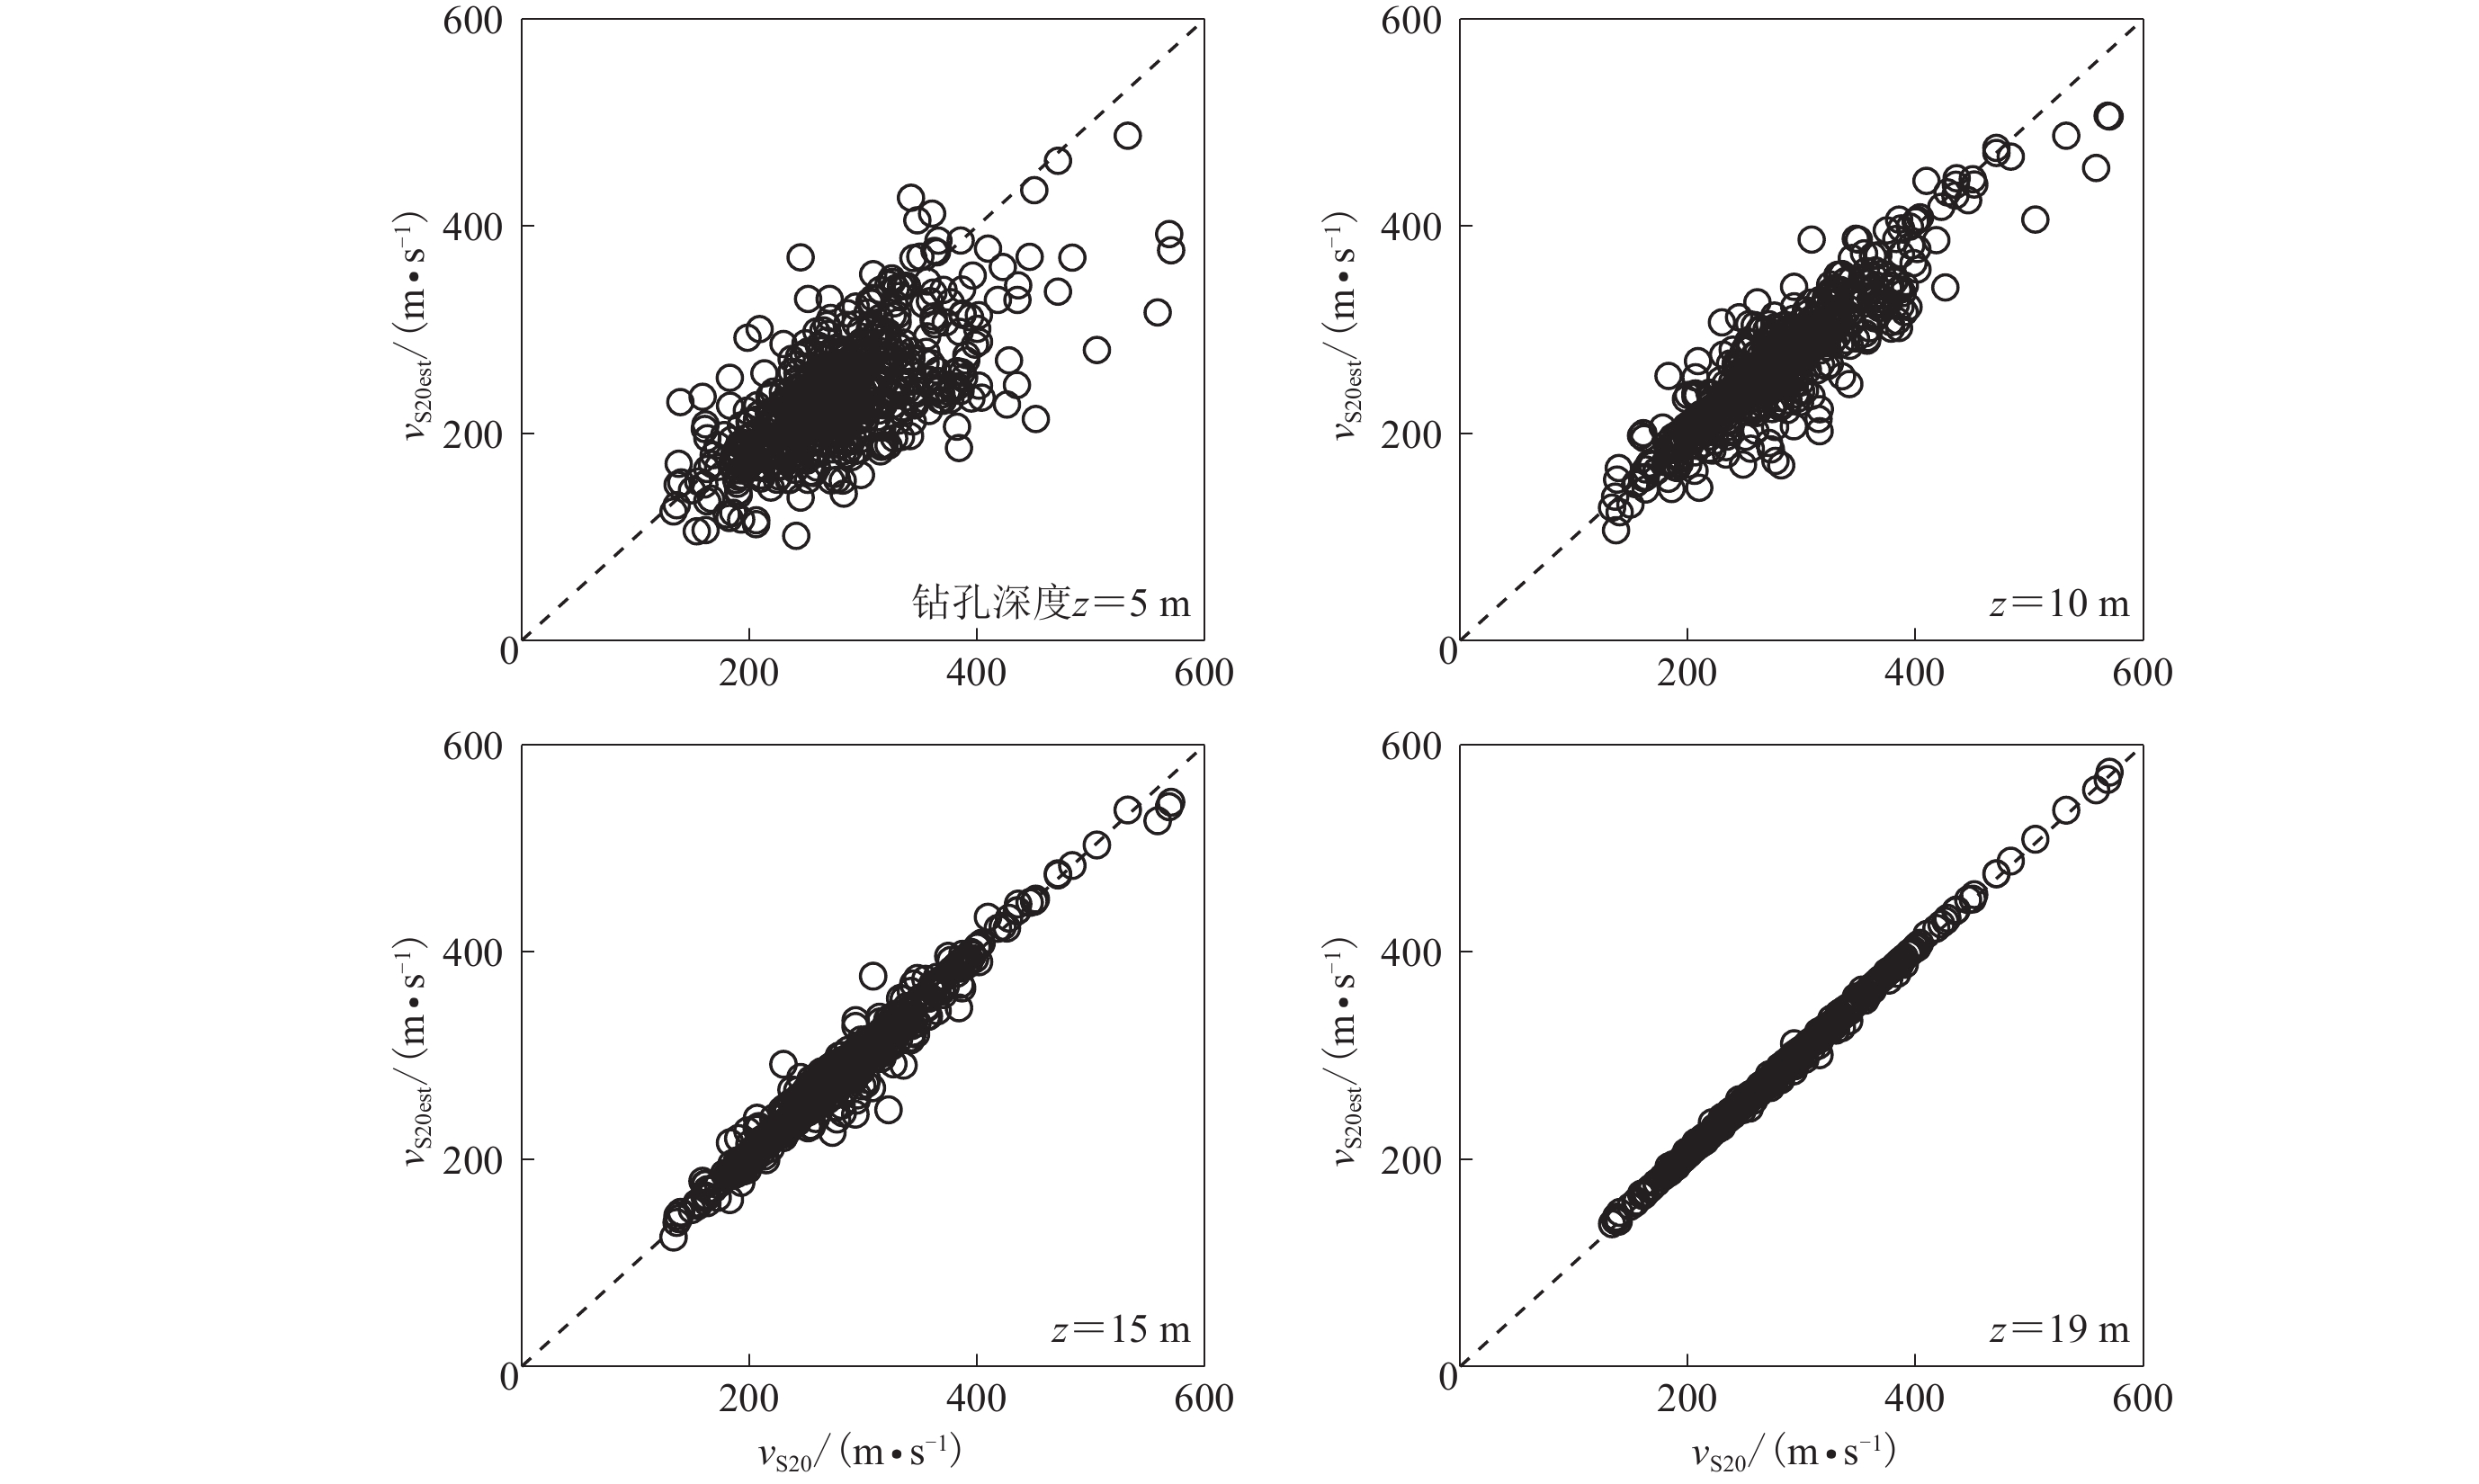
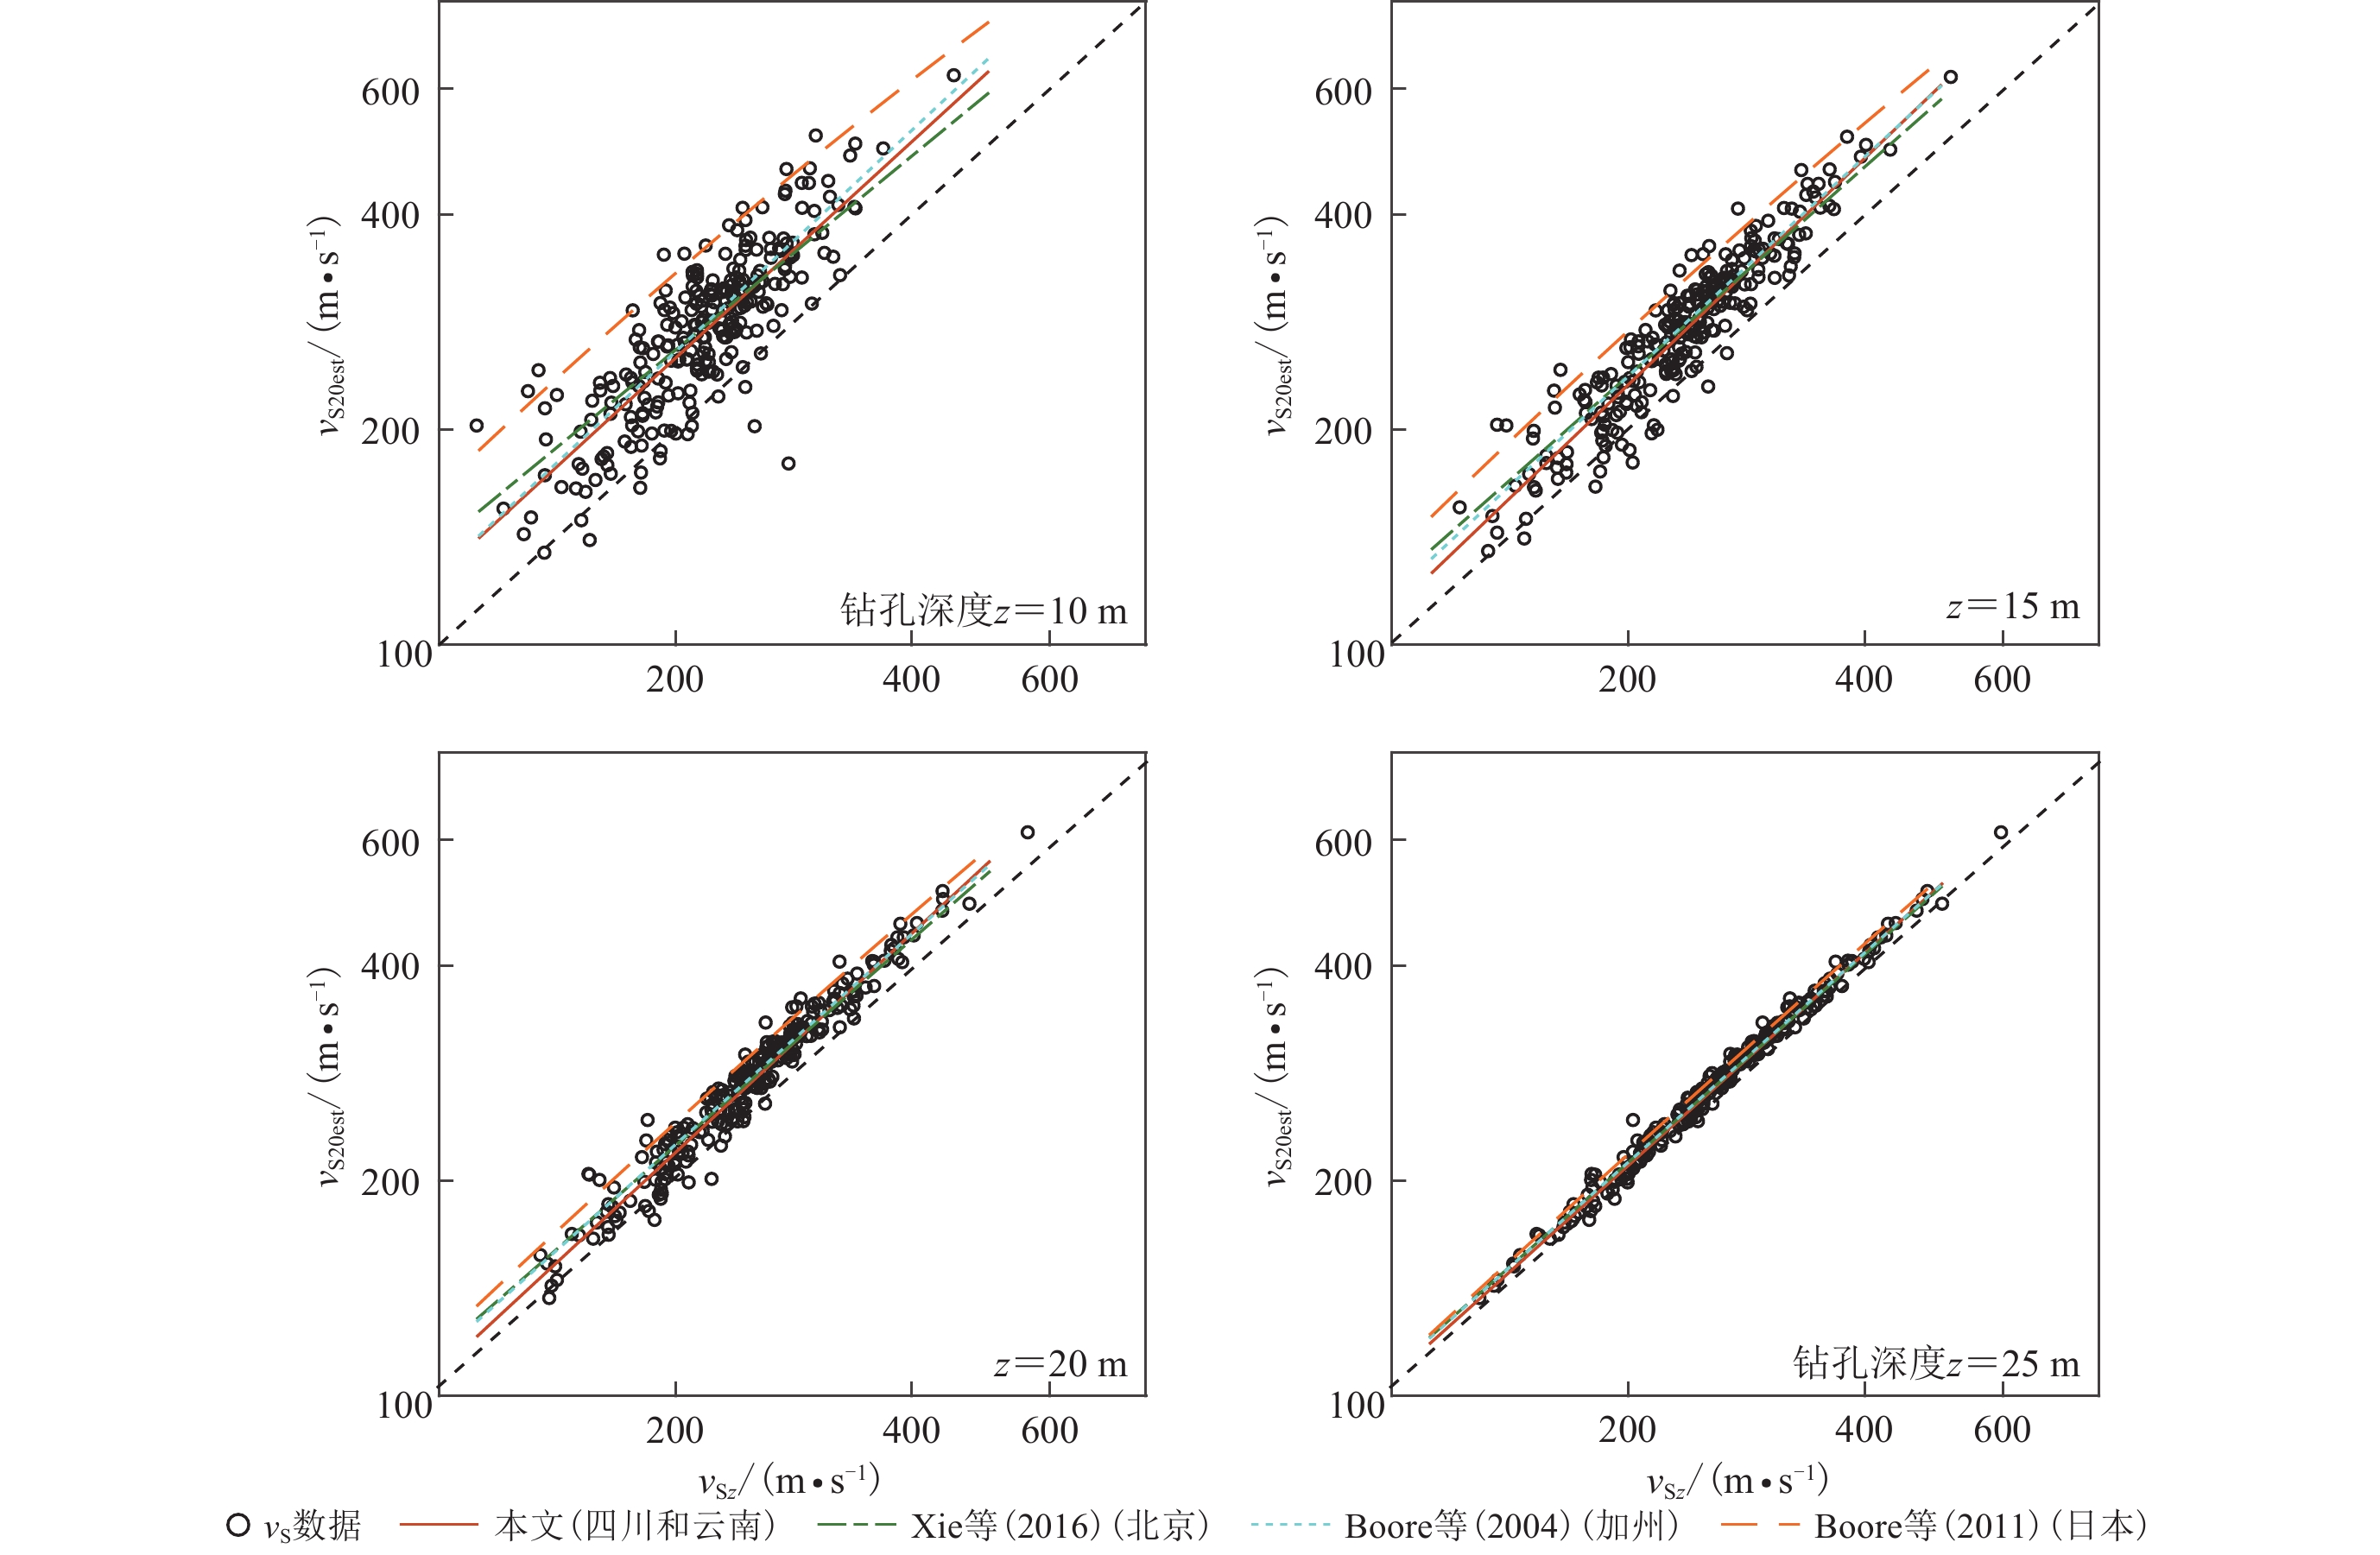
图4给出了钻孔深度分别为5,10,15和19 m时采用BCV方法对场地平均波速vS20进行预测的对比结果。可以看到,钻孔深度仅有5 m时,BCV方法的预测结果与实际波速有较大的偏差,会产生明显的低估,即波速估计值往往低于实际波速,表现为一些数据点位于1:1对角直线的下方。随着深度的增大,预测值与实际波速值越来越接近,数据点集中分布于对角直线附近。钻孔深度超过10 m时,BCV方法的预测结果与实际场地波速有较好的吻合。表2比较了采用BCV方法估计得到的平均波速vS20est与实测波速vS20的相关性,与表3中vS30预测的统计结果对比可以发现,在预测vS20时,由于20 m较30 m深度较浅,采用BCV方法基于常速度假设的波速更少,预测结果vS20est与实测波速vS20的相关性比vS30预测结果更好,当钻孔深度超过10 m时,采用BCV方法预测误差较小,该方法可以对场地平均波速vS20进行有效估计。
表 2 采用BCV方法的预测值vS20est与实测值vS20的相关系数r及BCV方法的预测误差标准差σRESTable 2. List of correlation coefficients r and standard deviation σRES of vS20est and vS20 by BCV method深度/m r σRES 深度/m r σRES 6 0.811 3 22.06 13 0.986 2 2.89 7 0.867 0 17.79 14 0.989 7 1.50 8 0.902 6 15.13 15 0.993 7 1.24 9 0.937 5 10.61 16 0.995 7 0.67 10 0.952 9 8.24 17 0.997 8 0.36 11 0.968 1 3.47 18 0.999 0 0.53 12 0.977 7 3.33 19 0.999 8 0.32 注:σRES为预测误差(估计值—实际值)的标准差,下同。 表 3 采用BCV方法的预测值vS30est与实测值vS30的相关系数r及BCV方法的预测误差标准差σRESTable 3. List of correlation coefficients r and standard deviation σRES of vS30est and vS30 by BCV method深度/m r σRES 深度/m r σRES 6 0.733 8 26.303 18 0.976 0 2.594 7 0.767 6 23.926 19 0.990 2 0.245 8 0.813 6 21.711 20 0.991 7 0.224 9 0.882 2 12.613 21 0.992 5 0.275 10 0.899 7 10.458 22 0.994 1 0.581 11 0.925 4 6.408 23 0.996 3 0.758 12 0.940 2 4.946 24 0.996 5 0.922 13 0.952 2 3.752 25 0.997 9 1.167 14 0.962 8 0.897 26 0.997 6 0.272 15 0.968 0 1.221 27 0.999 0 0.179 16 0.970 5 0.637 28 0.999 8 0.016 17 0.979 5 0.375 29 1.000 0 0.007 注意到,平均波速vS20与等效波速vSe既有联系也有区别,vSe是地表以下不超过20 m深度内覆盖土层的等效波速,其中20 m深度内的基岩层(剪切波速大于500 m/s的地层)不参与计算。因此,vSe不可能大于500 m/s,但平均波速vS20可能大于500 m/s。可以看到,图4中有少数钻孔数据点的vS20结果超过500 m/s,这是由于这些场点场地较硬,且覆盖土层厚度明显小于20 m,即20 m深度范围包含较厚的基岩层,在计算vS20时基岩层也包括其中。
基于BCV方法估算四川及云南地区的场地剪切波速,利用深度超过30 m的钻孔数据计算得到的平均波速估计值vS30est与实测波速vS30进行对比。图5给出了基于BCV方法估算的vS30est值与实际vS30值的对比结果,当已有波速资料深度小于15 m时,波速估计值往往低于实际波速,表现为一些数据点位于1:1对角直线的下方,在深度为5 m时,BCV方法的低估尤为明显,严重偏离了对角直线。随着深度的增大,预测值与实际波速值越来越接近。研究结果说明当波速资料深度较小时,BCV方法会明显低估实际平均波速值,随着深度的增大,预测的偏差变小,当已有波速深度超过15 m时,BCV方法可以有效地对场地vS30进行预测。表3统计了BCV方法的vS30est估计值与实测波速vS30对比得到的相关系数r和标准差σRES。通过对比发现,当已有波速资料深度较小时,BCV方法估计结果的偏差较大,但随着深度的增大,vS30est与vS30值的相关性越来越接近,20 m以上的相关性更好(相关系数>0.99),预测偏差整体呈减小趋势。
2.2 Boore方法
在地形起伏不大的地区,从地表向下,土层波速的变化强弱相对一致,不同深度的平均剪切波速与vS30之间存在较强的线性相关性(Boore,2004;Boore et al,2011)。Boore (2004)基于vSz与vS30之间的对数线性模型建立了加州地区剪切波速经验关系,即
$$ \mathit{{\rm{lg}}}{v}_{{\rm{S}}30}{\text{=}}{a}_{0}{\text{+}}{a}_{1}\mathit{{\rm{lg}}}{v}_{{{\rm{S}}{{\textit{z}}}}} {\text{,}} $$ (5) 式中,vSz为不同深度z的平均剪切波速值,a0和a1为回归系数。
这种统计模型具有区域性,不同区域的符合程度不同。Boore等(2011)结合大量的数据分析发现基于日本的数据得出的vS30值系统高于加州、土耳其、欧洲等国家和地区,进一步提出基于二次多项式的vS30预测模型。
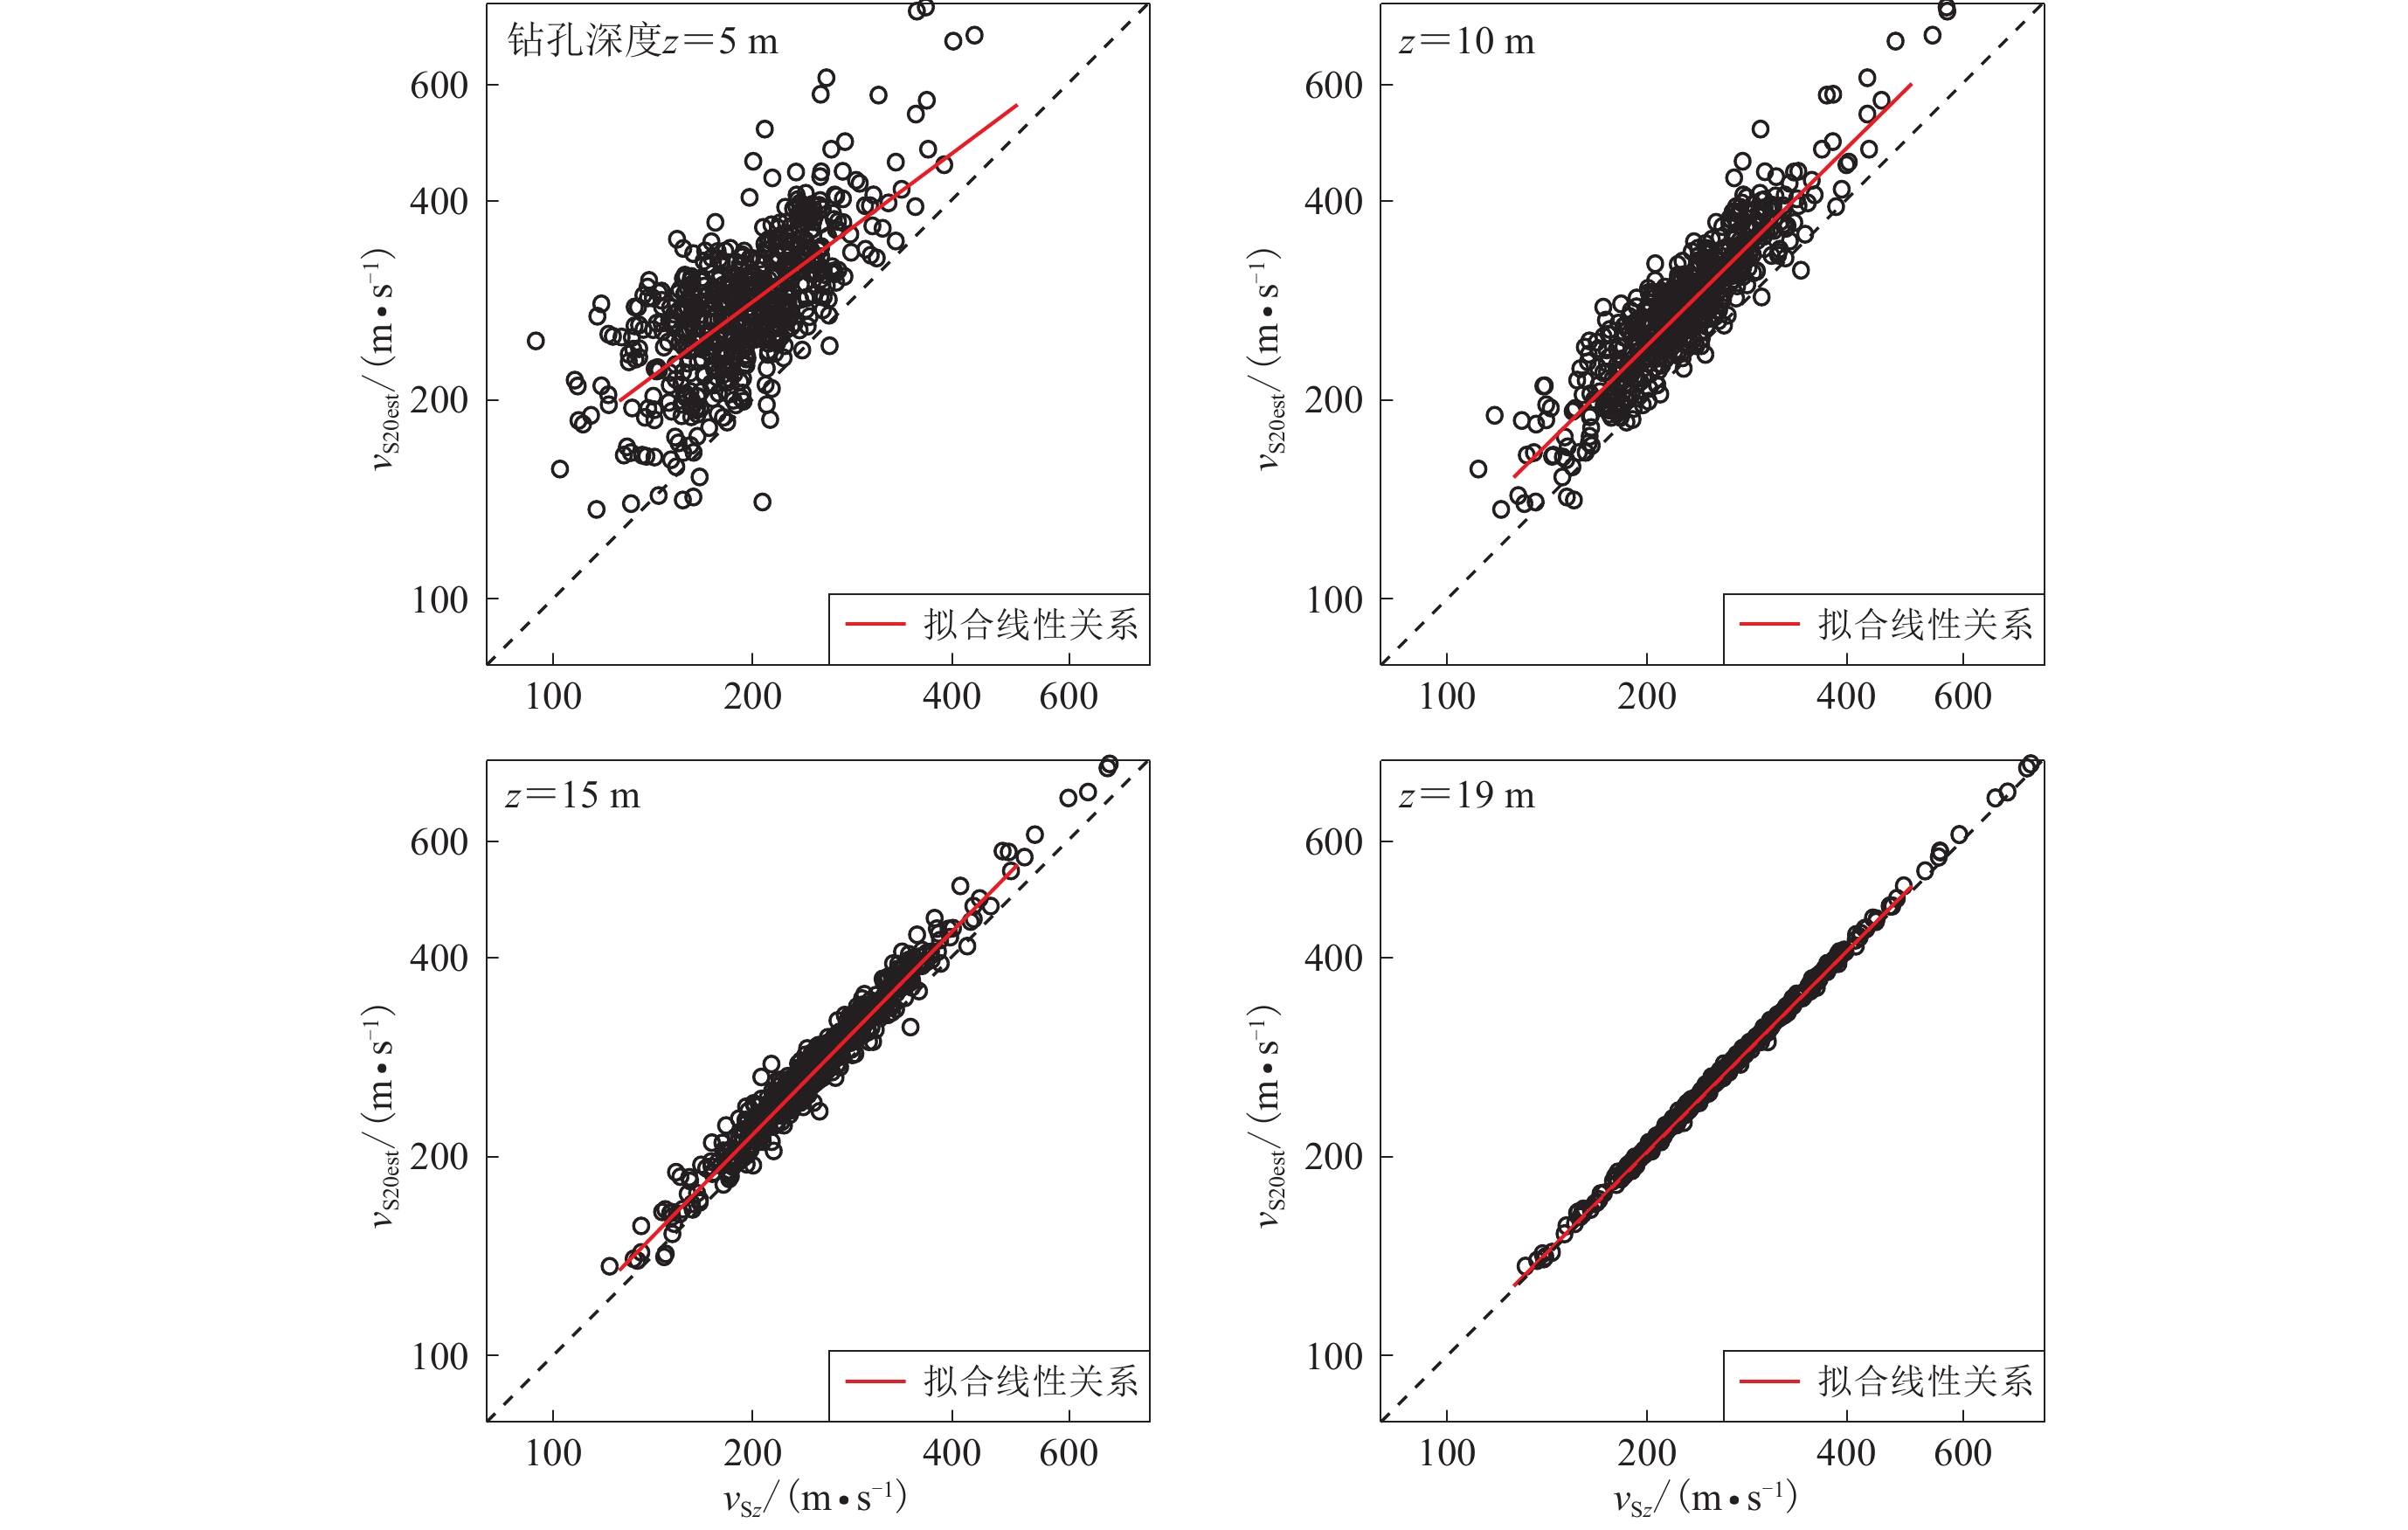
本研究先利用Boore对数线性方法 [ 式(5) ] 建立四川和云南地区vS20预测的经验关系,探讨我国四川和云南地区的区域vS20外推模型。利用该地区640个经对数化处理的钻孔数据预测值和真实值进行线性拟合,回归分析结果如表4所示,表4中给出了随深度z变化的回归系数、预测误差的标准差σRES和相关系数r的结果。当深度接近20 m时,标准差单调地减小为零,相关系数r随着深度的增大而增大,从最小值0.745增加到接近于1,这些结果表明对数线性模型与数据吻合得较好。图6给出了四川和云南地区的vSz-vS20实测数据以及拟合得到的区域vSz-vS20外推模型,可以看到不同深度的平均波速与vS20之间均有较好的线性关系。
表 4 类比Boore (2004)给出的vS30预测方法 [ 式(5) ] 建立四川和云南地区vS20预测经验关系的回归分析结果Table 4. Regression results of vS20 predictive empirical relationships for Sichuan and Yunnan regions based on Boore (2004) method of equation (5)深度/m a0 a1 相关系数 r σRES 深度/m a0 a1 相关系数 r σRES 6 0.824 0.537 0.745 0.072 13 1.025 −0.010 0.962 0.029 7 0.880 0.394 0.795 0.066 14 1.026 −0.021 0.974 0.025 8 0.925 0.277 0.835 0.059 15 1.024 −0.024 0.983 0.020 9 0.963 0.176 0.872 0.053 16 1.020 −0.021 0.990 0.016 10 0.992 0.097 0.902 0.047 17 1.014 −0.014 0.994 0.012 11 1.007 0.051 0.926 0.041 18 1.009 −0.010 0.997 0.008 12 1.021 0.009 0.947 0.035 19 1.005 −0.007 0.999 0.004 注:σRES为预测误差(此处取估计值相对于实际值的对数残差,即lg估计值−lg实际值)的标准差,下同。 基于同样的方法,我们利用深度超过30 m的271个钻孔数据建立四川和云南地区vS30预测的经验关系,表5给出了统计回归得到的回归系数、预测误差的标准差σRES和相关系数r随深度z变化的结果。图7给出了四川和云南地区的vSz-vS30实测数据以及拟合得到的区域vSz-vS30外推模型,并与北京平原、日本和美国加州地区的结果进行对比。分析认为,当场地波速较低(
$v_{{\rm{S}}{\textit{z}}} $ <300 m/s)时,四川和云南地区的vS30预测结果要低于北京和加州地区;当场地波速较高($v_{{\rm{S}}{\textit{z}}} $ >300 m/s)时,该地区vS30预测结果略高于北京和加州地区(在钻孔深度仅有10 m时例外,此时该地区vS30预测结果高于北京地区,但低于加州地区);日本地区波速则明显高于其它三个地区。与vS20的预测结果相比,在相同深度条件下,vS30外推模型拟合回归误差要略大,预测的相关系数也略低,这主要是由于超过30 m的钻孔数仅271个,比超过20 m的钻孔数据要少得多。表 5 基于Boore (2004)方法 [ 式(5) ] 建立四川和云南地区vS30预测经验关系的回归分析结果Table 5. Regression results of vS30 predictive empirical relationships for Sichuan and Yunnan regions based on Boore (2004) method深度/m a0 a1 相关系数r 标准差σRES 深度/m a0 a1 相关系数r 标准差σRES 6 1.458 0.440 0.445 0.101 1 18 −0.056 1.057 0.906 0.047 7 7 1.364 0.479 0.454 0.100 6 19 −0.064 1.058 0.921 0.044 0 8 1.191 0.553 0.492 0.098 3 20 −0.065 1.055 0.933 0.040 6 9 0.946 0.657 0.553 0.094 0 21 −0.062 1.052 0.944 0.037 2 10 0.734 0.746 0.607 0.089 7 22 −0.059 1.048 0.952 0.034 5 11 0.578 0.809 0.661 0.084 7 23 −0.060 1.046 0.961 0.031 4 12 0.455 0.859 0.706 0.079 9 24 −0.064 1.046 0.969 0.028 1 13 0.324 0.912 0.748 0.074 9 25 −0.064 1.044 0.975 0.025 0 14 0.208 0.958 0.789 0.069 3 26 −0.061 1.040 0.981 0.022 0 15 0.102 1.000 0.827 0.063 4 27 −0.053 1.035 0.985 0.019 3 16 0.021 1.031 0.861 0.057 4 28 −0.042 1.029 0.989 0.016 7 17 −0.040 1.053 0.888 0.051 9 29 −0.032 1.023 0.992 0.014 1 2.3 基于Markov独立过程的模型
Dai等(2013)根据Markov独立条件提出的vSz到vS30的外推模型,假设vS剖面从深度z=0 m开始是一个Markov的独立过程,将深度z处的瞬时剪切波速vS(z)与深度z到30 m的平均剪切波速vS[z, 30]之间建立相关关系,即
$$ \mathrm{l}\mathrm{g}{v}_{\mathrm{S}[{\textit{z}}{\text{,}}30]}{\text{=}}{c}_{0}{\text{+}}{c}_{1}\mathrm{l}\mathrm{g}{v}_{\mathrm{S}}{\text{(}}{\textit{z}}{\text{)}} {\text{,}} $$ (6) 式中,系数c0和c1由深度大于30 m的区域速度剖面数据回归分析确定,在获得深度从z到30 m的平均波速vS[z, 30]后,采用下式估算vS30值,即
$$ {v}_{{\rm{S}}30}{\text{=}}\frac{30}{\Delta {t}_{{\textit{z}}}{\text{+}}\dfrac{30{\text{-}}{{\textit{z}}}_{{\rm{p}}}}{{v}_{{\rm{S}}[{{\textit{z}}}_{{\rm{p}}}{\text{,}}30]}}} {\text{,}} $$ (7) 式中,vS[z, 30]为钻孔底部深度zp到30 m的平均剪切波速。
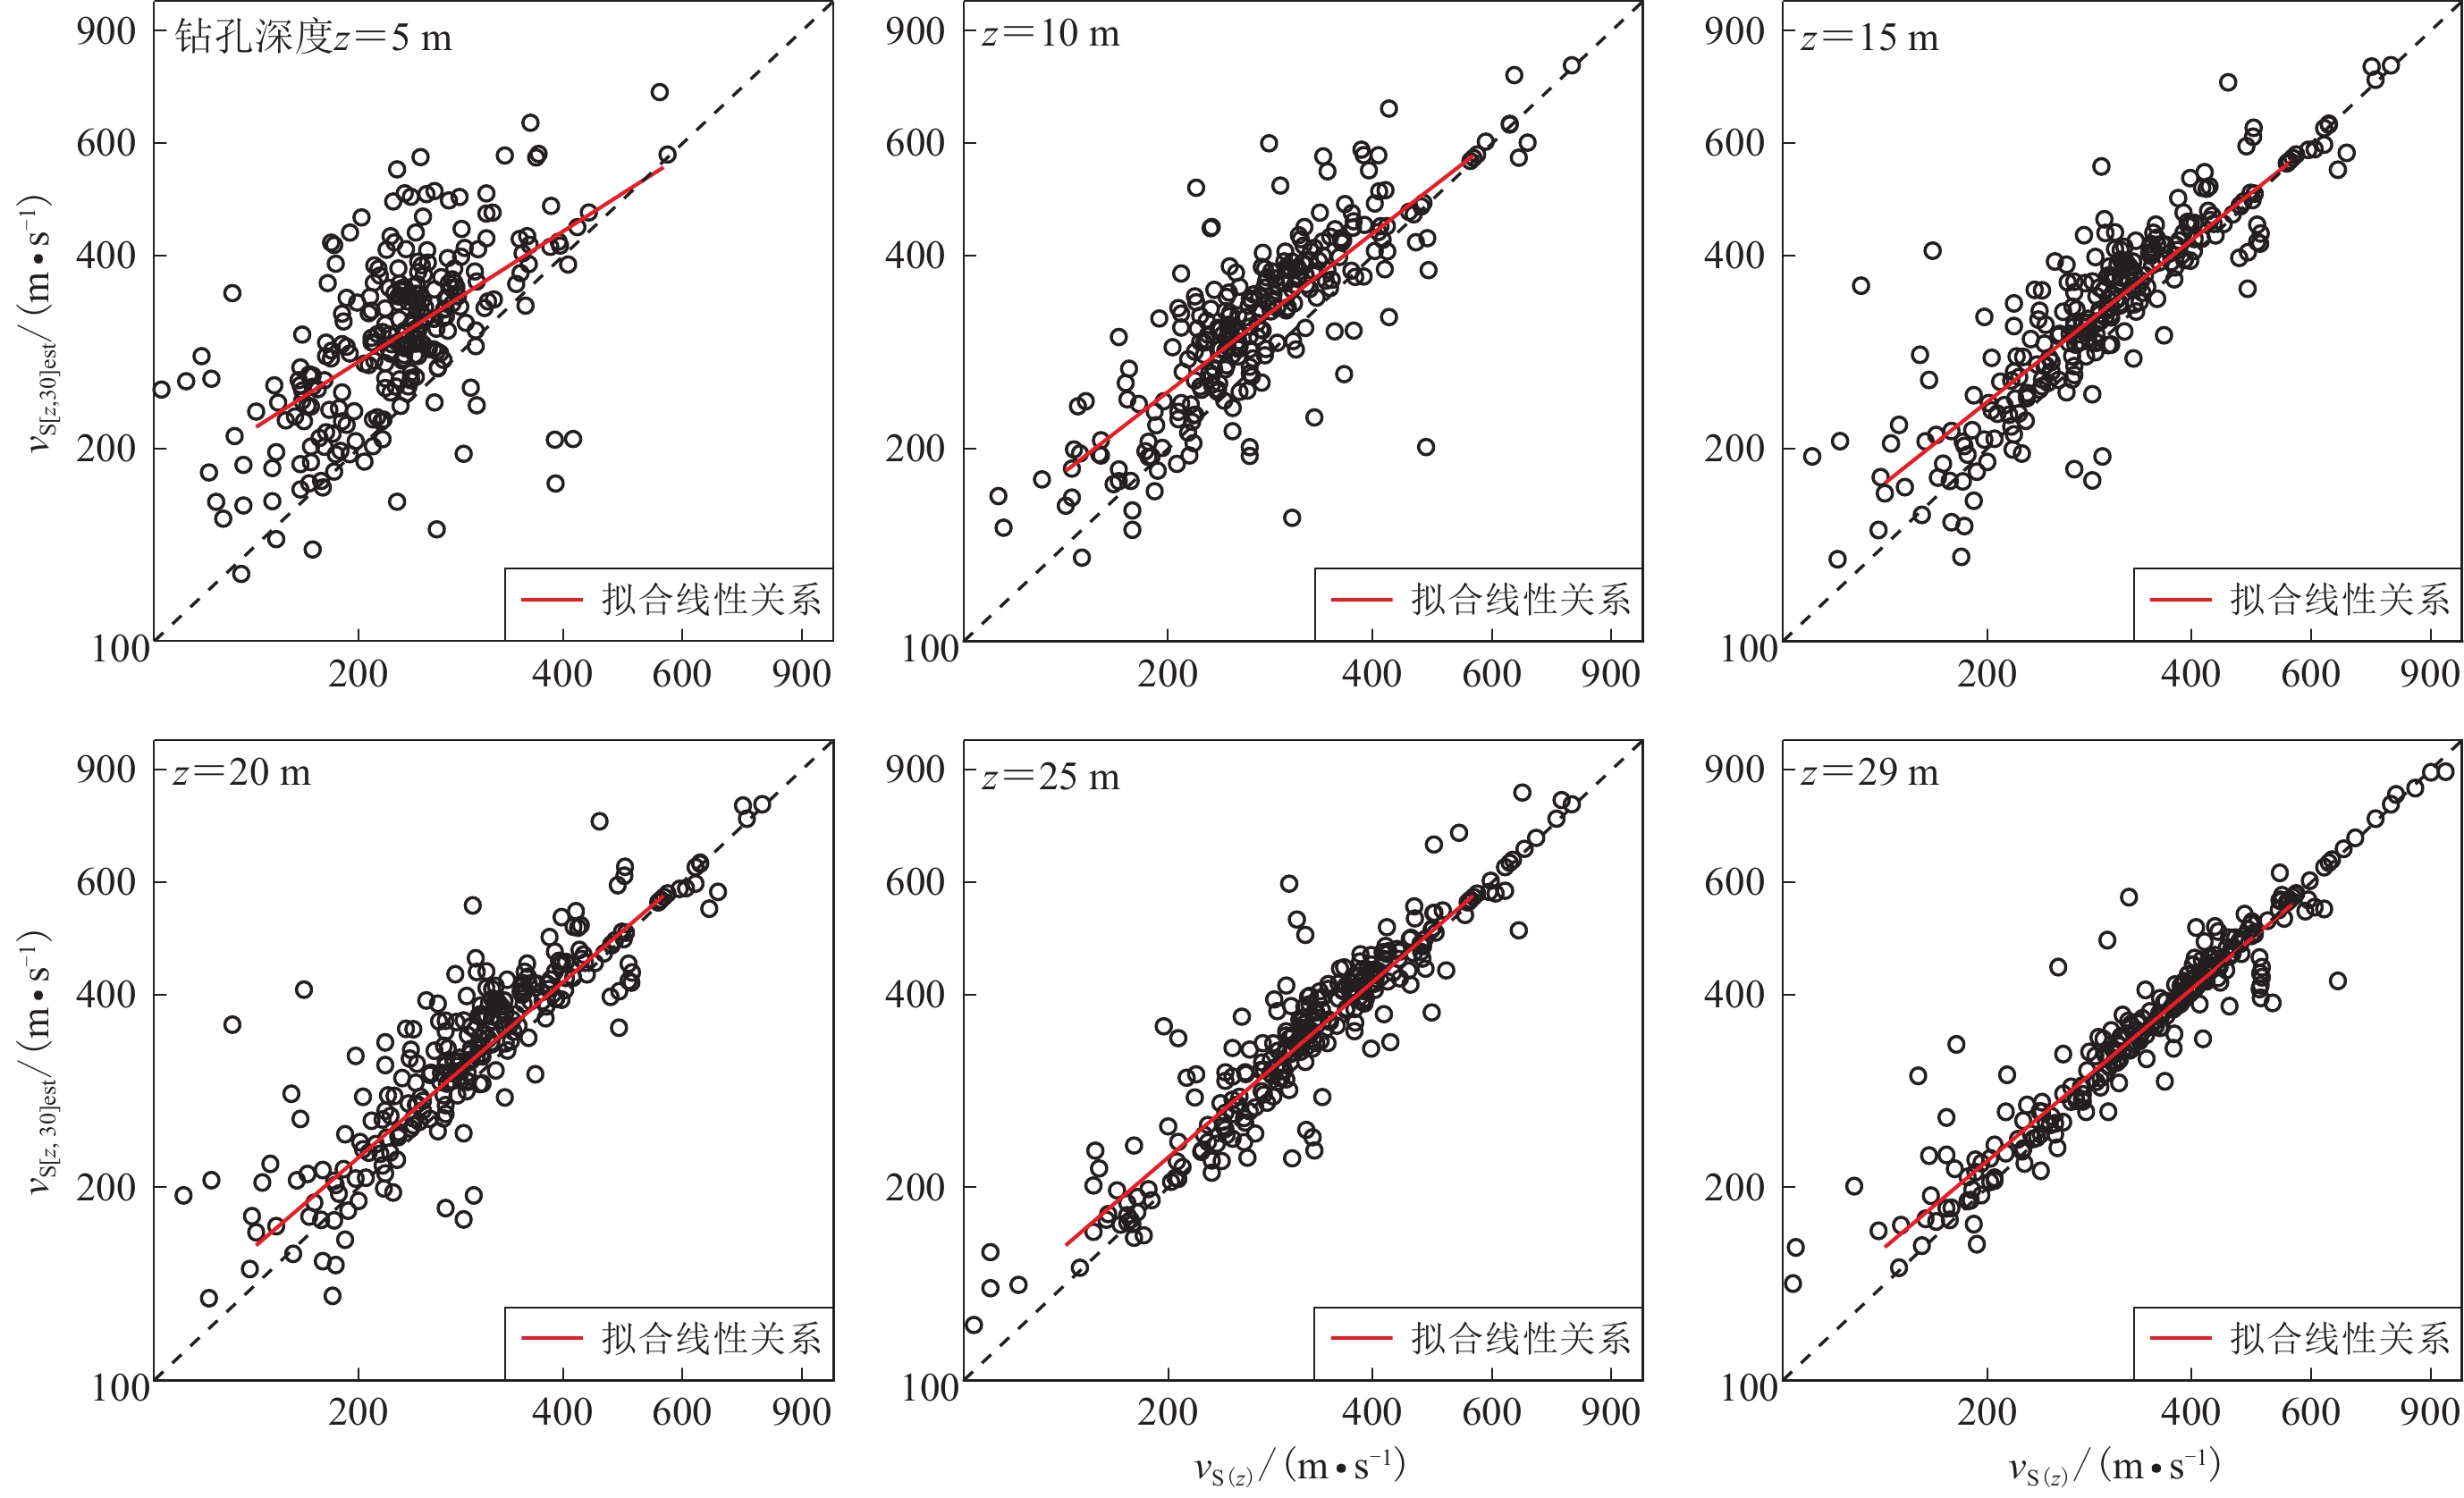
我们利用四川和云南地区深度超过30 m的271个钻孔数据,基于条件独立属性方法建立了该区域的vS30预测外推模型。图8显示了基于zp≥30 m的波速剖面数据得到的6个深度(5,10,15,20,25和29 m)的平均波速vS[z,30]与瞬时波速vS(z)的相关性。表6给出了拟合得到的适用于10—29 m之间不同剖面深度的回归系数及预测误差的标准差σRES和相关系数r。
![]() 图 8 基于条件独立模型得到不同深度下
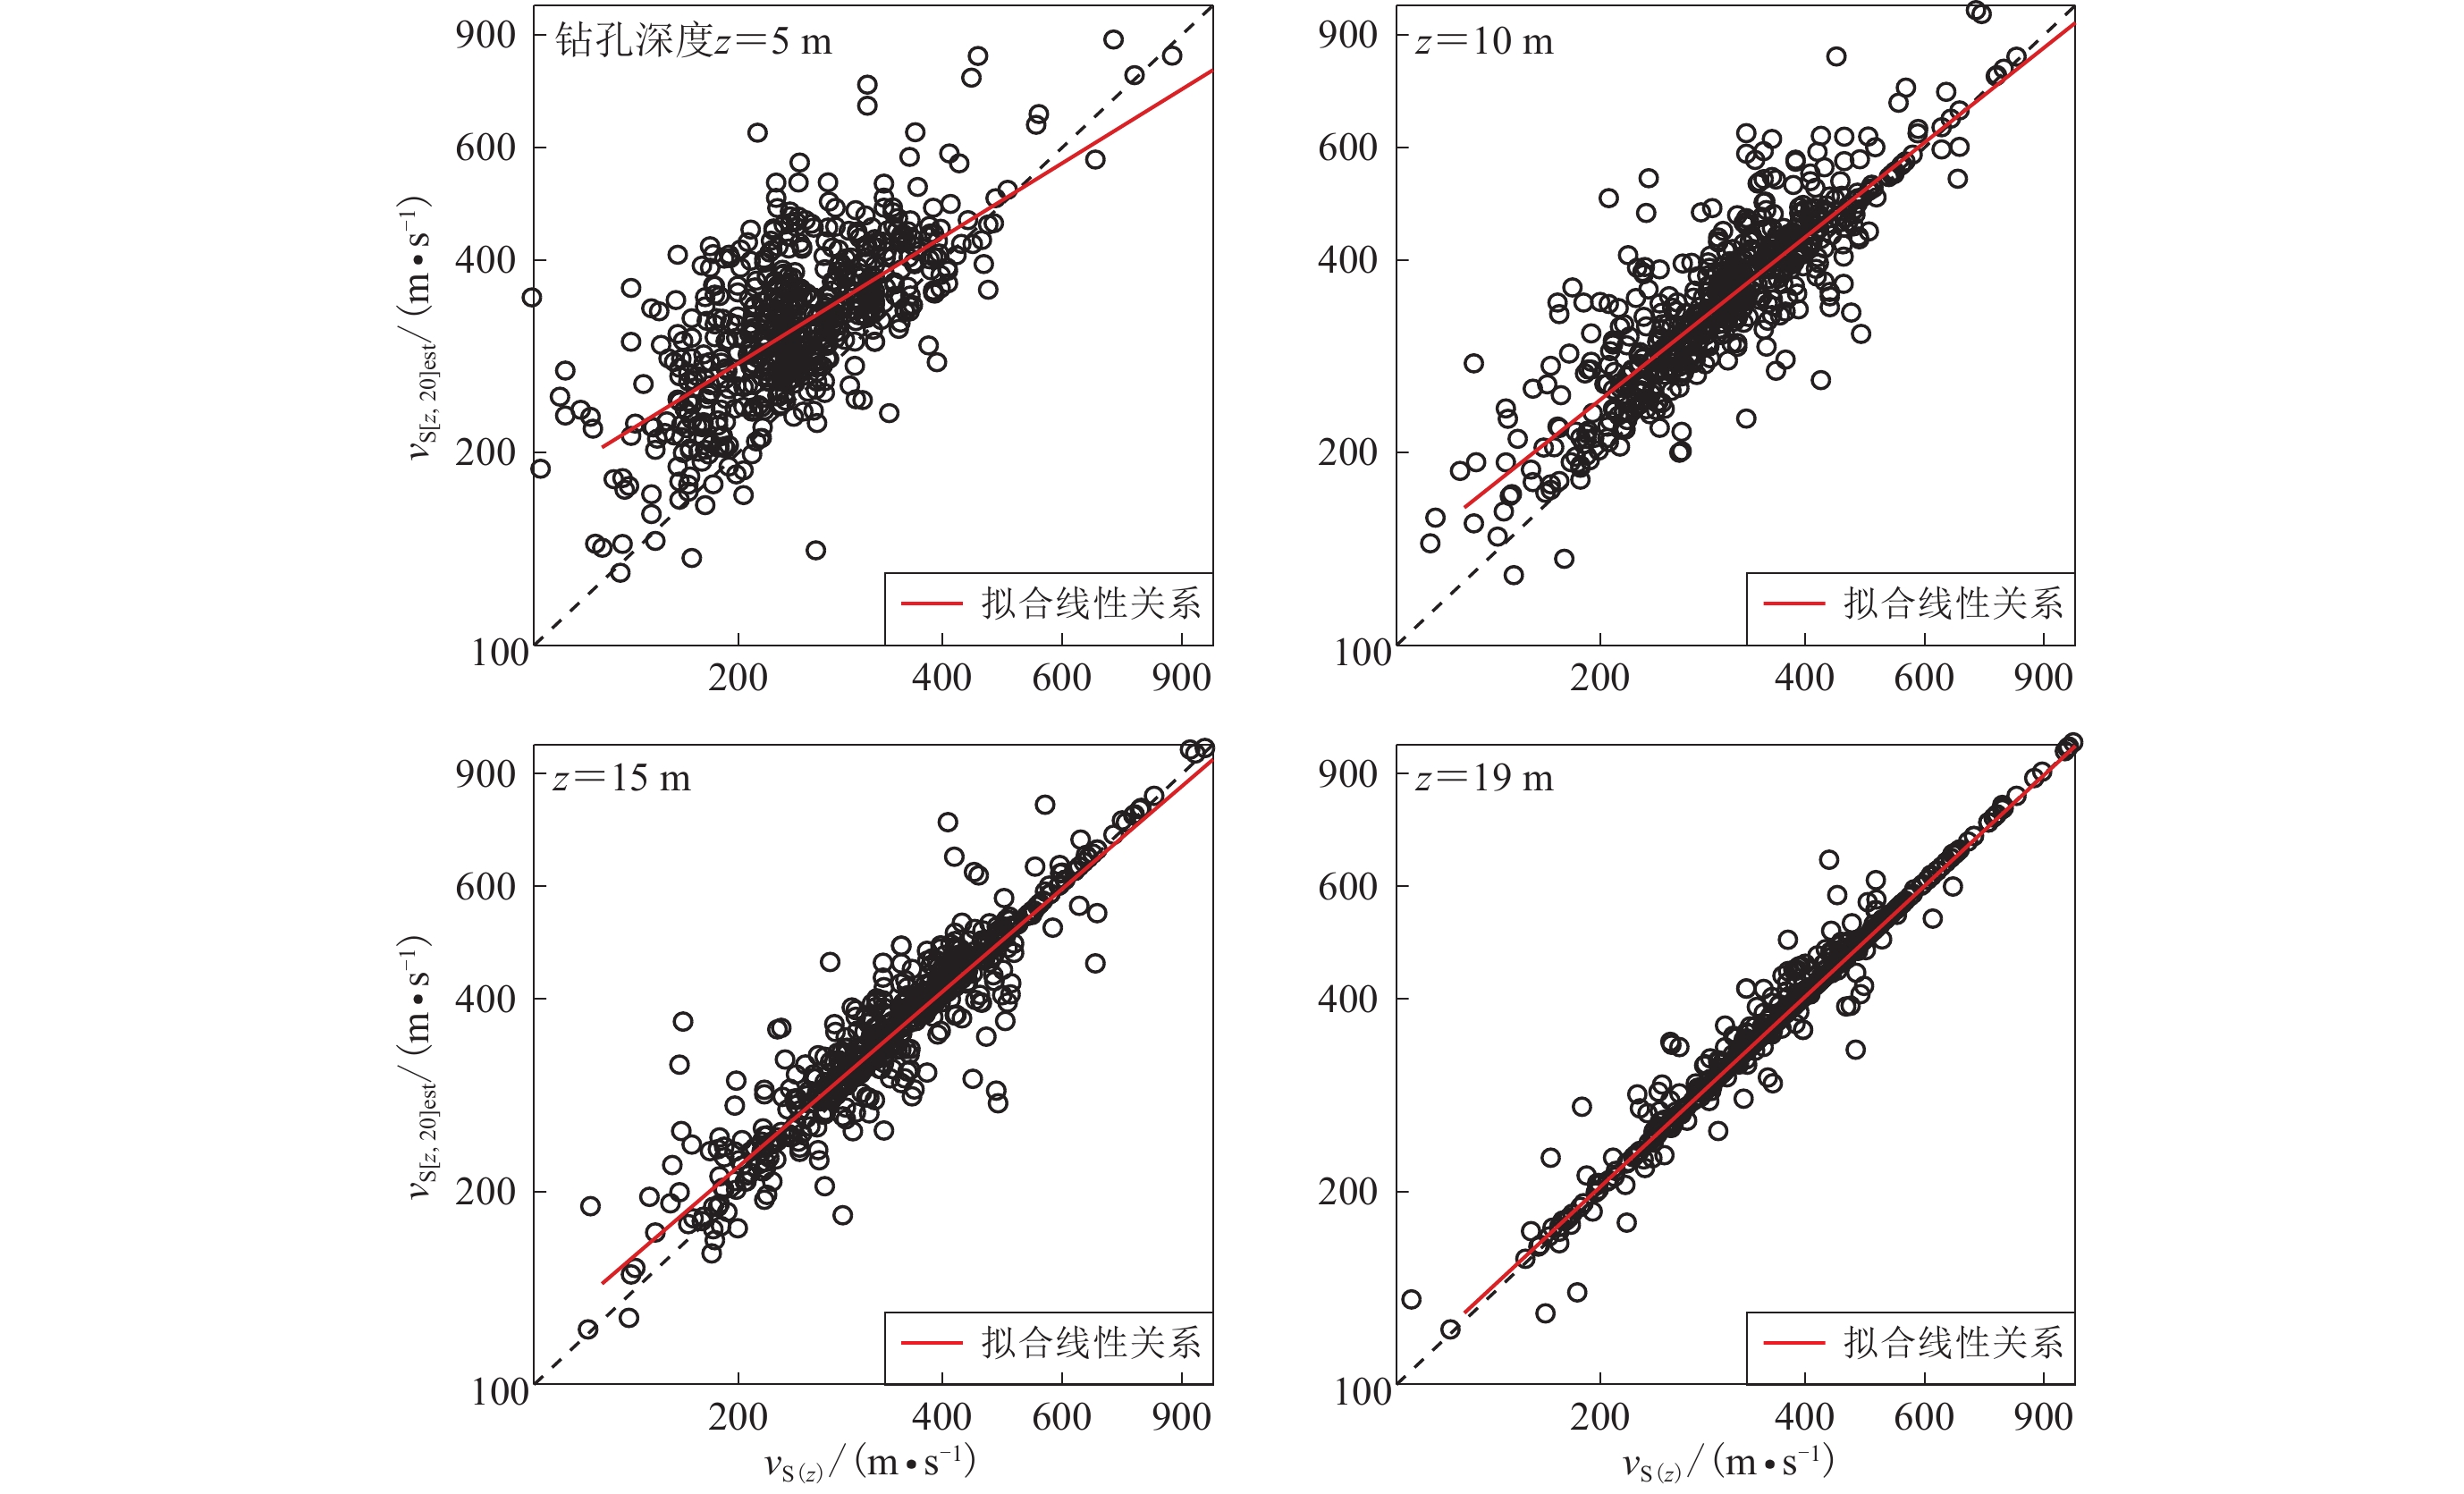
图 8 基于条件独立模型得到不同深度下${\rm{lg}}v_{{\rm{S}}[{\textit{z}}{\text{,}}30]}$ 与${\rm{lg}}v_{{\rm{S}}}{\text{(}}{\textit{z}}{\text{)}}$ 的拟合回归分析结果Figure 8. Regression results of${\rm{lg}}v_{{\rm{S}}[{\textit{z}}{\text{,}}30]} $ and${\rm{lg}}v_{{\rm{S}}}{\text{(}}{\textit{z}}{\text{)}} $ at different depths based on the conditional independence property model表 6 基于条件独立模型(式6)得到的$v_{{\rm{S}}[{\textit{z}}{\text{,}}30]} $ 与$v_{{\rm{S}}}{\text{(}}{\textit{z}}{\text{)}} $ 之间的经验关系Table 6. Regression results for$v_{{\rm{S}}[{\textit{z}}{\text{,}}30]} $ and$v_{{\rm{S}}}{\text{(}}{\textit{z}}{\text{)}} $ empirical relationships based on the conditional independence property model of equation 6深度/m ${c}_{0}$ ${c}_{1}$ 相关系数r 标准差σRES 深度/m ${c}_{0}$ ${c}_{1}$ 相关系数r 标准差σRES 6 1.038 0.608 0.649 0.153 18 0.338 0.878 0.885 0.118 7 0.882 0.669 0.666 0.150 19 0.265 0.908 0.928 0.118 8 0.651 0.762 0.723 0.146 20 0.255 0.909 0.934 0.118 9 0.481 0.831 0.821 0.141 21 0.295 0.893 0.930 0.117 10 0.499 0.822 0.823 0.134 22 0.313 0.885 0.927 0.116 11 0.561 0.796 0.849 0.136 23 0.326 0.879 0.933 0.114 12 0.530 0.806 0.843 0.136 24 0.387 0.854 0.907 0.118 13 0.426 0.847 0.861 0.134 25 0.289 0.892 0.944 0.094 14 0.494 0.820 0.877 0.128 26 0.279 0.895 0.943 0.095 15 0.442 0.840 0.878 0.125 27 0.154 0.942 0.960 0.080 16 0.522 0.808 0.865 0.123 28 0.063 0.977 0.979 0.064 17 0.359 0.870 0.895 0.120 29 0.067 0.975 0.986 0.057 基于同样的方法,我们利用深度超过20 m的640个钻孔数据建立了四川和云南地区的vS20预测外推模型。图9显示了基于zp≥20 m的波速剖面数据得到的4个深度(5,10,15和19 m)的平均波速vS[z,20]与瞬时波速vS(z)的相关性。表7给出了拟合得到的适用于10—19 m之间不同剖面深度的回归系数以及预测误差的标准差σRES和相关系数r。
![]() 图 9 基于条件独立模型得到不同深度下
图 9 基于条件独立模型得到不同深度下${\rm{lg}}v_{{\rm{S}}[{\textit{z}}{\text{,}}20]} $ 与${\rm{lg}}v_{{\rm{S}}}{\text{(}}{\textit{z}}{\text{)}} $ 的拟合回归分析结果Figure 9. Regression results of${\rm{lg}}v_{{\rm{S}}[{\textit{z}}{\text{,}}20]} $ and${\rm{lg}}v_{{\rm{S}}}{\text{(}}{\textit{z}}{\text{)}} $ at different depths based on the conditional independence property model表 7 基于条件独立模型 [ 式(6) ] 得到$v_{{\rm{S}}[{\textit{z}}{\text{,}}20]} $ 与$v_{{\rm{S}}}{\text{(}}{\textit{z}}{\text{)}} $ 之间的经验关系Table 7. Regression results for$v_{{\rm{S}}[{\textit{z}}{\text{,}}20]} $ and$v_{{\rm{S}}}{\text{(}}{\textit{z}}{\text{)}} $ empirical relationships based on the conditional independence property model of equation (6)深度/m ${c}_{0}$ ${c}_{1}$ 相关系数r 标准差σRES 深度/m ${c}_{0}$ ${c}_{1}$ 相关系数r 标准差σRES 6 1.161 0.648 0.698 0.152 13 0.591 0.915 0.923 0.110 7 1.012 0.712 0.725 0.147 14 0.717 0.878 0.925 0.107 8 0.826 0.791 0.778 0.140 15 0.690 0.903 0.936 0.099 9 0.679 0.855 0.850 0.132 16 0.792 0.882 0.939 0.099 10 0.712 0.847 0.852 0.128 17 0.777 0.913 0.952 0.089 11 0.807 0.815 0.875 0.126 18 0.768 0.951 0.962 0.081 12 0.739 0.849 0.884 0.123 19 0.838 0.978 0.984 0.061 3. 不同外推方法的对比
通过对比模型在不同深度的预测总误差,我们比较了本研究中基于不同方法建立的区域外推模型的适用性。我们将总误差定义为波速观测值与估计值之间的二次平均对数偏差,以20 m平均剪切波速vS20的估计为例,误差采用下式计算,即
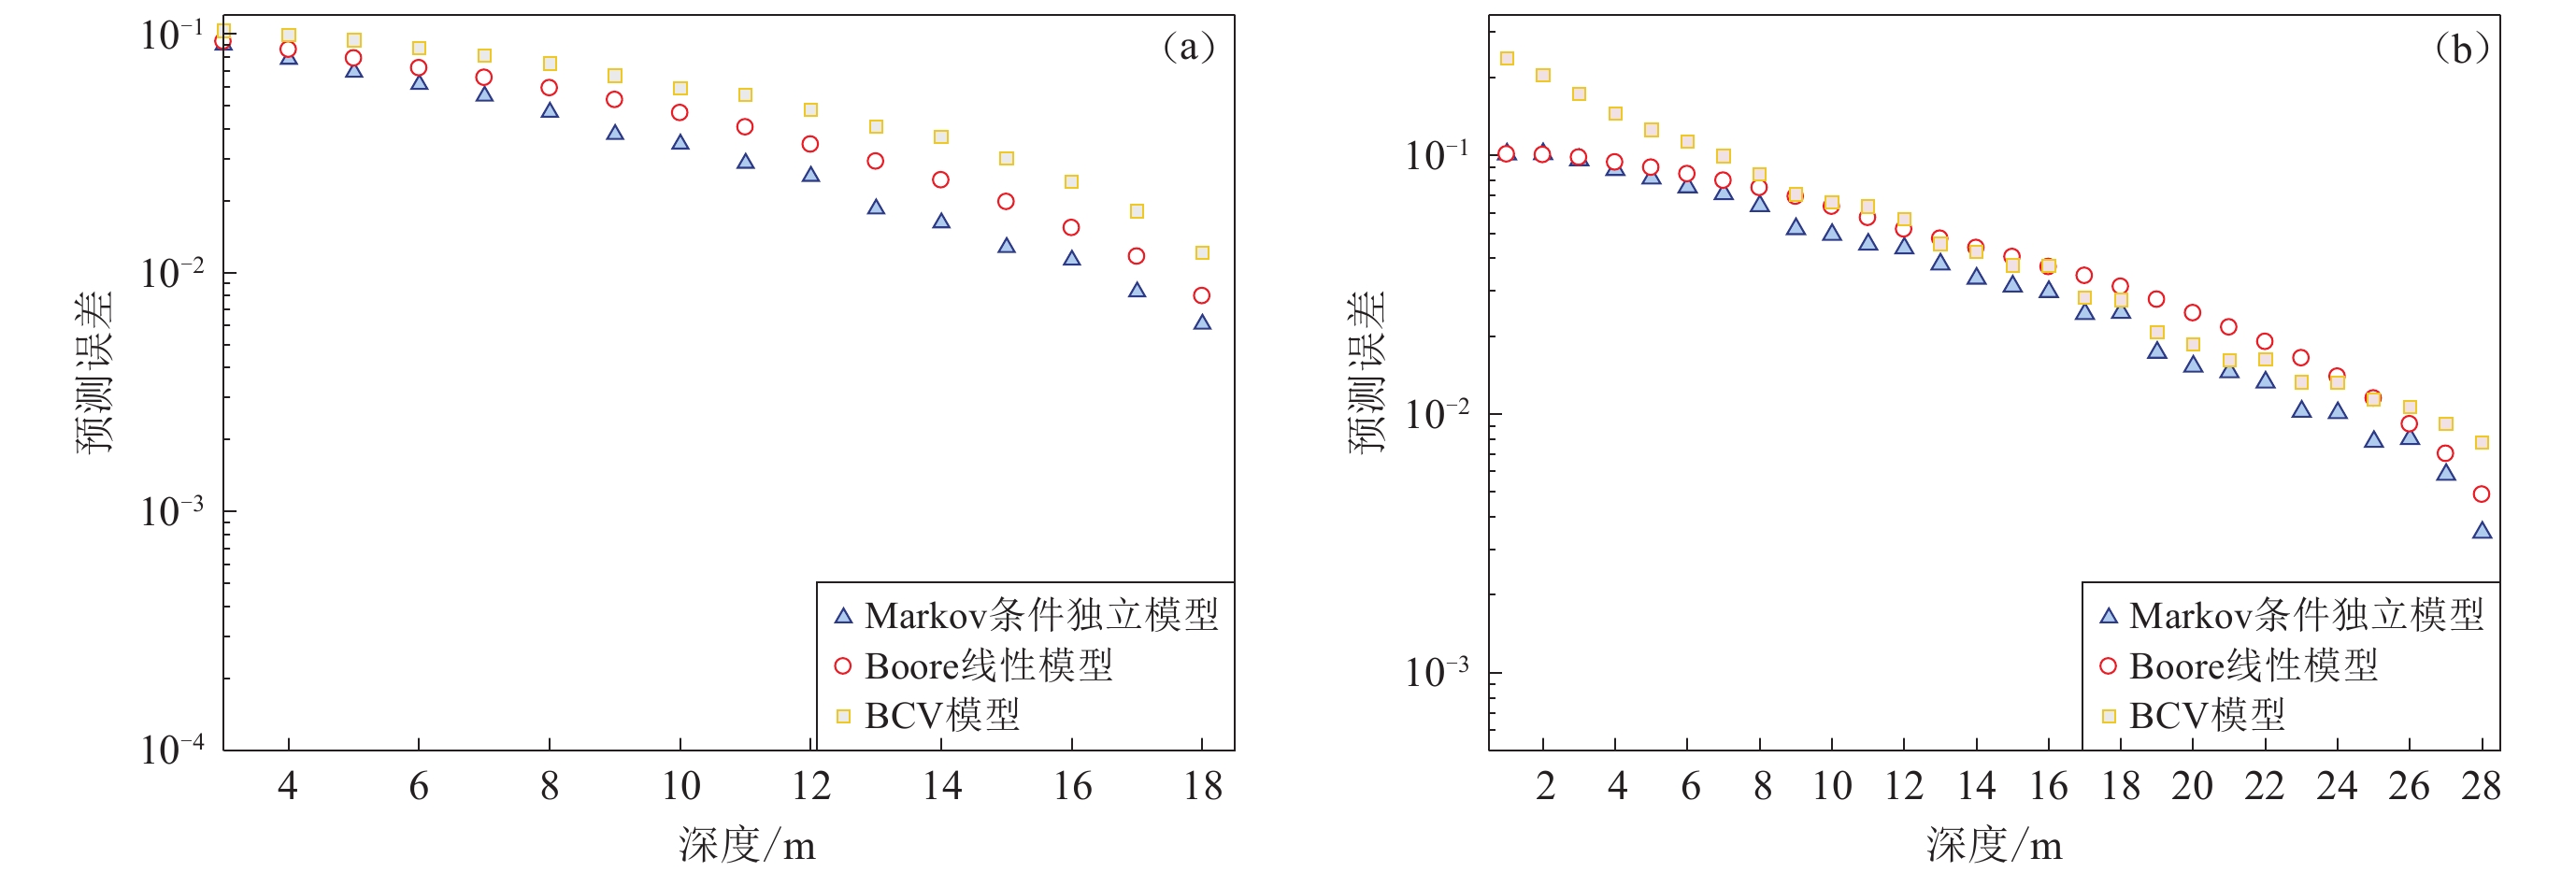
$$ e{\text{=}}\sqrt{\frac{1}{N}\sum _{i{\text{=}}1}^{N}{\text{(}}{\mathrm{lg}{v}_{{{\rm{S}}20}{\rm{est}}}{\text{-}}\mathrm{lg}{{}v}_{{\rm{S}}20}}{\text{)}}_{i}^{2}} {\text{,}} $$ (8) 式中,i表示第i个数据点,N表示数据库中数据点总数。图10a显示了本研究中分别基于三种方法建立的四川和云南地区vS20外推关系的误差比较。我们对5—18 m之间的不同深度进行了误差计算,增量为1 m。对比可以发现,三种方法中BCV模型的预测误差最大,基于条件独立性模型的预测关系在深度为10—18 m时误差均为最小。该结果表明,基于条件独立性模型的外推方法可以更好地估计超过钻孔深度的未知部分的波速值。这是因为理论上,相比于地表到钻孔底部的平均波速值vSz,钻孔底部的波速瞬时值与速度剖面的未知部分(即钻孔底部到计算所需深度之间)的波速具有更好的相关性。
图10b给出了基于BCV模型、Boore对数线性模型和Markov条件独立性模型三种方法建立的四川和云南地区区域vS30经验预测模型的误差比较结果。可以看到,由于深度30 m以上钻孔数据较20 m的要少,误差计算结果的稳定性较弱,表现为基于Boore方法得到的区域预测模型的误差在钻孔深度小于9 m时小于BCV方法,在钻孔深度介于17—23 m时误差大于BCV方法,在钻孔深度25 m以上时小于BCV方法。但从整体上看,基于条件独立性模型的外推方法建立的区域预测模型的误差要小于Boore方法和BCV方法。根据以上对比分析结果,本文建议优先采用基于条件独立性方法建立的四川和云南地区区域预测模型。
4. 讨论与结论
局部场地条件对地表观测的地震动强度和产生的震害有重要影响,覆盖土层的平均剪切波速是考虑局部场地影响进行场地分类的重要参数。本文利用四川和云南地区获取的973个钻孔的岩性和波速测量数据开展了区域平均剪切波速预测模型的研究,分别基于BCV方法、Boore对数线性模型和Markov条件独立性假定提出了该地区场地波速vS20和vS30的预测经验模型,对比分析了这3种经验预测的外推方法的误差,给出了平均剪切波速预测模型选用的建议。研究获得如下主要认识:
1) 当波速资料深度较小时,BCV方法会明显低估实际平均波速值。根据本文研究结果,我们认为对于钻孔深度小于10 m的情况,由于BCV方法预测的误差较大,不建议采用此方法进行场地波速预测和场地类别判定。当钻孔资料深度分别超过10 m和15 m时,方可采用BCV方法进行vS20和vS30预测。
2) 在采用Boore方法建立区域经验预测模型时,通过对不同地区的波速经验预测结果进行对比,结果表明四川和云南地区vS30预测模型结果与北京和美国加州地区较接近,但在较高波速区间,vS30波速值则略高于北京和加州地区且日本地区波速则明显高于其它三个地区。
3) 通过对比分别基于BCV模型、Boore对数线性模型和Markov条件独立性模型三种外推方法在不同深度的预测总误差,表明BCV模型的预测误差相对较大,基于条件独立性模型的预测关系在不同深度时误差均为最小。本文建议优先采用基于条件独立性方法建立的四川和云南地区剪切波速区域预测模型。
需要指出的是,本文分析结果表明,在钻孔资料深度小于10 m,采用经验外推方法建立的vS20和vS30区域预测模型的误差较大。建议谨慎使用本文给出的深度小于10 m的外推模型结果。此外,文中场地平均波速与我国规范中使用的等效波速vSe既有联系也有区别,在使用本文的平均波速经验预测模型进行场地分类时需要先将平均波速转换为等效波速vSe,即需要先结合场地的覆盖土层厚度选取合适的波速计算深度。当场地覆盖土层的厚度不足20 m,如仅为15 m时,应取地表以下15 m深度的平均波速vS15预测结果为覆盖土层的等效波速。
云南省地震局崔建文研究员、林国良工程师、张潜工程师,四川省地震局江鹏工程师和中国地震局工程力学研究所任叶飞研究员对本研究提供了指导和帮助,作者在此一并表示感谢。
-
图 1 收集的四川和云南地区973个钻孔的位置分布
Ⅰ : 扬子准地台;Ⅱ : 秦岭—大别造山带;Ⅲ : 松潘—甘孜造山带;Ⅳ : 羌塘地带;Ⅴ : 中缅地块;Ⅵ : 改则—那曲造山带;Ⅶ : 右江造山带
Figure 1. Location of 973 borehole sites of Sichuan and Yunnan Provinces used in this study
Ⅰ : Yantze paraplatform;Ⅱ : Qinling-Dabie orogenic belt;Ⅲ : Songpan-Garze orogenic belt;Ⅳ : Qiangtang block;Ⅴ : China-Myanmar block;Ⅵ : Greze-Nakchu orogenic belt;Ⅶ : Youjiang orogenic belt
图 8 基于条件独立模型得到不同深度下
${\rm{lg}}v_{{\rm{S}}[{\textit{z}}{\text{,}}30]}$ 与${\rm{lg}}v_{{\rm{S}}}{\text{(}}{\textit{z}}{\text{)}}$ 的拟合回归分析结果Figure 8. Regression results of
${\rm{lg}}v_{{\rm{S}}[{\textit{z}}{\text{,}}30]} $ and${\rm{lg}}v_{{\rm{S}}}{\text{(}}{\textit{z}}{\text{)}} $ at different depths based on the conditional independence property model图 9 基于条件独立模型得到不同深度下
${\rm{lg}}v_{{\rm{S}}[{\textit{z}}{\text{,}}20]} $ 与${\rm{lg}}v_{{\rm{S}}}{\text{(}}{\textit{z}}{\text{)}} $ 的拟合回归分析结果Figure 9. Regression results of
${\rm{lg}}v_{{\rm{S}}[{\textit{z}}{\text{,}}20]} $ and${\rm{lg}}v_{{\rm{S}}}{\text{(}}{\textit{z}}{\text{)}} $ at different depths based on the conditional independence property model表 1 钻孔深度统计表
Table 1 Drilling depth statistics
钻孔深度d /m 钻孔个数 0<d<5 3 5≤d<20 330 20≤d<30 369 d≥30 271 表 2 采用BCV方法的预测值vS20est与实测值vS20的相关系数r及BCV方法的预测误差标准差σRES
Table 2 List of correlation coefficients r and standard deviation σRES of vS20est and vS20 by BCV method
深度/m r σRES 深度/m r σRES 6 0.811 3 22.06 13 0.986 2 2.89 7 0.867 0 17.79 14 0.989 7 1.50 8 0.902 6 15.13 15 0.993 7 1.24 9 0.937 5 10.61 16 0.995 7 0.67 10 0.952 9 8.24 17 0.997 8 0.36 11 0.968 1 3.47 18 0.999 0 0.53 12 0.977 7 3.33 19 0.999 8 0.32 注:σRES为预测误差(估计值—实际值)的标准差,下同。 表 3 采用BCV方法的预测值vS30est与实测值vS30的相关系数r及BCV方法的预测误差标准差σRES
Table 3 List of correlation coefficients r and standard deviation σRES of vS30est and vS30 by BCV method
深度/m r σRES 深度/m r σRES 6 0.733 8 26.303 18 0.976 0 2.594 7 0.767 6 23.926 19 0.990 2 0.245 8 0.813 6 21.711 20 0.991 7 0.224 9 0.882 2 12.613 21 0.992 5 0.275 10 0.899 7 10.458 22 0.994 1 0.581 11 0.925 4 6.408 23 0.996 3 0.758 12 0.940 2 4.946 24 0.996 5 0.922 13 0.952 2 3.752 25 0.997 9 1.167 14 0.962 8 0.897 26 0.997 6 0.272 15 0.968 0 1.221 27 0.999 0 0.179 16 0.970 5 0.637 28 0.999 8 0.016 17 0.979 5 0.375 29 1.000 0 0.007 表 4 类比Boore (2004)给出的vS30预测方法 [ 式(5) ] 建立四川和云南地区vS20预测经验关系的回归分析结果
Table 4 Regression results of vS20 predictive empirical relationships for Sichuan and Yunnan regions based on Boore (2004) method of equation (5)
深度/m a0 a1 相关系数 r σRES 深度/m a0 a1 相关系数 r σRES 6 0.824 0.537 0.745 0.072 13 1.025 −0.010 0.962 0.029 7 0.880 0.394 0.795 0.066 14 1.026 −0.021 0.974 0.025 8 0.925 0.277 0.835 0.059 15 1.024 −0.024 0.983 0.020 9 0.963 0.176 0.872 0.053 16 1.020 −0.021 0.990 0.016 10 0.992 0.097 0.902 0.047 17 1.014 −0.014 0.994 0.012 11 1.007 0.051 0.926 0.041 18 1.009 −0.010 0.997 0.008 12 1.021 0.009 0.947 0.035 19 1.005 −0.007 0.999 0.004 注:σRES为预测误差(此处取估计值相对于实际值的对数残差,即lg估计值−lg实际值)的标准差,下同。 表 5 基于Boore (2004)方法 [ 式(5) ] 建立四川和云南地区vS30预测经验关系的回归分析结果
Table 5 Regression results of vS30 predictive empirical relationships for Sichuan and Yunnan regions based on Boore (2004) method
深度/m a0 a1 相关系数r 标准差σRES 深度/m a0 a1 相关系数r 标准差σRES 6 1.458 0.440 0.445 0.101 1 18 −0.056 1.057 0.906 0.047 7 7 1.364 0.479 0.454 0.100 6 19 −0.064 1.058 0.921 0.044 0 8 1.191 0.553 0.492 0.098 3 20 −0.065 1.055 0.933 0.040 6 9 0.946 0.657 0.553 0.094 0 21 −0.062 1.052 0.944 0.037 2 10 0.734 0.746 0.607 0.089 7 22 −0.059 1.048 0.952 0.034 5 11 0.578 0.809 0.661 0.084 7 23 −0.060 1.046 0.961 0.031 4 12 0.455 0.859 0.706 0.079 9 24 −0.064 1.046 0.969 0.028 1 13 0.324 0.912 0.748 0.074 9 25 −0.064 1.044 0.975 0.025 0 14 0.208 0.958 0.789 0.069 3 26 −0.061 1.040 0.981 0.022 0 15 0.102 1.000 0.827 0.063 4 27 −0.053 1.035 0.985 0.019 3 16 0.021 1.031 0.861 0.057 4 28 −0.042 1.029 0.989 0.016 7 17 −0.040 1.053 0.888 0.051 9 29 −0.032 1.023 0.992 0.014 1 表 6 基于条件独立模型(式6)得到的
$v_{{\rm{S}}[{\textit{z}}{\text{,}}30]} $ 与$v_{{\rm{S}}}{\text{(}}{\textit{z}}{\text{)}} $ 之间的经验关系Table 6 Regression results for
$v_{{\rm{S}}[{\textit{z}}{\text{,}}30]} $ and$v_{{\rm{S}}}{\text{(}}{\textit{z}}{\text{)}} $ empirical relationships based on the conditional independence property model of equation 6深度/m ${c}_{0}$ ${c}_{1}$ 相关系数r 标准差σRES 深度/m ${c}_{0}$ ${c}_{1}$ 相关系数r 标准差σRES 6 1.038 0.608 0.649 0.153 18 0.338 0.878 0.885 0.118 7 0.882 0.669 0.666 0.150 19 0.265 0.908 0.928 0.118 8 0.651 0.762 0.723 0.146 20 0.255 0.909 0.934 0.118 9 0.481 0.831 0.821 0.141 21 0.295 0.893 0.930 0.117 10 0.499 0.822 0.823 0.134 22 0.313 0.885 0.927 0.116 11 0.561 0.796 0.849 0.136 23 0.326 0.879 0.933 0.114 12 0.530 0.806 0.843 0.136 24 0.387 0.854 0.907 0.118 13 0.426 0.847 0.861 0.134 25 0.289 0.892 0.944 0.094 14 0.494 0.820 0.877 0.128 26 0.279 0.895 0.943 0.095 15 0.442 0.840 0.878 0.125 27 0.154 0.942 0.960 0.080 16 0.522 0.808 0.865 0.123 28 0.063 0.977 0.979 0.064 17 0.359 0.870 0.895 0.120 29 0.067 0.975 0.986 0.057 表 7 基于条件独立模型 [ 式(6) ] 得到
$v_{{\rm{S}}[{\textit{z}}{\text{,}}20]} $ 与$v_{{\rm{S}}}{\text{(}}{\textit{z}}{\text{)}} $ 之间的经验关系Table 7 Regression results for
$v_{{\rm{S}}[{\textit{z}}{\text{,}}20]} $ and$v_{{\rm{S}}}{\text{(}}{\textit{z}}{\text{)}} $ empirical relationships based on the conditional independence property model of equation (6)深度/m ${c}_{0}$ ${c}_{1}$ 相关系数r 标准差σRES 深度/m ${c}_{0}$ ${c}_{1}$ 相关系数r 标准差σRES 6 1.161 0.648 0.698 0.152 13 0.591 0.915 0.923 0.110 7 1.012 0.712 0.725 0.147 14 0.717 0.878 0.925 0.107 8 0.826 0.791 0.778 0.140 15 0.690 0.903 0.936 0.099 9 0.679 0.855 0.850 0.132 16 0.792 0.882 0.939 0.099 10 0.712 0.847 0.852 0.128 17 0.777 0.913 0.952 0.089 11 0.807 0.815 0.875 0.126 18 0.768 0.951 0.962 0.081 12 0.739 0.849 0.884 0.123 19 0.838 0.978 0.984 0.061 -
陈国兴,丁杰发,方怡,彭艳菊,李小军. 2020. 场地类别分类方案研究[J]. 岩土力学,41(11):3509–3522. Chen G X,Ding J F,Fang Y,Peng Y J,Li X J. 2020. Investigation of seismic site classification scheme[J]. Rock and Soil Mechanics,41(11):3509–3522 (in Chinese).
李小军. 2013. 地震动参数区划图场地条件影响调整[J]. 岩土工程学报,35(增刊):21–29. Li X J. 2013. Adjustment of seismic ground motion parameters considering site effects in seismic zonation map[J]. Chinese Jour nal of Geotechnical Engineering,35(S2):21–29 (in Chinese).
汪闻韶. 1994. 土工地震减灾工程中的一个重要参量:剪切波速[J]. 水利学报,(3):80–84. doi: 10.3321/j.issn:0559-9350.1994.03.012 Wang W S. 1994. An important parameter in geotechnical engineering for earthquake disaster mitigation:Shear wave velocity[J]. Journal of Hydraulic Engineering,(3):80–84 (in Chinese).
姚冬生,方飞龙,李朝阳. 1990. 四川省区域地质概况及特征[J]. 中国区域地质,(1):8–13. Yao D S,Fang F L,Li C Y. 1990. A general account of the regional geology of Sichuan Province[J]. Regional Geology of China,(1):8–13 (in Chinese).
中华人民共和国住房和城乡建设部, 中华人民共和国国家质量监督检验检疫总局. 2016. GB50011—2010 建筑抗震设计规范[S]. 北京: 中国建筑工业出版社: 18–20. Ministry of Housing and Urban-rural Development of the People’s Republic of China, General Administration of Quality Supervision, Inspection and Quarantine of the People’s Republic of China. 2016. GB50011−2010 Code for Seismic Design of Buildings[S]. Beijing: China Architecture & Building Press: 18–20 (in Chinese).
Boore D M. 2004. Estimating
${\bar {\Large v}}_{\rm{S30}} $ (or NEHRP site classes) from shallow velocity models (depths<30 m)[J]. Bull Seismol Soc Am,94(2):591–597. doi: 10.1785/0120030105Boore D M,Thompson E M,Cadet H. 2011. Regional correlations of
${\bar {\Large v}}_{\rm{S30}} $ and velocities averaged over depths less than and greater than 30 meters[J]. Bull Seismol Soc Am,101(6):3046–3059. doi: 10.1785/0120110071Bozorgnia Y,Abrahamson N A,Atik L A,Ancheta T D,Atkinson G M,Baker J W,Baltay A S,Boore D M,Campbell K W,Chiou B S J,Darragh R B,Day S,Donahue J,Graves R W,Gregor N,Hands T C,Idriss I M,Kamai R,Rowshandel B,Seyhan E,Shahi S,Shantz T,Silva W,Spudich P A,Stewart J P,Watson-Lamprey J,Wooddell K,Youngs R. 2014. NGA-West2 research project[J]. Earthq Spectra,30(3):973–987. doi: 10.1193/072113EQS209M
Building Seismic Safety Council. 2015. NEHRP Recommended Seismic Provisions for New Buildings and Other Structures[S]. Washington D.C.: Federal Emergency Management Agency: 86−87.
Dai Z J,Li X J,Hou C L. 2013. A shear-wave velocity model for vS30 estimation based on a conditional independence property[J]. Bull Seismol Soc Am,103(6):3354–3361. doi: 10.1785/0120130025
Kuo C H,Cheng D S,Hsieh H H,Chang T M,Chiang H J,Lin C M,Wen K L. 2009. Comparison of three different methods in investigating shallow shear-wave velocity structures in Ilan,Taiwan[J]. Soil Dyn Earthq Eng,29(1):133–143. doi: 10.1016/j.soildyn.2008.01.010
Kuo C H,Wen K L,Hsieh H H,Chang T M,Lin C M,Chen C T. 2011. Evaluating empirical regression equations for vS and estimating vS30 in northeastern Taiwan[J]. Soil Dyn Earthq Eng,31(3):431–439. doi: 10.1016/j.soildyn.2010.09.012
Stewart J P,Klimis N,Savvaidis A,Theodoulidis N,Zargli E,Athanasopoulos G,Pelekis P,Mylonakis G,Margaris B. 2014. Compilation of a local vS profile database and its application for inference of vS30 from geologic- and terrain-based proxies[J]. Bull Seismol Soc Am,104(6):2827–2841. doi: 10.1785/0120130331
Wills C J,Clahan K B. 2006. Developing a map of geologically defined site-condition categories for California[J]. Bull Seismol Soc Am,96(4A):1483–1501. doi: 10.1785/0120050179
Xie J J,Zimmaro P,Li X J,Wen Z P,Song Y S. 2016. vS30 empirical prediction relationships based on a new soil-profile database for the Beijing plain area,China[J]. Bull Seismol Soc Am,106(6):2843–2854. doi: 10.1785/0120160053
Yong A L. 2016. Comparison of measured and proxy-based vS30 values in California[J]. Earthq Spectra,32(1):171–192. doi: 10.1193/013114EQS025M
-
期刊类型引用(5)
1. 赵宇,任叶飞,张鹏,刘也,王宏伟,温瑞智. 基于数值计算的川滇地区场地非线性反应经验模型研究. 世界地震工程. 2025(01): 121-132 .  百度学术
百度学术
2. 桂飞,王延伟,鲍余. 地质年代差异对V_(S30)预测的影响研究. 河南城建学院学报. 2025(01): 15-21 .  百度学术
百度学术
3. 李志恒,谢俊举,李柯苇,温增平,李小军,王志才,许洪泰,赵晓芬,张娜. 山东地区场地剪切波速经验外推模型及其适用性. 地震地质. 2024(04): 934-954 .  百度学术
百度学术
4. 李航,罗桂纯,荣棉水,王继鑫,刘奥懿,孔小山. 基于钻孔数据的北京地区覆盖层厚度与场地自振频率的经验关系. 地震学报. 2024(06): 1063-1075 .  本站查看
本站查看
5. 孙洪新,左鹏. 地震剪切波速度测试在岩土工程勘察中的应用. 工程机械与维修. 2023(02): 105-107 .  百度学术
百度学术
其他类型引用(2)


 下载:
下载:
