

Focal mechanisms and seismic anisotropy analysis of local earthquakes at the Cove Fort-Sulphurdale geothermal site, United States.
-
摘要: Cove Fort-Sulphurdale位于美国犹他州中西部, 是一个地质特征独特的地热资源富集区. 为了有效开发地热资源, 有必要了解该地区的应力分布和裂缝分布. 本文在前人工作的基础上使用地震资料, 利用波形匹配、 P波极性和横纵波振幅比联合约束反演的方法, 研究该地区地震的震源机制解; 同时结合该地区的横波分裂分析研究, 确定该地区的应力分布和断层/裂隙走向. 波形反演结果显示, 实际数据与模拟数据的波形匹配度非常高, 且二者的P波初动极性和横纵波振幅比也都非常相近. 由震源机制分析得出的断层面走向大部分趋于南北向, 与美国区域应力图显示的最大水平主应力指向(南北方向), 具有较好的一致性, 符合目前研究对该地区的构造认知. 横波分裂分析结果也表明如果各向异性主要是由该地区的断裂构造所引起, 那么该地区的主要断层或裂缝的方向可能为南北向.
-
关键词:
- Cove Fort-Sulphurdale /
- 震源机制 /
- 波形匹配 /
- 区域地震 /
- 横纵波振幅比 /
- 地热横波分裂 /
- 各向异性 /
- anisotropy
Abstract: Cove Fort-Sulphurdale is located in central-western Utah, which is characterized by its unique geologic features and rich geothermal resources. For better development of geothermal reservoirs, it is necessary to have the know-ledge of stress and fracture distribution of the region. Based on the previous work, we use the waveform matching method to invert the focal mechanisms of local earthquakes collected in Cove Fort-Sulphurdale, constrained by first arrival P wave polarities and S/P amplitude ratios. Furthermore, we also use the shear wave splitting analysis method to study the anisotropy in this region. Combining both focal mechanism and anisotropy results, we can determine the stress distribution and fault/fracture directions. The results show that the waveforms of synthetic data match real data very well, and the first arrival P wave polarities and S/P amplitude ratios are close. Fault plane solutions have strikes trending in approximately N-S direction, which is consistent with the maximum horizontal principle stress indicated by the stress map of America and our current understanding of the tectonics in this region. Shear wave-splitting analysis results also show that if the anisotropy is mainly caused by the fault structure in this region, the strikes of the main faults/fractures should be in the N--S direction. -
-
![]()
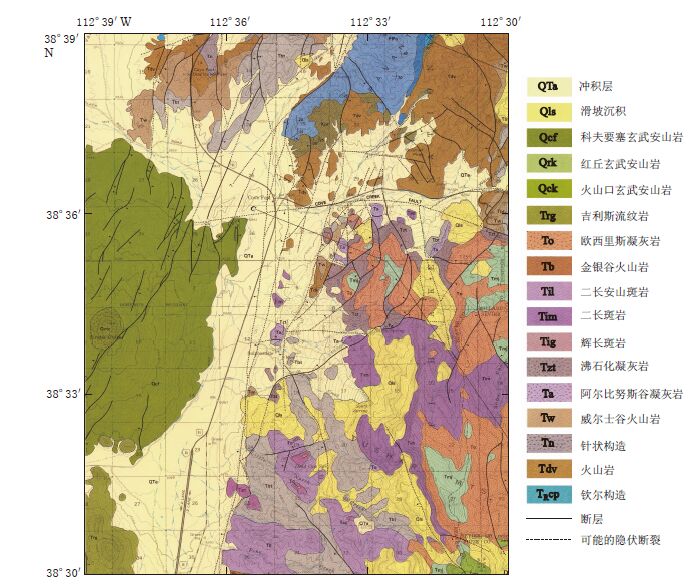
图 1 Cove Fort-Sulphurdale地热区域的地质图(引自Steven,Morris,1983)
Solid lines represent faults,dashed lines represent concealed faults that may exist, and rocks of different geological times are indicated in different colors
Figure 1. Regional geological map for the Cove Fort-Sulphurdale geothermal area(after Steven,Morris,1983)
![]()
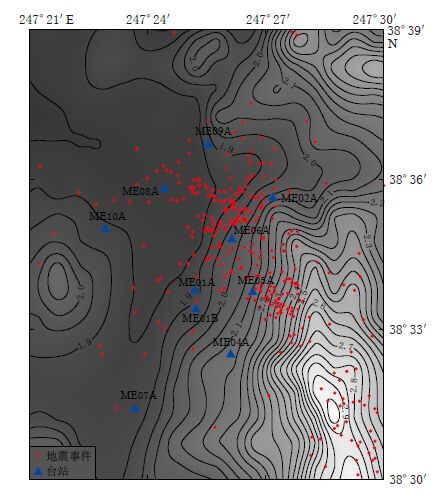
图 2 Cove Fort-Sulphurdale地区的地震事件和台站分布 灰度代表地形高程(单位: km),白色表示海拔高
Figure 2. Seismic events and stations distribution map in Cove Fort-Sulphurdale Red dots denote seismic events and blue triangles indicate stations,grayscale represents the terrain elevation(in km)(white indicates high altitude)
![]()
图 3 震源机制反演得到的前9个最大目标函数的解,No.1和No.9 分别表示这9个解中最好和最差的解
Figure 3. Solutions with the first nine largest objectivefunction values from focal mechanism inversion,where No.1 means the best solution and No.9 means the worst one among these nine solution
![]()
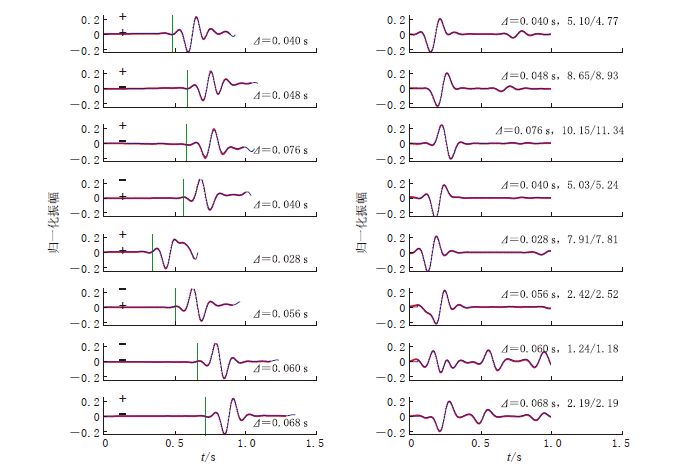
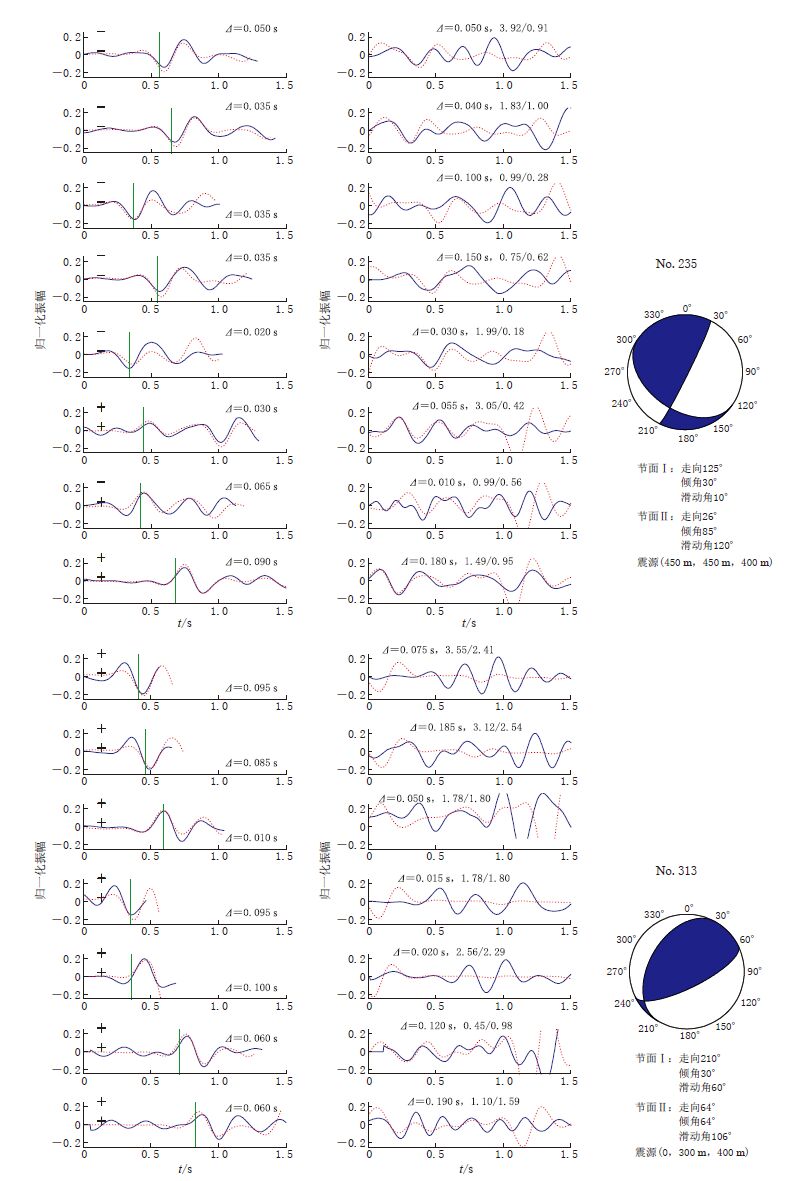
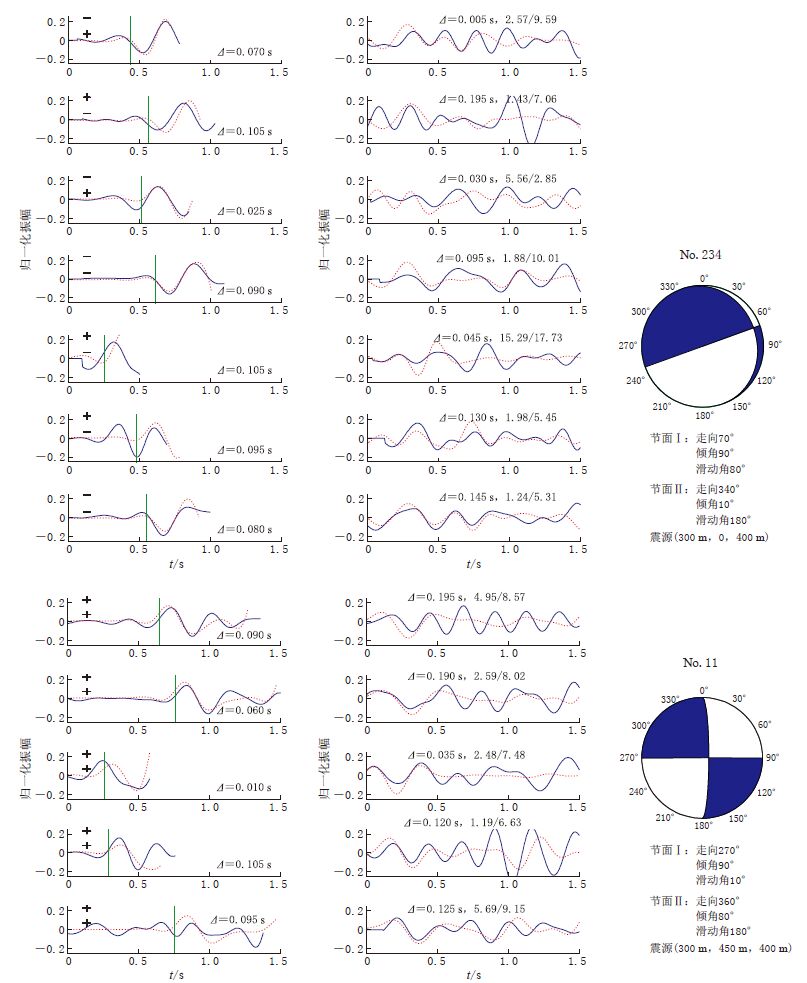
图 4 8个台站的模拟数据(红色点线)与合成数据(蓝色实线)的波形匹配图 左图为P波匹配结果,图中绿色竖线表示P波理论初至时间,零时刻代表记录开始时刻,上、下两个“+”或“-”分别表示合成数据和模拟数据的P波初动极性;右图为S波匹配结果,零时刻表示计算得到的S波开始时刻,最右侧数值表示横纵波振幅比信息,斜杠左边为合成数据的横纵波振幅比值,斜杠右边为相应的模拟数据的横纵波振幅比值.Δ 表示时移
Figure 4. Wave form matching between modelled (reddottedlines) and synthetic(bluesolidlines)waveforms at eight stations The left column shows P waves and right column shows S waves.The green lines indicate the calculated first P arrival times.For P waves,zero time means the origin time,“+"or“-"signs indicate the first arrival polarities of P waves inthedata(upper)and those in the synthetics(lower).For the S waves,zero time means the S-wave arrival time predicted by the calculated travel time,the number to the left of the slash denotes the S/P ratio for the data,the number to the right of the slash denotes the ratio for the modelled waveform.Δ indicates the time shift
![]()
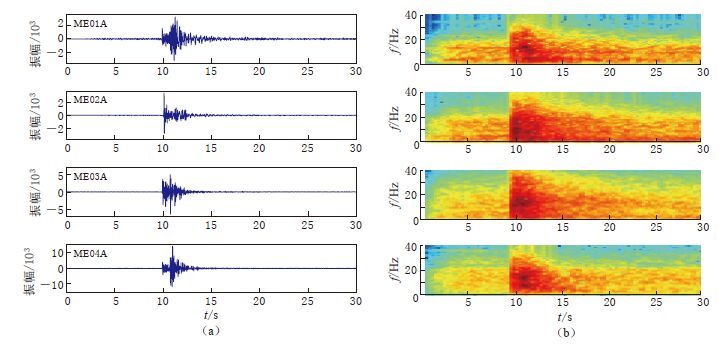
图 5 一个典型事件的垂向记录(a)及其频谱(b)
Figure 5. A typical event used in the focal mechanism determination(a) and its spectrograms(b)
![]()
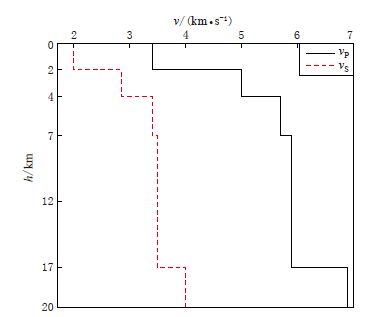
图 6 Cove Fort-Sulphurdale地区的一维层状P波和S波速度结构
Figure 6. 1D layered velocity structure of P and S waves for Cove Fort-Sulphurdale
![]()
![]()
![]()
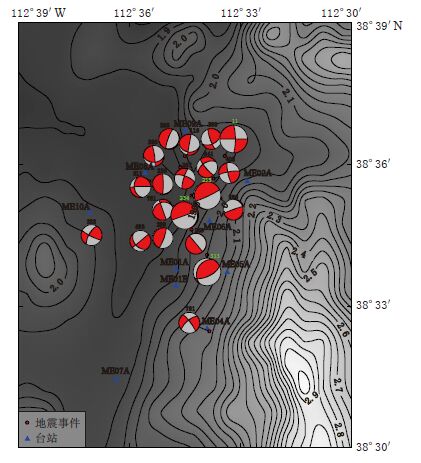
图 9 20个地震事件的震源机制解
Figure 9. Distribution of focal mechanisms of 20 seismic events(red dots)determined by the waveform matching method
![]()
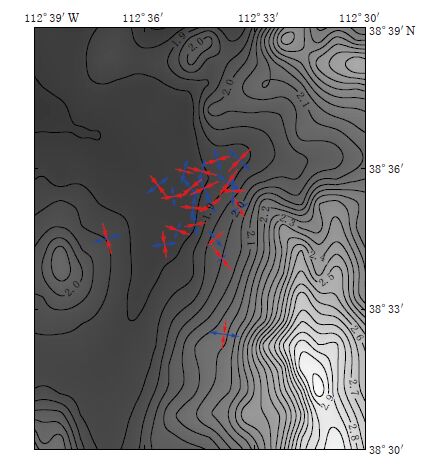
图 10 Cove Fort-Sulphurdale地区20个地震事件的P轴(红色)和T轴(蓝色)分布 轴线长短表示倾角大小,线段越短表示倾角越大
Figure 10. Distribution of P(red) and T(blue)axes determined from focal mechanisms of 20 seismic events in the Cove Fort-Sulphurdale area The length of axis indicates inclination with the shorter line representing greater inclination angle
![]()
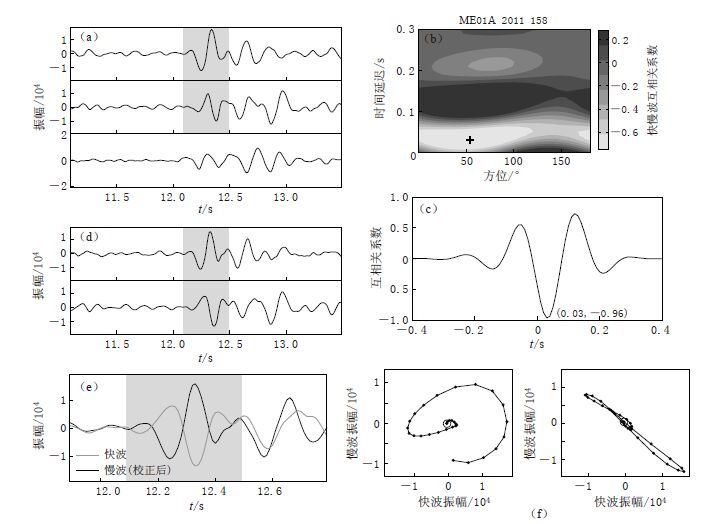
图 12 CDP方法横波分裂分析流程图 (a)ME01A台站的部分原始三分量记录,阴影部分表示用于横波分裂分析的窗口长度;(b)互相关函数值关于快波极化方向和慢波时间延迟的分布图. “+”表示最大互相关函数值,其对应的快波极化方向和慢波时间延迟分别为54°和0.03 s;(c)极化方向确定后,互相关函数值随慢波时间延迟的分布图;(d)旋转到快、 慢波极化方向后的水平分量波形图;(e)经时间延迟校正后的快慢波波形图;(f)慢波时间延迟校正前(左)、 后(右)的质点运动轨迹图
Figure 12. Shear wave splitting analysis flow chart using CDP method (a)Original three-component seismograms recorded on the station ME01A with the shadow part indicating the length of time window used in the shear wave-splitting analysis.(b)A contour plot of the cross-correlation coefficient values.The maximum cross-correlation coefficient value is indicated by the cross at the fast polarization direction(PD)54° and time delay(TD)0.03 s.(c)A plot of the cross-correlation coefficient values at the measured PD.(d)Seismograms rotated to the estimated fast and slow PDs.(e)Waveforms of the fast and slow components shifted with the measured TD.(f)The horizontal particle motion of the original seismogram(left panel) and that of the fast and slow components shifted with the measured TD(right panel)
![]()
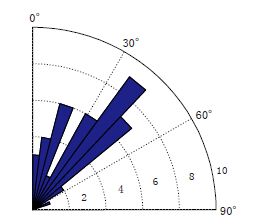
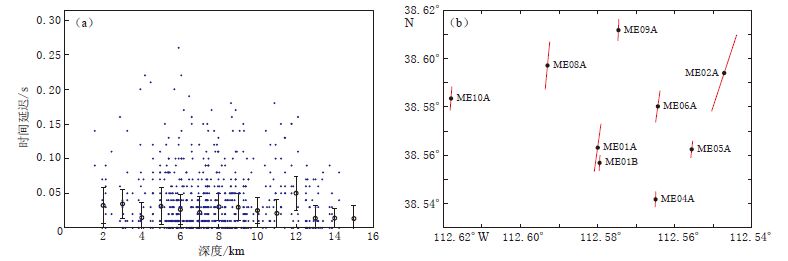
图 13 横波分裂分析的所有地震事件的平均时间延迟(a)和各台站快波极化方向(b)
Figure 13. The average time delay between fast and slow shear waves(a) and the average fast shear wave polarization direction(b)at each station from all of the analyzed events
表 1 20个地震事件的震源参数
Table 1 Source parameters of 20 seismic events determined by the waveform matching method
事件序号 节面Ⅰ 节面Ⅱ P轴 T轴 走向/° 倾角/° 滑动角/° 走向/° 倾角/° 滑动角/° 方位/° 倾角/° 方位/° 倾角/° 11 270 90 -10 360 80 -180 -135.4 7.1 -44.6 7.1 116 10 90 120 100 30 10 73.4 37.8 -53.4 37.8 230 0 85 99 120 10 30 81.8 39.4 -80.2 49.2 234 160 90 80 340 10 180 -100.1 44.1 60.1 44.1 235 155 85 99 185 10 30 -123.2 39.4 74.8 49.2 259 140 90 -90 320 0 90 50.0 45.0 -130.0 45.0 267 290 70 10 197 81 160 -115.4 7.3 151.8 20.9 280 250 87 99 360 10 20 -28.5 41.3 169.4 47.3 285 200 80 -95 50 10 -60 103.9 54.7 -65.7 34.8 286 352 84 130 90 40 10 51.1 27.7 -62.9 37.8 299 20 80 90 200 10 90 110.0 35.0 -70.0 55.0 311 268 84 -130 170 40 -10 142.6 38.4 28.2 27.6 313 210 30 60 64 64 106 141.8 17.8 3.4 66.7 333 210 70 10 117 81 160 164.6 7.3 71.8 20.9 360 160 80 40 62 51 167 -75.1 19.0 28.7 34.8 402 260 80 10 168 80 170 -145.9 0.1 124.1 14.1 693 230 90 50 140 40 180 -7.3 32.8 107.3 32.8 761 340 90 60 250 30 180 96.6 37.8 -136.6 37.8 781 230 70 -10 323 81 -160 -171.8 20.9 95.4 7.3 841 140 80 -40 238 51 -167 91.3 34.8 -164.9 19.0  下载: 导出CSV
-
张欣, 张海江, Toksöz M N. 2012. 美国Utah州Cove Fort-Sulphurdale地区三维衰减层析成像研究[C]//中国地球物理学会第二十八届年会会议文集. 北京: 中国地球物理学会: 242. Zhang X,Zhang Haijiang, Toksöz M N. 2012. Three-dimensional seismic attenuation structure of the Cove Fort-Sulphurdale, Utah[C]//Proceeding of Chinese Geophysical Annual Meeting 2012. Beijing: Chinese Geophysical Society: 242 (in Chinese).
Moore J N, Samberg S M. 1979. Geology of the Cove Fort-Sulphurdale KGRA[R]. Utah: Univ Utah Res Inst, Earth Sci Lab, ESL-18: 44.
Nolet G, Dahlen F A, Montelli R. 2005. Traveltimes and amplitudes of seismic waves: A Reassessment[G]//Seismic Earth: Analysis of Broadband Seismograms. AGU Monograph Series, 157: 37-48.
Ross H P, Moore J N, Christensen O D. 1982. The Cove Fort-Sulphurdale KGRA: A Geologic and Geophysical Case Study[R]. Utah: Univ Utah Res Inst, Earth Sci Lab, ESL-90: 47.
Rutledge J T, Phillips W S. 2002. A comparison of microseismicity induced by gel-proppant-and water-injected hydraulic fractures, Carthage Cotton Valley gas field, East Texas[C]//72nd Annual International Meeting, SEG, Expanded Abstracts. Salt Lake: SEG: 2393-2396.
Steven T A, Morris H T. 1983. Geologic map of the Cove Fort quadrangle, west-central, Utah[EB/OL]. [2014-08-09]. http://ngmdb.usgs.gov/Prodesc/proddesc_9256.htm.

计量
- 文章访问数: 666
- HTML全文浏览量: 319
- PDF下载量: 13
