

Detection and analysis of repeating earthquakes in Guanxian- Anxian fault by using waveform cross-correlation
-
摘要: 以中国地震台网中心地震目录中的事件为模板地震,通过滑动窗口的波形互相关方法对布设在灌县—安县断裂周边17个流动地震台的连续地震记录进行处理,识别ML0.0以上的重复地震. 然后使用结合波形互相关技术的双差算法对这些地震进行重定位,获得了243次地震的重定位结果. 结果表明: 在研究时段内,灌县—安县断裂的地震活动性呈减弱趋势; 地震震源的优势分布深度为5—15 km,震源深度剖面显示地震呈高角度向西倾斜分布; 地震震中沿NE向分布,与龙门山前山断裂的走向基本一致; 研究区内南、 北两段的地震活动性及b值存在差异,这可能与龙门山断裂带中段区域应力方向由南到北发生的WNW向到ENE向转换的构造作用密切相关.Abstract: By taking earthquakes from China Earthquake Networks Center catalog as template events,we detected repeating earthquakes down to ML0.0 from continuous waveforms recorded by 17 portable seismic stations deployed near the Guanxian-Anxian fault through a sliding-window cross-correlation technique. Then,based on double-difference algorithm combined with waveform cross-correlation,243 of the detected earthquakes were relocated. The results indicate that seismicity of Guanxian-Anxian fault became weaker during the studied period. The predominance distribution of focal depth is 5—15 km and the depth profile reveals that focal depth distributes in westward dipping with a high angle. The epicenters of these earthquakes are distributed in NE direction,which coincides with the strike of front-range fault of Longmenshan fault zone. There are differences in seismicity and b value between the northern and southern segments in the studied region,which may be related to regional stress field of the middle segment of Longmenshan fault zone where directions of stress transfer from WNW to ENE from south to north.
-
-
![]()
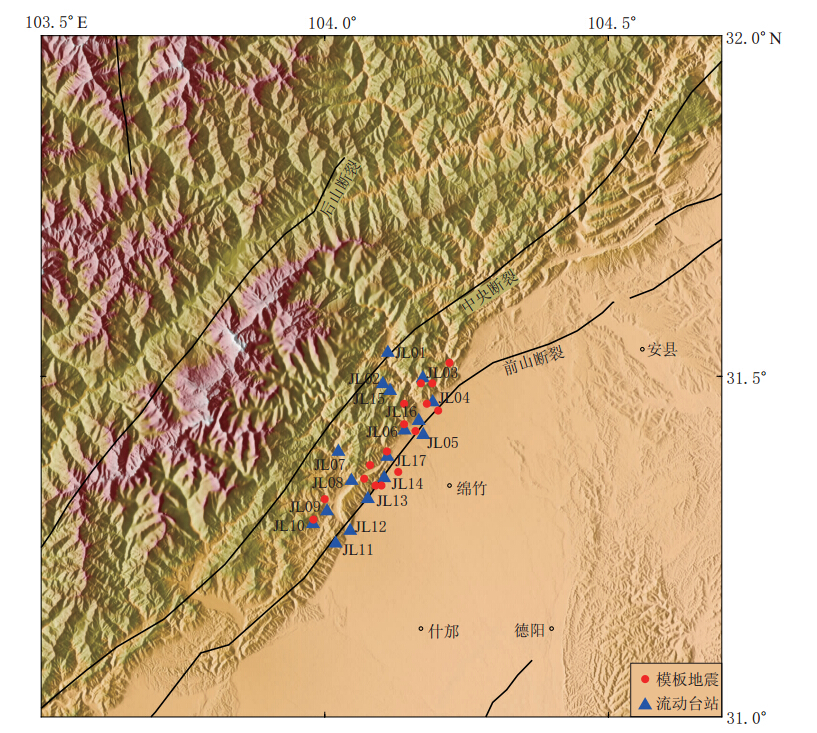
图 1 研究区域构造及台站分布
Figure 1. Regional tectonics setting and distribution of seismic stations (triangles), where the red circles represent template events used in this study
![]()
图 2 JL17台三分量地震记录及计算得到的相关系数序列C(t)图中序号为识别出的9个地震事件
Figure 2. Three-component waveforms recorded by the station JL17 and the calculated cross-correlation coefficient C(t). Numbers on the trace correspond to nine detected events
![]()
图 3 由模板地震(0号)识别出的9个重复地震事件的三分量波形. 图中波形上方的数字为地震事件序号
Figure 3. Three-component records of nine detected events using the event No.0 as template event. The numbers on the top of waveforms are the No.of nine events
![]()
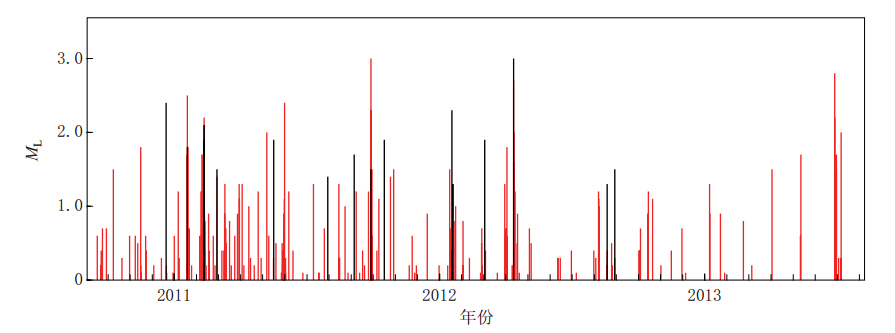
图 4 地震序列的M -t图 红线对应识别出的重复地震事件,黑线对应模板地震事件
Figure 4. M -t map of the earthquake sequence The red lines mark the detected events and the black lines represent template events
![]()
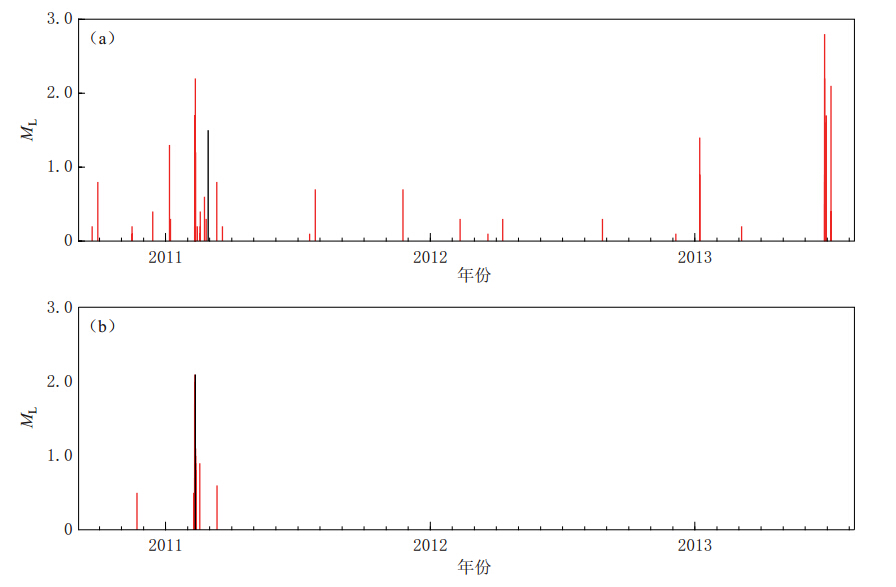
图 5 以20110228153300事件(a)和20110210235101事件(b)为模板地震所识别出重复地震的M -t图,其中黑线对应模板地震事件
Figure 5. M -t map of the detected earthquake sequence using the event 20110228153300 (a) and the event 20110210235101 (b) as template event. The black lines represent template events
![]()
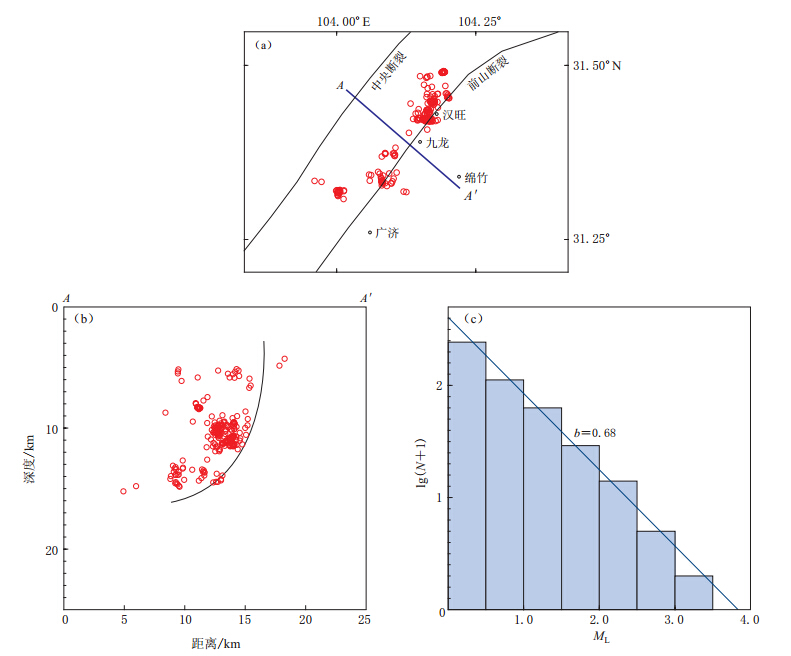
图 6 (a) 震中分布图; (b) 沿AA′剖面的地震深度分布图,黑色实线为推测的断层分布; (c) 研究区地震的震级分布,N为地震次数
Figure 6. (a) Epicenters distribution; (b) Focal depth profile along the section AA′. The black line represents the fault plane inferred from the locations; (c) Magnitude-frequency distribution in the studied region,where N is the number of earthquakes
![]()
图 7 研究区域内灌县—安县断裂南、北段地震频次与震级的关系
Figure 7. Magnitude-frequency distribution of the northern (right) and southern (left) segments of Guanxian-Anxian fault in the studied region
表 1 连续记录中识别出的9个地震事件的参数
Table 1 The parameters of nine events detected in continuous records

 下载: 导出CSV
表 2 一维P波参考速度模型(引自赵珠等,1997)
Table 2 1-D P-wave velocity reference model (after Zhao et al,1997)
 下载: 导出CSV
-
李乐. 2008. 板内重复地震的识别及其在活动断裂带的应用研究[D]. 北京: 中国地震局地球物理研究所: 1-115. Li L. 2008. Identification of Intraplate Repeating Microearthquakes and Its Application to the Active Fault Zone[D]. Beijing: Institute of Geophysics, China Earthquake Administration: 1-115 (in Chinese).
赵翠萍. 2006. 1997—2003年新疆伽师震源区特征的地震学方法研究[D]. 北京: 中国地震局地球物理研究所: 1-159. Zhao C P. 2006. Seismological Studies on the Characteristics of Jiashi Source Region from 1997 to 2003[D]. Beijing: Institute of Geophysics, China Earthquake Administration: 1-159 (in Chinese).
Cheng X, Niu F, Silver P G, Horiuchi S, Takai K, Iio Y, Ito H. 2007. Similar microearthquakes observed in western Nagano, Japan, and implications for rupture mechanics[J]. [JP3]J Geophys Res,112: B04306.
-
期刊类型引用(1)
1. 李红, 邓志辉, 邢成起, 严兴, 马晓静, 姜辉. 人工地震目录研究进展. 地球物理学进展. 2015(05): 1995-2006 .  百度学术
百度学术
其他类型引用(3)


计量
- 文章访问数: 607
- HTML全文浏览量: 283
- PDF下载量: 22
- 被引次数: 4
