

Effect on the predictability of pattern informatics method related to selection of studied regions
-
摘要:
图像信息(PI)法是一种基于统计物理学的地震预测方法,因其对中长期地震预测有较好的效果已在国内外广泛应用。PI方法在计算过程中对选取区域的所有网格参量进行了归一化,因此不同的区域选取会产生PI热点结果的变化。本文基于中国地震台网中心自1970年以来的全国MS≥3.0地震目录,采用5年尺度的“异常学习时段”和“预测时间窗”以及1年尺度的滑动时间步长,以南北地震带2016年以来发生的MS≥6.0地震的回溯性预测检验为例,研究了不同空间范围的选取对PI方法地震预测效能的影响。地震预测效能检验采用R值评分法和受试者工作特征(ROC)检验方法。结果显示:① 在其它计算参数相同的情况下,不同的区域选取对PI预测结果有较大影响;② 利用R值评分和ROC检验方法对不同研究区的预测效能进行评估时,区域内部地震活动性差异小的区域预测效果较好,而对于地震活动性存在较大差异的区域,地震活动性高的区域内发生的地震更容易被预测,推测导致这一结果的可能原因是地震活动性较强的区域出现的异常更显著,而算法里的归一化过程会抑制地震活动性较低区域出现的异常,从而造成漏报;③ 对于具体的目标地震,震中附近的PI热点图像会经历演化,因此利用PI方法向前预测时要结合多个时间窗口进行综合预测;④ 不同于其它天然构造地震的热点演化趋势,2019年四川长宁MS6.0地震和2021年四川泸县MS6.0地震震中附近热点反复出现、消失,可能与人工活动有关;⑤ 滇西南地区、海原断裂中东部附近、小江断裂中部地区、龙门山断裂南部和小江断裂东北部地区存在持续出现的PI热点,这些区域为值得关注的MS≥6.0地震发震区域。
Abstract:The Pattern Informatics (PI) method is a approach for earthquake forecasting based on statistical physics, and has been widely applied both at home and abroad due to its good performance in medium to long term earthquake forecasting. The algorithm of PI method includes the process of normalization of all grid parameters in the selected region, so the distribution of PI hotspots might be different with the different selected studied regions theoretically. However, the predictability of PI due to the selection of studied regions has not been systematically studied so far. We performed the retrospective forecasting for seven earthquakes above MS6.0 in the North-South Seismic Zone since 2016 under different size regions. The earthquake catalogue since 1970 is taken from the China Earthquake Networks Center. Both the anomaly learning period and forecast interval are fixed as five years and the moving step is taken as one year in this study. The forecasting efficiency of PI is tested by R score and ROC (receiver operating characteristic) test. The results showed that different region selection might lead to different forecasting results with the same calculation parameters. The R score and ROC tests results for the selected regions with lower seismicity-difference are better than those with higher seismicity-difference. In the selected regions with higher seismicity-difference, target earthquakes in the areas with higher seismicity tend to be predicted more easily than those in the areas with lower seismicity, which is supposed to be caused by the fact that PI hotspots are more obvious in the areas with higher seismicity and they will suppress the anomalous signal detected by PI algorithm in the areas with lower seismicity, resulting in the missing prediction for the target earthquakes in the areas with lower seismicity. For a specific target earthquake, the imagine of PI hotspot around the epicenter will evolve, so the combination of multiple forecasting windows should be considered when the forward events are predicted using PI method. Different from the hotspots evolution trend of other natural tectonic earthquakes, the hotspots of 2019 MS6.0 Changning and 2021 MS6.0 Luxian earthquakes in Sichuan appeared and disappeared repeatedly near their epicenters, which may be related to human activities. There are continuous PI hotspots at the boundary of southwestern Yunnan, middle and eastern section of Haiyuan fault, the middle Xiaojiang fault, the southern Longmenshan fault and the northeastern Xiaojiang fault, suggesting that there will be seismic potentials with MS6.0 or above in these regions.
-
引言
我国是一个多震国家,尤其是近年来我国进入了地震高发期(胡敏章等,2019)。地震在带来直接灾害的同时,还会激发大量的次生地质灾害。特别是在山地区域,由地震激发的山体滑坡、泥石流等地质灾害将造成重大的生命财产损失,例如2008年汶川MS8.0地震就激发了海量的地震滑坡,造成重大人员伤亡和严重的房屋建筑损毁(Yuan et al,2010,2013)。在所有这些地震滑坡中,土质滑坡占据了不小的比例。因此,研究土坡地震响应规律对科学防震减灾具有重要的理论和实用价值,而开展对土坡地震响应研究工作的核心之一便是地震动参数的选取问题。
王秀英等(2010)研究了地震动参数与汶川地震诱发山体滑坡之间的关系,认为峰值加速度(peak ground acceleration,缩写为PGA)与诱发崩滑之间存在明显的正相关性;张郁山和赵凤新(2011)在地震动峰值位移(peak ground displacement,缩写为PGD)对单自由度体系非线性动力反应的影响研究中得出了地震动峰值位移对体系弹塑性速度及位移的影响;李小军(2013)进一步分析了新一代中国地震动参数区划图中考虑场地条件的地震动参数调整结果和变化特征;杜修力等(2015,2018)对地震动峰值位移对高拱坝和地下结构地震反应的响应影响作出了相应的研究,探寻了高拱坝和地下结构的地震响应与地震动峰值位移的变化关系;而陈冲等(2017)研究了地震动峰值加速度作用下含水边坡稳定性关系,认为在含水情况下,随输入峰值加速度的增大,滑动面向坡内大幅移动,由浅层破坏转变为深层破坏;张江伟等(2018)对地震动参数对土坡地震响应的影响权重进行了研究,得出地震动各参数对坡体变形位移的影响相关性。纵观目前地震动参数对边坡响应的影响规律的研究,可以看出,针对地震动峰值特征参数影响土坡地震响应的对比性研究较少。本文拟针对地震动峰值加速度(PGA)、峰值速度(PGV)和峰值位移(PGD)三个地震动峰值特征参数来研究其对土坡响应的影响规律。为此,随机选取100条含有不同PGA,PGV和PGD的实际地震动纪录,研究三个峰值特征参数对边坡动力响应的影响规律和相关性,以期为土坡地震响应研究中地震动参数选取问题提供参考依据。
1. 地震动选取
随机选取100条来自太平洋地震研究中心数据库中不同地震的原始记录,通过对每条地震动进行基线校正、积分来获取其PGA,PGV以及PGD。经统计,100条地震动的PGA的范围为0.004 1—1.225 9 g,PGV的范围为0.378—112.376 cm/s,PGD的变化范围为0.035 3—35.674 5 cm。对三种地震动峰值参数对边坡的地震响应的表现情况进行对比研究。图1-3给出了前三条地震动M1—M3的加速度、速度、位移时程曲线。
![]() 图 1 地震动M1的加速度 (a)、速度 (b)、位移 (c) 时程曲线Figure 1. Acceleration (a),velocity (b),displacement (c) time history curves of ground motion M1
图 1 地震动M1的加速度 (a)、速度 (b)、位移 (c) 时程曲线Figure 1. Acceleration (a),velocity (b),displacement (c) time history curves of ground motion M1![]() 图 2 地震动M2的加速度 (a)、速度 (b)、位移 (c) 时程曲线Figure 2. Acceleration (a),velocity (b),displacement (c) time history curves of ground motion M2
图 2 地震动M2的加速度 (a)、速度 (b)、位移 (c) 时程曲线Figure 2. Acceleration (a),velocity (b),displacement (c) time history curves of ground motion M2![]() 图 3 地震动M3的加速度 (a)、速度 (b)、位移 (c) 时程曲线Figure 3. Acceleration (a),velocity (b),displacement (c) time history curves of ground motion M3
图 3 地震动M3的加速度 (a)、速度 (b)、位移 (c) 时程曲线Figure 3. Acceleration (a),velocity (b),displacement (c) time history curves of ground motion M32. 研究方法及模型建立
2.1 研究方法
在模拟、计算土坡的动力响应时,采用动力平衡方程,即
$${\boldsymbol{M}}\ddot {\boldsymbol{u}} {\text{+}} {\boldsymbol{C}}\dot {\boldsymbol{u}} {\text{+}} {\boldsymbol{Ku}} {\text{=}} {\boldsymbol{F}}{\text{(}}t{\text{)}}{\text{,}}$$ (1) 式中,M为结构的质量矩阵,C为结构的阻尼矩阵,K为结构的刚度矩阵,
${\ddot{\boldsymbol u}}$ 为结构的加速度列阵,${\dot{\boldsymbol u}}$ 为结构的速度列阵,u为结构的位移列阵,F(t)为结构的节点荷载列阵。对于求解地震作用下的动力问题,动力荷载就是地震荷载,于是求解边坡地震动力稳定性问题的基本力学运动方程可写为
$$ {\boldsymbol{M}}\ddot {\boldsymbol{u}} {\text{+}} {\boldsymbol{C}}\dot {\boldsymbol{u}} {\text{+}} {\boldsymbol{Ku}} {\text{=}} - {\boldsymbol{M}}{\ddot {\boldsymbol{u}}_g}{\text{(}}t{\text{)}}{\text{.}} $$ (2) 地震是一种随时间变化的复杂荷载,边坡岩土体在地震作用下往往会进入弹塑性状态,这时便无法得到解析解,解析方法也不再适用,但通过数值计算可以得到结构动力反应的数值解。在有限元模拟软件ABAQUS中分为隐式和显式两种算法,其中隐式算法是以Newmark-β法为基础,而显式模块则采用中心差分法来解决动力学问题,这些方法的中心思想是假定结构在每一个微小时间步内呈现线弹性反应,然后通过在时域内逐步积分求解。本文采用隐式算法。
2.2 模型建立
建立如图4所示的土质边坡模型,长为170 m,宽为70 m,边坡坡角为37°,模型坡高30 m,坡顶后缘长80 m。从坡顶至坡脚均匀设置P1,P2,P3,P4,P5 5个观测点(图4)用于记录边坡在地震动作用下各峰值特征参数的变化情况。假定模型材料为均质材料,表1为边坡土体的物理、力学参数。本构模型为理想的弹塑性本构模型,土坡地震模拟计算中采用摩尔-库仑强度准则,式(3),(4)为摩尔-库仑强度准则的相关公式。模型底部采用静态边界条件,侧面设置粘弹性边界,阻尼采用瑞雷阻尼形式(胡聿贤,2006)。
表 1 边坡土体参数Table 1. Parameters for soil slop参数 密度
/(kg·m−3)弹性模量
/MPa泊松比 黏聚力
/kPa内摩擦角
/°数值 2070 90.8 0.3 13.99 25 $$ \left\{ \begin{array}{l} {\tau _{{n}}} {\text{=}} \dfrac{1}{2}{\text{(}}{\sigma _1} {\text{-}} {\sigma _3}{\text{)}}\cos \phi{\text{,}} \\ {\sigma _n} {\text{=}} \dfrac{1}{2}{\text{(}}{\sigma _1} {\text{+}} {\sigma _3}{\text{)}} {\text{+}} \dfrac{1}{2}{\text{(}}{\sigma _1} {\text{-}} {\sigma _3}{\text{)}}\sin \phi {\text{,}} \end{array} \right. $$ (3) $$ f {\text{=}} \frac{1}{2}{\text{(}}{\sigma _1} {\text{-}} {\sigma _3}{\text{)}} {\text{+}} \frac{1}{2}{\text{(}}{\sigma _1} {\text{+}} {\sigma _3}{\text{)}}\sin \phi {\text{-}} C\cos \phi {\text{=}} 0{\text{,}} $$ (4) 式中,σn和τn分别为滑移面上的正应力和切应力,σ1为最大主应力,σ3为最小主应力,C为土的黏聚力,
$\phi$ 为内摩擦角,f为屈服函数。3. 结果分析
将所选取的地震动原始数据进行基线矫正处理后作为模拟实验的数据进行数值模拟分析。由于篇幅限制,本文仅列出土坡在地震动M1,M2,M3作用下的变形云图(图5)。
![]() 图 5 土坡在地震动M1 (a),M2 (b),M3 (c)作用下的变形云图Figure 5. Deformation nephograms of soil slope under ground motion of M1 (a),M2 (b),M3 (c)
图 5 土坡在地震动M1 (a),M2 (b),M3 (c)作用下的变形云图Figure 5. Deformation nephograms of soil slope under ground motion of M1 (a),M2 (b),M3 (c)收集并计算P1至P5各点地震响应结果,选取每条地震动所对应观测点的最终变形位移作为模拟实验的代表数据,结合每条地震动数据中所包含的特征参数信息绘制散点图,通过图像可以直观地显示出地震动各峰值特征参数对边坡地震响应的影响规律。
3.1 地震动峰值特征参数的影响规律
收集分析P1至P5 5个观测点在不同地震动作用下的最大位移数据,研究其与PGA,PGV,PGD三个地震动峰值参数的变化规律,图6—10所示为各参数与边坡5个观测点最大位移的变化规律。
![]() 图 6 P1点变形位移随PGA (a),PGV (b),PGD (c)的变化Figure 6. Variation of P1 displacement with PGA (a),PGV (b),PGD (c)
图 6 P1点变形位移随PGA (a),PGV (b),PGD (c)的变化Figure 6. Variation of P1 displacement with PGA (a),PGV (b),PGD (c)![]() 图 7 P2点变形位移随PGA (a),PGV (b),PGD (c)的变化Figure 7. Variation of P2 displacement with PGA (a),PGV (b),PGD (c)
图 7 P2点变形位移随PGA (a),PGV (b),PGD (c)的变化Figure 7. Variation of P2 displacement with PGA (a),PGV (b),PGD (c)![]() 图 8 P3点变形位移随PGA (a),PGV (b),PGD (c)的变化Figure 8. Variation of P3 displacement with PGA (a),PGV (b),PGD (c)
图 8 P3点变形位移随PGA (a),PGV (b),PGD (c)的变化Figure 8. Variation of P3 displacement with PGA (a),PGV (b),PGD (c)![]() 图 9 P4点变形位移随PGA (a),PGV (b),PGD (c)的变化Figure 9. Variation of P4 displacement with PGA (a),PGV (b),PGD (c)
图 9 P4点变形位移随PGA (a),PGV (b),PGD (c)的变化Figure 9. Variation of P4 displacement with PGA (a),PGV (b),PGD (c)![]() 图 10 P5点变形位移随PGA (a),PGV (b),PGD (c)的变化Figure 10. Variation of P5 displacement with PGA (a),PGV (b),PGD (c)
图 10 P5点变形位移随PGA (a),PGV (b),PGD (c)的变化Figure 10. Variation of P5 displacement with PGA (a),PGV (b),PGD (c)由图6—10可以看出,各峰值特征参数与土坡变形都有较好的相关性,随着PGA,PGV,PGD的增大,坡体变形位移响应也相应增大,各峰值特征参数对于边坡变形的图像都呈现正相关的趋势。分别比较PGA,PGV,PGD三个地震动峰值特征参数与土坡同一点的位移变化曲线可以得出:PGV与土坡变形的线性关系最为明显,说明其能更好地反映土坡在地震作用下的变形响应规律;PGA,PGD与土坡变形的线性关系稍弱,但仍具有较好的正相关性。通过对图像进行线性拟合,PGV与土坡变形的相关系数最高,对比PGA,PGD的线性关系,PGD的相关系数更高,其相关性稍优于PGA。
而对比同一个地震动峰值参数对于不同边坡观测点位移的图像可以看出,各峰值参数对不同观测点的变化规律图像都比较一致。
3.2 参数优化选择
不同的地震动强度指标反应出的边坡地震响应程度有所不同,在边坡稳定性评价中,如何选择合理的强度指标是能否突出反应边坡地震响应程度的关键。
上节内容就PGA,PGV和PGD三个地震动峰值特征参数对土坡地震响应的影响程度进行了分析。为了进一步进行参数优化选择,作者对比分析了各土坡地震响应与地震动峰值特征参数的相关性,表2显示了土坡地震位移响应与PGA,PGV,PGD的相关系数ρ。相关性系数ρ的计算方法如式(5)所示,将第n条地震动的某一地震动强度指标值记为In,采用有限元法计算边坡模型在第n条地震动输入下的边坡最大地震响应值Rn,重复上述步骤,得到所有地震动记录的Rn及其对应的In,将所有地震动的计算结果绘制在R-I坐标系中,并通过式(5)计算得到R与I之间的相关系数ρ,即
表 2 地震动峰值特征参数和边坡地震响应的相关系数Table 2. The correlation coefficients between peak ground motion characteristic parameters and slope seismic responses监测点位移 相关系数 ρ PGA PGV PGD P1位移 0.873 0.984 0.925 P2位移 0.874 0.978 0.922 P3位移 0.863 0.982 0.926 P4位移 0.861 0.980 0.928 P5位移 0.869 0.982 0.931 $$\rho {\text{=}} \frac{{\displaystyle\sum\limits_{{{n}} {\text{=}} 1}^{100} {{\text{(}}{R_n} {\text{-}} \overline R }{\text{)}}{\text{(}}{I_n} {\text{-}} {\overline {I\;}}{\text{)}}}}{{\sqrt {\displaystyle\sum\limits_{{{n}} {\text{=}} 1}^{100} {{\text{(}}{R_n} {\text{-}} \overline R } {{\text{)}}^2}} \sqrt {\displaystyle\sum\limits_{{{n}} {\text{=}} 1}^{100} {{{{\text{(}}{I_n} {\text{-}} {\overline {I\;}}{\text{)}}}^2}} } }}{\text{.}}$$ (5) 由表2中地震动峰值特征参数与边坡地震响应的相关性计算结果可以得出:PGV与边坡各监测点响应的相关性最高,相关系数介于0.978—0.984,平均值为0.981;而PGD的相关性略小于PGV,相关系数介于0.922—0.931,平均值为0.926;在三个地震动峰值特征参数中,PGA的相关性最小,相关系数介于0.861—0.874,平均值为0.868。对比结果显示,PGV可以作为最优参数进行考虑,但是其它参数仍可作为辅助参数进行综合对比研究。
4. 讨论与结论
通过计算分析土坡在100条随机地震动作用下的响应,探讨了PGA,PGV和PGD三个峰值特征参数土坡变形的影响规律和相关性,能够得出以下结论:① 对于土坡坡面的变形位移响应,与其相关性最高的特征参数为PGV,其次是PGD,最后是PGA,且三者与土坡变形位移都具有较好的正相关性;② PGA由于其获取的便利性以及工程运用的广泛性,可以作为描述地震动强弱的合理参数;③ PGD能够直接反应地震幅度对结构所造成的影响。综上所述,在关于土坡地震响应的研究中,可以选择PGV作为研究参数进行分析,也可以结合其它两个特征参数对分析结果进行综合考量。
值得指出的是,本文工作基于二维均质土坡模型展开,尚存在一定的局限性。在今后的研究中,可以针对三维模型分析或是进行动力试验,以便更好地为实际工程服务。
-
![]()
图 1 本文研究区域和相关目标地震图示
Figure 1. The regions designed and related target earthquakes in this study
![]()
图 2 研究区地震目录完整性分析
Figure 2. Analysis of the seismic catalogue completeness in study area
![]()
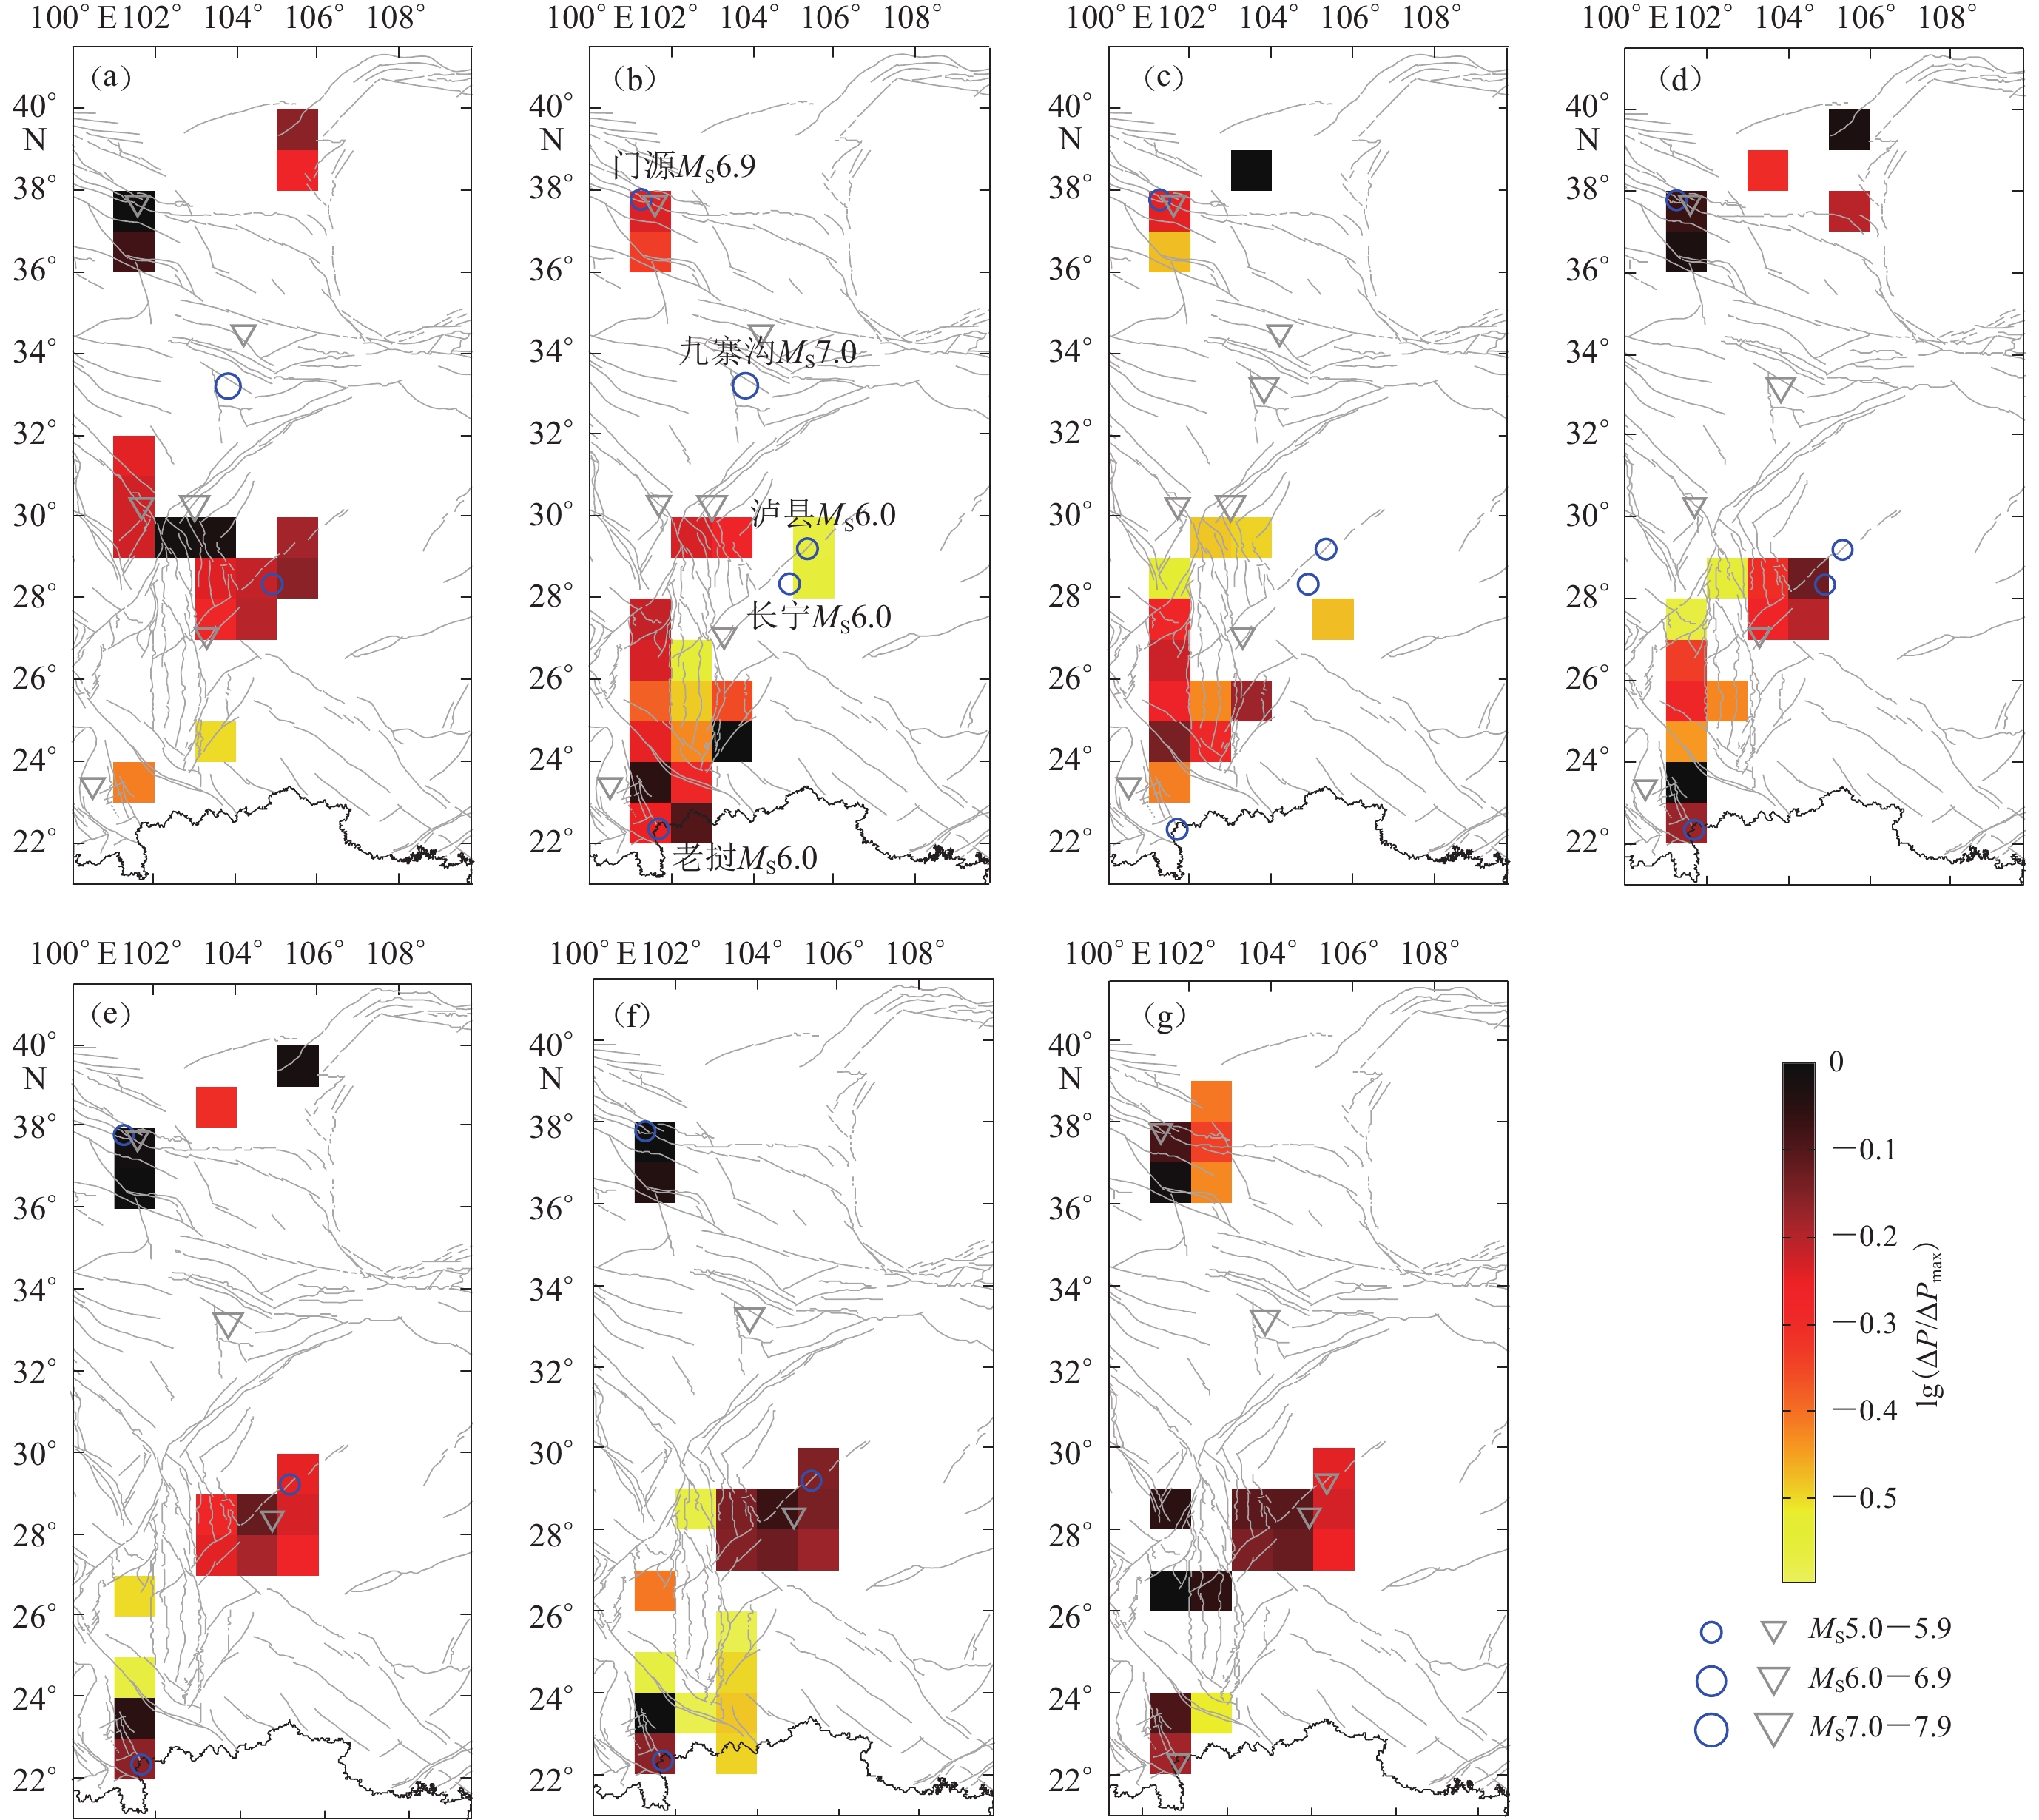
图 3 6个研究区在2017年1月31日至2022年1月31日预测时段的PI热点图
蓝色圆圈表示预测时段内发生的地震,灰色倒三角表示异常学习时段内发生的地震(a) 研究区1;(b) 研究区2;(c) 研究区3;(d) 研究区4;(e) 研究区5;(f) 研究区6
Figure 3. PI seismic hotspots maps in the period from 31 January 2017 to 31 January 2022 for six regions
Blue circles indicate earthquakes that occurred during the prediction period,and gray inverted triangles represent earthquakes that occurred during the anomaly learning period(a) Region 1;(b) Region 2;(c) Region 3;(d) Region 4;(e) Region 5;(f) Region 6
![]()
图 4 6个区域的PI算法回溯性研究的ROC检验
(a) 研究区1;(b) 研究区2;(c) 研究区3;(d) 研究区4;(e) 研究区5;(f) 研究区6
Figure 4. ROC test of the PI forecasting for the six selected regions
(a) Region 1;(b) Region 2;(c) Region 3;(d) Region 4;(e) Region 5;(f) Region 6
![]()
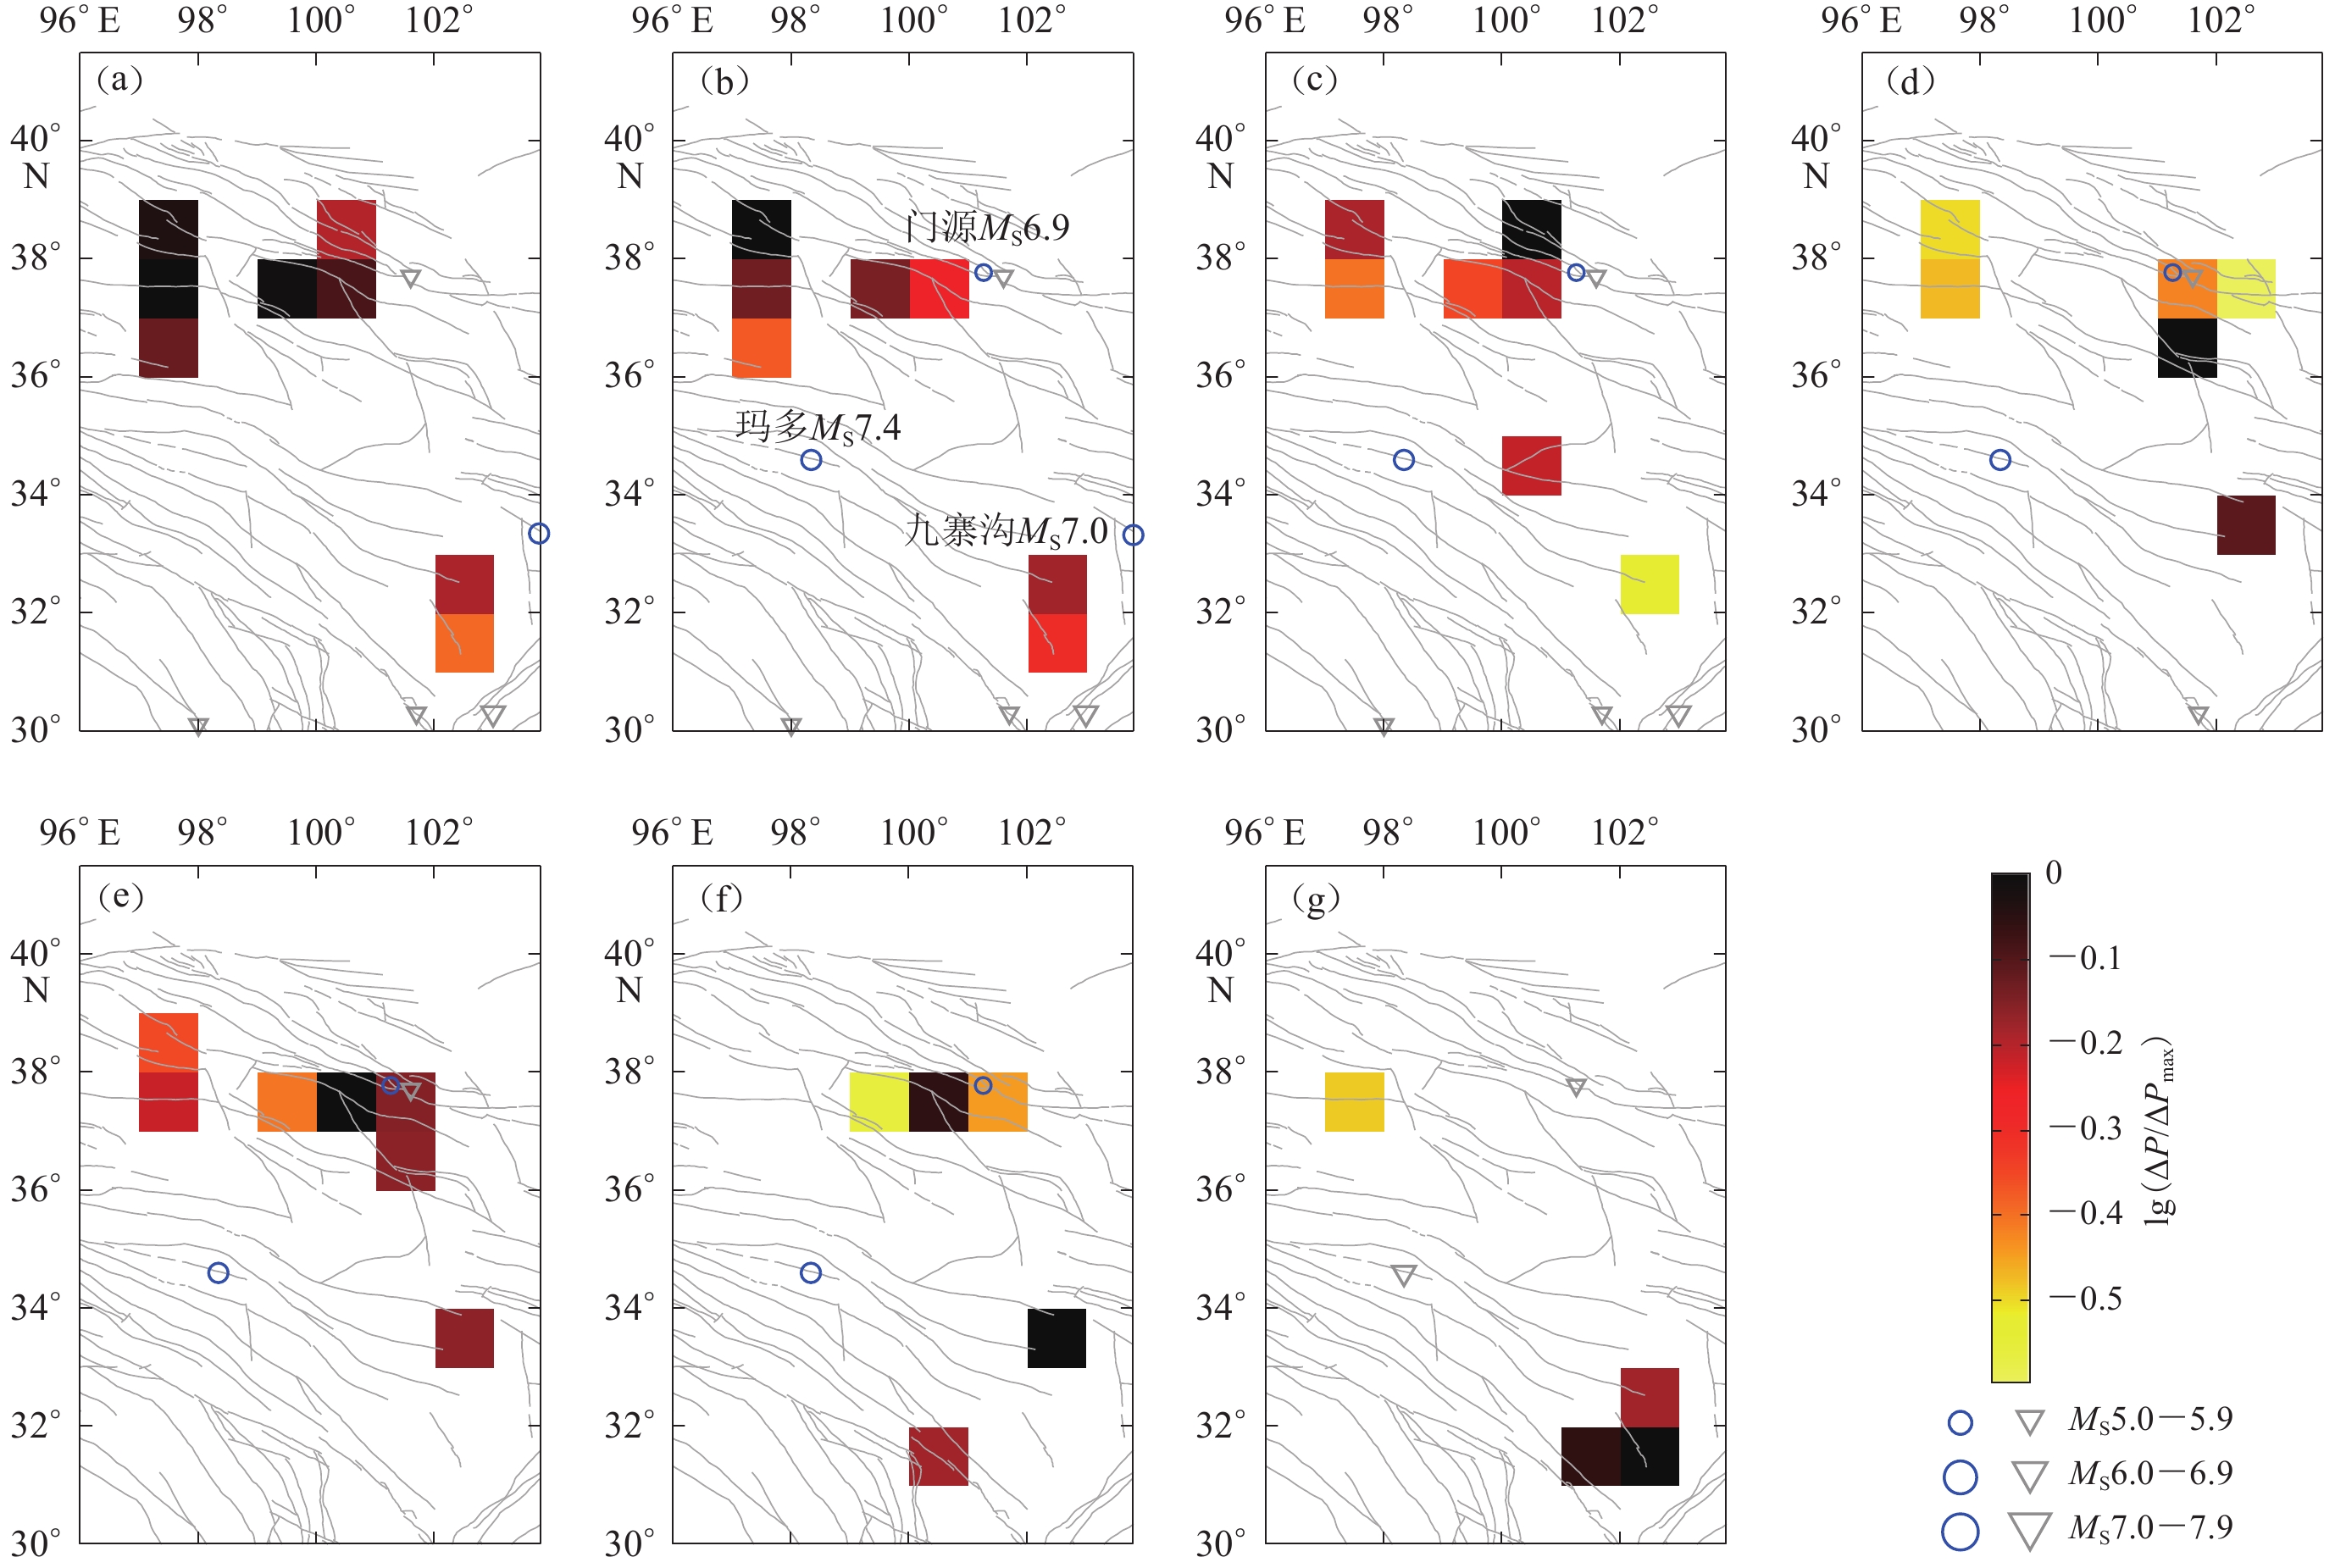
图 5 研究区1内不同预测时间窗口的PI地震热点演化
蓝色圆圈表示预测时段内发生的地震,灰色倒三角表示异常学习时段内发生的地震
Figure 5. Evolution of PI seismic hotspots for different time windows in region 1
Blue circles indicate earthquakes that occurred during the prediction period,and gray invertedtriangles represent earthquakes that occurred during the anomaly learning period(a) 2016—2020;(b) 2017—2021;(c) 2018—2022;(d) 2019—2023;(e) 2020—2024; (f) 2021—2025;(g) 2022—2026
![]()
图 6 研究区3不同预测时间窗口的PI地震热点演化图
蓝色圆圈表示预测时段内发生的地震,灰色倒三角表示异常学习时段内发生的地震
Figure 6. Evolution of PI seismic hotspots for different time windows in region 3
Blue circles indicate earthquakes that occurred during the prediction period,and gray inverted triangles represent earthquakes that occurred during the anomaly learning period(a) 2016—2020;(b) 2017—2021;(c) 2018—2022;(d) 2019—2023;(e) 2020—2024; (f)2021—2025;(g)2022—2026
![]()
图 7 研究区6不同预测时间窗口的PI地震热点演化图
蓝色圆圈表示预测时段内发生的地震,灰色倒三角表示异常学习时段内发生的地震
Figure 7. Evolution of PI seismic hotspots for different time windows in region 6
Blue circles indicate earthquakes that occurred during the prediction period,and gray inverted triangles represent earthquakes that occurred during the anomaly learning period (a) 2016—2020;(b) 2017—2021;(c) 2018—2022;(d) 2019—2023;(e) 2020—2024; (f) 2021—2025;(g) 2022—2026
表 1 本文研究区域
Table 1 Regions designed in this study
研究区域序号 经纬度范围 网格(1°×1°)数 1 (21°N—41.5°N,97.5°E—107.5°E) 205 2 (26°N—41.5°N,97.5°E—107.5°E) 155 3 (21°N—41.5°N,100°E—110°E) 205 4 (26°N—41.5°N,100°E—110°E) 155 5 (21°N—41.5°N,96°E—104°E) 164 6 (30°N—41.5°N,96°E—104°E) 92  下载: 导出CSV
表 2 本文研究的震例
Table 2 Earthquake cases in this study
序号 发震时间(北京时间)
年-月-日震中 北纬/° 东经/° MS 1 2 017−08−08 四川九寨沟 33.20 103.82 7.0 2 2 019−06−17 四川长宁 28.34 104.90 6.0 3 2 021−05−21 云南漾濞 25.67 99.87 6.4 4 2 021−05−22 青海玛多 34.59 98.34 7.4 5 2 021−09−16 四川泸县 29.20 105.34 6.0 6 2 021−12−24 老挝 22.33 101.69 6.0 7 2 022−01−08 青海门源 37.77 101.26 6.9
下载: 导出CSV
表 3 本研究的时间窗选取
Table 3 Time windows designed in this study
序号 t0 t1 t2 t3 1 19 70 20 11−01−31 20 16−01−31 20 21−01−31 2 19 70 20 12−01−31 20 17−01−31 20 22−01−31 3 19 70 20 13−01−31 20 18−01−31 20 23−01−31 4 19 70 20 14−01−31 20 19−01−31 20 24−01−31 5 19 70 20 15−01−31 20 20−01−31 20 25−01−31 6 19 70 20 16−01−31 20 21−01−31 20 26−01−31 7 19 70 20 17−01−31 20 22−01−31 20 27−01−31 注:表中t0,t1,t2和t3为PI算法的时间点,其中背景时段为$ [ t_{{\mathrm{b}}} \text{,} t_{1} ] $,异常学习时段为$ [ t_{{{1}}} \text{,} t_{2} ] $,预测时段为$ [ t_{{{2}}} \text{,} t_{3} ] $,详见第一节。共得到7个不同的时间段用于PI计算。
下载: 导出CSV
表 4 2017年1月31日至2022年1月31日预测时段不同区域的预测结果与地震的对应关系
Table 4 The corresponding relationship between the earthquake prediction results and earthquakes in different regions during the prediction period from January 31,2017 to January 31,2022
研究区 不同区域的预测与地震的对应关系 各研究区的
地震报准率四川九寨沟
MS7.0四川长宁
MS6.0云南漾濞
MS6.4青海玛多
MS7.4四川泸县
MS6.0老挝
MS6.01 0 0 0 0 0 1 0.17 2 0 1 / 0 1 / 0.50 3 0 1 / / 1 1 0.75 4 0 1 / / 0 / 0.33 5 0 / 1 0 / 0 0.25 6 1 / / 0 / / 0.50 各地震的报准比例 0.16 0.75 0.50 0 0.50 0.67 注:表中“1”表示报准地震,“0”表示漏报地震,“/”表示该地震未落在该区域的预测时段。
下载: 导出CSV
表 5 各区域统计检验结果
Table 5 Statistical test results of each region
研究区 R值评分 有效预测系数Ef 1 0.13 0.377 3 2 0.55 0.463 9 3 0.71 0.403 5 4 0.46 0.420 7 5 0.13 0.331 0 6 0.60 0.287 0
下载: 导出CSV
-
常祖峰,张艳凤,王光明,张世民,毛泽斌,刘昌伟. 2020. 2019年四川长宁MS6.0地震的地质构造成因:区域性构造节理贯通、破裂结果[J]. 地球学报,41(4):469–480. doi: 10.3975/cagsb.2020.030202 Chang Z F,Zhang Y F,Wang G M,Zhang S M,Mao Z B,Liu C W. 2020. The geological genesis of the 2019 Changning MS6.0 earthquake in Sichuan:Connecting and rupturing of regional structural joints[J]. Acta Geoscientica Sinica,41(4):469–480 (in Chinese).
蒋长胜,吴忠良. 2008. 对地震预测的一个统计物理算法在川滇地区的回溯性预测检验[J]. 中国科学(D辑),38(7):852–861. Jiang C S,Wu Z L. 2008. Retrospective forecasting test of a statistical physics model for earthquakes in Sichuan-Yunnan region[J]. Science in China:Series D,51(10):1401–1410. doi: 10.1007/s11430-008-0112-6
蒋长胜,吴忠良,马宏生,周龙泉. 2009. PI算法用于川滇-安达曼-苏门答腊地区7.0级以上强震危险性预测的回溯性检验[J]. 地震学报,31(3):307–318. doi: 10.3321/j.issn:0253-3782.2009.03.007 Jiang C S,Wu Z L,Ma H S,Zhou L Q. 2009. Sichuan-Yunnan versus Andaman-Sumatra:PI approach and retrospective forecast test[J]. Acta Seismologica Sinica,31(3):307–318 (in Chinese).
康来迅. 1991. 中国南北地震带的基本特征及其形成机理之探讨[J]. 地壳形变与地震,11(4):76–85. Kang L X. 1991. Discussion on the basic characteristics and formation mechanism of the South-North Seismic Zone in China[J]. Crustal Deformation and Earthquake,11(4):76–85 (in Chinese).
况春利,唐新功,于恒达,杨士达,胡家文,任子钧. 2019. 南北地震带地震活动特征[J]. 国际地震动态,(7):2–8. doi: 10.3969/j.issn.0253-4975.2019.07.002 Kuang C L,Tang X G,Yu H D,Yang S D,Hu J W,Ren Z J. 2019. Study on the seismic distribution and migration law of North-South Seismic Belt in China[J]. Recent Developments in World Seismology,(7):2–8 (in Chinese).
马宏生,刘杰,吴昊,李杰飞. 2004. 基于R值评分的年度地震预报能力评价[J]. 地震,24(2):31–37. doi: 10.3969/j.issn.1000-3274.2004.02.005 Ma H S,Liu J,Wu H,Li J F. 2004. Scientific evaluation of annual earthquake prediction efficiency based on R-value[J]. Earthquake,24(2):31–37 (in Chinese).
尼鲁帕尔·买买吐孙,余怀忠. 2020. 利用图像信息方法研究库车MS5.6、于田MS6.4地震前异常演化[J]. 内陆地震,34(3):215–222. Maimaitusun N,Yu H Z. 2020. Anomalous evolution before Kuche MS5.6 and Yutian MS6.4 earthquake by pattern informatics method[J]. Inland Earthquake,34(3):215–222 (in Chinese).
宋程,张永仙,夏彩韵,张盛峰,高冰莹,郑世禄. 2018. 日本东北MW9.0地震的PI模型参数设置与预测效能回溯性检验[J]. 地震学报,40(4):491–505. Song C,Zhang Y X,Xia C Y,Zhang S F,Gao B Y,Zheng S L. 2018. Retrospective test on the forecasting efficacy of PI models with different parameters for the Tohoku-Oki MW9.0 earthquake[J]. Acta Seismologica Sinica,40(4):491–505 (in Chinese).
夏彩韵,张永仙,张小涛,吴永加. 2015. 利用两次新疆于田MS7.3地震对图像信息方法可预测性的检验[J]. 地震学报,37(2):312–322. doi: 10.11939/j.issn:0253-3782.2015.02.011 Xia C Y,Zhang Y X,Zhang X T,Wu Y J. 2015. Predictability test for pattern information method by two MS7.3 Yutian,Xinjiang,earthquakes[J]. Acta Seismologica Sinica,37(2):312–322 (in Chinese).
许绍燮. 1989. 地震预报能力评分[G]//地震预报方法实用化攻关文集(测震分册). 北京:地震出版社:586−589. Xu S X. 1989. The evaluation of earthquake prediction ability[G]//The Practical Research Papers on Earthquake Prediction Methods (Seismicity Section). Beijing:Seismological Press:586−589 (in Chinese).
杨兴悦,杨立明,陈继峰,张辉,王燕,李冬梅. 2012. 南北地震带南北段地震迁移现象[J]. 地震地磁观测与研究,33(5/6):7–12. Yang X Y,Yang L M,Chen J F,Zhang H,Wang Y,Li D M. 2012. Discussion on earthquake migration phenomenon of northern and southern zone in North-South Seismic Belt[J]. Seismological and Geomagnetic Observation and Research,33(5/6):7–12 (in Chinese).
易桂喜,龙锋,梁明剑,赵敏,王思维,宫悦,乔慧珍,苏金蓉. 2019. 2019年6月17日四川长宁MS6.0地震序列震源机制解与发震构造分析[J]. 地球物理学报,62(9):3432–3447. doi: 10.6038/cjg2019N0297 Yi G X,Long F,Liang M J,Zhao M,Wang S W,Gong Y,Qiao H Z,Su J R. 2019. Focal mechanism solutions and seismogenic structure of the 17 June 2019 MS6.0 Sichuan Changning earthquake sequence[J]. Chinese Journal of Geophysics,62(9):3432–3447 (in Chinese).
易桂喜,龙锋,赵敏,梁明剑,王明明,周荣军,王思维. 2021. 2021年9月16日四川泸县MS6.0地震序列特征及孕震构造环境[J]. 地球物理学报,64(12):4449–4461. doi: 10.6038/cjg2021O0533 Yi G X,Long F,Zhao M,Liang M J,Wang M M,Zhou R J,Wang S W. 2021. Characteristics of the seismic sequence and seismogenic environment of the MS6.0 Sichuan Luxian earthquake on September 16,2021[J]. Chinese Journal of Geophysics,64(12):4449–4461 (in Chinese).
余怀忠,于晨,张小涛. 2020. 2020年6月26日于田MS6.4地震前的多重地震参数异常研究[J]. 内陆地震,34(3):207–214. Yu H Z, Yu C, Zhang X T. 2020. Study on multiple seismic parameter anomalies before Yutian MS6.4 earthquake on June 26th, 2020[J]. Inland Earthquake, 34(3): 207–214 (in Chinese). Yu H Z,Yu C,Zhang X T. 2020. Study on multiple seismic parameter anomalies before Yutian MS6.4 earthquake on June 26th,2020[J]. Inland Earthquake,34(3):207–214 (in Chinese).
张国民,刘杰,石耀霖. 2002. 年度地震预报能力的科学评价[J]. 地震学报,24(5):525–532. doi: 10.3321/j.issn:0253-3782.2002.05.010 Zhang G M,Liu J,Shi Y L. 2002. An scientific evaluation of annual earthquake prediction ability[J]. Acta Seismologica Sinica,15(5):550–558. doi: 10.1007/s11589-002-0024-z
张盛峰. 2015. “地震可预测性合作研究”计划(CSEP)南北地震带试验区地震活动的一些统计地震学特征及其在地震预测中的应用[D]. 北京:中国地震局地球物理研究所:28−34,77−80. Zhang S F. 2015. Statistical-Seismological Features of Seismicity in the CSEP Testing Region of the Central China South-North Seismic Zone With Implications for Earthquake Predictability[D]. Beijing:Institute of Geophysics,China Earthquake Administration:28−34,77−80 (in Chinese).
张小涛,张永仙,夏彩韵,吴永加,余怀忠. 2014. 利用图像信息方法研究芦山MS7.0地震前川滇及附近地区的图像异常[J]. 地震学报,36(5):780–789. Zhang X T,Zhang Y X,Xia C Y,Wu Y J,Yu H Z. 2014. Anomalous seismic activities in the Sichuan-Yunnan region and its adjacent areas before the Lushan MS7.0 earthquake by the pattern informatics method[J]. Acta Seismologica Sinica,36(5):780–789 (in Chinese).
郑兆苾,刘杰,李罡风,钱家栋,汪雪泉. 2000. 全国年度地震重点危险区与地震相关性的统计模拟分析[J]. 地震学报,22(5):538–546. doi: 10.3321/j.issn:0253-3782.2000.05.011 Zheng Z B,Liu J,Li G F,Qian J D,Wang X Q. 2000. Statistical simulation analysis of the correlation between the annual estimated key regions with a certain seismic risk and the earthquakes in China[J]. Acta Seismologica Sinica,13(5):575–584. doi: 10.1007/s11589-000-0057-0
Chang L Y,Chen C C,Telesca L,Li H C,Cheong S A. 2020. Pattern informatics and the soup-of-groups model of earthquakes:A case study of Italian seismicity[J]. Pure Appl Geophys,177(9):4089–4096. doi: 10.1007/s00024-020-02509-w
Chen C C,Rundle J B,Holliday J R,Nanjo K Z,Turcotte D L,Li S C,Tiampo K F. 2005. The 1999 Chi-Chi,Taiwan,earthquake as a typical example of seismic activation and quiescence[J]. Geophys Res Lett,32(22):L22315.
Chen C C,Rundle J B,Li H C,Holliday J R,Nanjo K Z,Turcotte D L,Tiampo K F. 2006. From tornadoes to earthquakes:Forecast verification for binary events applied to the 1999 Chi-Chi,Taiwan,earthquake[J]. Terr,Atmos Ocean Sci, 17 (3):503−516.
Holliday J R,Nanjo K Z,Tiampo K F,Rundle J B,Turcotte D L. 2005. Earthquake forecasting and its verification[J]. Nonlin Processes Geophys,12(6):965–977. doi: 10.5194/npg-12-965-2005
Holliday J R,Rundle J B,Tiampo K F,Klein W,Donnellan A. 2006. Systematic procedural and sensitivity analysis of the pattern informatics method for forecasting large (M>5) earthquake events in southern California[J]. Pure Appl Geophys,163(11/12):2433–2454.
Keilis-Borok V,Shebalin P,Gabrielov A,Turcotte D. 2004. Reverse tracing of short-term earthquake precursors[J]. Phys Earth Planet Inter,145(1/2/3/4):75–85.
Mohanty W K,Mohapatra A K,Verma A K,Tiampo K F,Kislay K. 2016. Earthquake forecasting and its verification in northeast India[J]. Geomatics,Nat Hazards Risk, 7 (1):194−214.
Molchan G M. 1997. Earthquake prediction as a decision-making problem[J]. Pure Appl Geophys, 149 (1):233−247.
Nanjo K Z,Rundle J B,Holliday J R,Turcotte D L. 2006a. Pattern informatics and its application for optimal forecasting of large earthquakes in Japan[J]. Pure Appl Geophys,163(11/12):2417–2432.
Nanjo K Z,Holliday J R,Chen C C,Rundle J B,Turcotte D L. 2006b. Application of a modified pattern informatics method to forecasting the locations of future large earthquakes in the central Japan[J]. Tectonophysics,424(3/4):351–366.
Radan M Y,Hamzehloo H,Peresan A,Zare M,Zafarani H. 2013. Assessing performances of pattern informatics method:A retrospective analysis for Iran and Italy[J]. Nat Hazards,68(2):855–881. doi: 10.1007/s11069-013-0660-8
Rundle J B,Klein W,Tiampo K,Gross S. 2000a. Linear pattern dynamics in nonlinear threshold systems[J]. Phys Rev E,61(3):2418–2431. doi: 10.1103/PhysRevE.61.2418
Rundle J B,Klein W,Turcotte D L,Malamud B D. 2000b. Precursory seismic activation and critical-point phenomena[J]. Pure Appl Geophys,157(11/12):2165–2182.
Rundle J B,Tiampo K F,Klein W,Martins J S S. 2002. Self-organization in leaky threshold systems:The influence of near-mean field dynamics and its implications for earthquakes,neurobiology,and forecasting[J]. Proc Natl Acad Sci USA,99(S_1):2514–2521. doi: 10.1073/pnas.012581899
Shi Y L,Liu J,Zhang G M. 2001. An evaluation of Chinese annual earthquake predictions,1990−1998[J]. J Appl Probab,38(A):222–231. doi: 10.1239/jap/1085496604
Swets J A. 1973. The relative operating characteristic in psychology:A technique for isolating effects of response bias finds wide use in the study of perception and cognition[J]. Science, 182 (4116):990−1000.
Tiampo K F,Rundle J B,McGinnis S A,Klein W. 2002. Pattern dynamics and forecast methods in seismically active regions[J]. Pure Appl Geophys,159(10):2429–2467. doi: 10.1007/s00024-002-8742-7
Wu Z L,Liu J,Zhu C Z,Jiang C S,Huang F Q. 2007. Annual consultation on the likelihood of earthquakes in continental China:Its scientific and practical merits[J]. Earthquake Research in China,21(4):365–371.
Zhang Y X,Zhang X T,Wu Y J,Yin X C. 2013. Retrospective study on the predictability of pattern informatics to the Wenchuan M8.0 and Yutian M7.3 earthquakes[J]. Pure Appl Geophys,170(1/2):197–208.
Zhang Y X,Xia C Y,Song C,Zhang X T,Wu Y J,Xue Y. 2017. Test of the predictability of the PI method for recent large earthquakes in and near Tibetan Plateau[J]. Pure Appl Geophys,174(6):2411–2426. doi: 10.1007/s00024-017-1551-9
Zhao Y Z,Wu Z L,Jiang C S,Zhu C Z. 2010. Reverse tracing of precursors applied to the annual earthquake forecast:Retrospective test of the annual consultation in the Sichuan-Yunnan region of southwest China[J]. Pure Appl Geophys,167(6):783–800.
-
期刊类型引用(1)
1. 禹海涛,李晶,王祺. 软土隧道基于地震响应的输入地震动排序. 地震学报. 2022(01): 123-131 .  本站查看
本站查看
其他类型引用(3)


计量
- 文章访问数: 189
- HTML全文浏览量: 29
- PDF下载量: 31
- 被引次数: 4
