

Rapid magnitude estimation based on multi-input Gaussian process regression
-
摘要:
为充分利用初至地震波中与震级相关的信息,提高震级估算精度,本文提出了一种震级快速估算方法(GPR),该方法将初至地震波在时域、频域和时频域中的10个特征参数输入高斯过程回归模型实现震级估算。利用日本的大量地表强震记录对GPR方法进行训练和测试,并与最大卓越周期${\tau ^{\max }_{\mathrm{p}}} $方法和位移幅值P d方法进行了对比。结果表明,GPR方法在有震源距和无震源距两种情况下,估算震级的准确性均显著好于${\tau ^{\max }_{\mathrm{p}}} $方法和P d方法。此外,利用智利的地表强震记录对日本数据训练的GPR进行泛化能力测试的结果显示,GPR方法较${\tau ^{\max }_{\mathrm{p}}} $方法和P d方法具有更好的泛化能力。利用GPR方法对我国的三次典型震例进行震级估算,验证该方法是合理且可靠的,表明GPR方法不会受到地域差异的影响,可以有效提高地震预警系统估算震级的准确度。
Abstract:Accurate and rapid magnitude estimation is of paramount importance for earthquake early warning systems (EEWs). Traditional magnitude estimation methods based on a single characteristic parameter of the initial seismic wave are widely used in EEWs. However, these empirical formulae, established by a single characteristic parameter, fail to fully exploit the information related to magnitude contained in the initial seismic wave, significantly limiting the effectiveness of magnitude estimation. To improve the accuracy of magnitude estimation in EEWs, this paper proposes a Gaussian process regression (GPR) based method that can estimate magnitudes in both scenarios: with and without hypocentral distance. The proposed method, GPR-M, uses multiple characteristic parameters from the time domain, frequency domain, and time-frequency domain as inputs, while GPR-M-R incorporates hypocentral distance. Both methods estimate magnitude by integrating various aspects of information from the initial seismic wave. The study utilized
33698 vertical acceleration records from the Japanese Kiban-Kyoshin Network (KiK-net) for training and testing, and5353 vertical acceleration records from the Chilean Simulation Based Earthquake Risk and Resilience of Interdependent Systems and Networks (SIBER-RISK) for generalization testing. Additionally, the method’s practical application was validated using three typical earthquake cases in China, with MS5.4, MS6.4, and MS8.0. The performance of the GPR method was compared with the widely adopted ${\tau ^{\max }_{\mathrm{p}}} $ and P d methods. The test results from the Japanese records indicate that for initial seismic waves of 3 to 10 s, both GPR-M and GPR-M-R outperform the ${\tau ^{\max }_{\mathrm{p}}} $ and P d methods in magnitude estimation. Specifically, the standard deviation of estimation errors for the GPR-M method is reduced by approximately 52.53% to 61.20% compared with the ${\tau ^{\max }_{\mathrm{p}}} $ method, while the GPR-M-R method reduces the standard deviation of estimation errors by about 37.72% to 41.21% compared with the P d method. For larger earthquakes (MW≥6.5), the magnitude saturation phenomenon is less pronounced in the GPR-M and GPR-M-R methods compared with the ${\tau ^{\max }_{\mathrm{p}}} $ and P d methods. The accuracy of magnitude estimation for MW≥6.5 is improved by 1.4 to 1.5 times with the GPR-M method compared with the ${\tau ^{\max }_{\mathrm{p}}} $ method, and by 1.2 to 1.45 times with the GPR-M-R method compared with the P d method. The test results from the Chilean data demonstrate that both the GPR-M and GPR-M-R methods can effectively estimate earthquake magnitudes in Chile. The standard deviation of estimation errors for the GPR-M method is reduced by approximately 53.08% to 55.13% compared with the ${\tau ^{\max }_{\mathrm{p}}} $ method, and the GPR-M-R method reduces the standard deviation of estimation errors by about 35.88% to 36.59% compared with the P d method, showing excellent generalization capability. The test results from the three Chinese earthquake cases further confirmed that the GPR methods exhibit better accuracy and reliability compared with the ${\tau ^{\max }_{\mathrm{p}}} $ and P d methods. The GPR method can significantly improve the accuracy of magnitude estimation in EEWs and is not affected by regional differences. In conclusion, this study presents a novel GPR-based magnitude estimation method that integrates multiple seismic wave features and optionally incorporates hypocentral distance information. The method demonstrates superior performance in terms of accuracy, reliability, and generalization ability compared with traditional single-parameter approaches. By effectively reducing estimation errors and mitigating magnitude saturation issues, particularly for larger earthquakes, the proposed GPR method offers significant potential for improving the effectiveness of EEWs across diverse geographical regions. -
-
![]()
图 1 强震动记录随震级和震源距的分布(每个点代表一条地震动记录)
Figure 1. Distribution of strong motion records with magnitude and hypocentral distance (each point represents a ground motion record)
![]()
图 2 GPR的网络结构示意图
x为输入,K(${x^{i}}\text{,} x^{j} $)为协方差函数,y为输出
Figure 2. Schematic diagram of the GPR network structure
x is the input,K(${x^{i}}\text{,} x^{j} $) is the covariance function,and y is the output
![]()
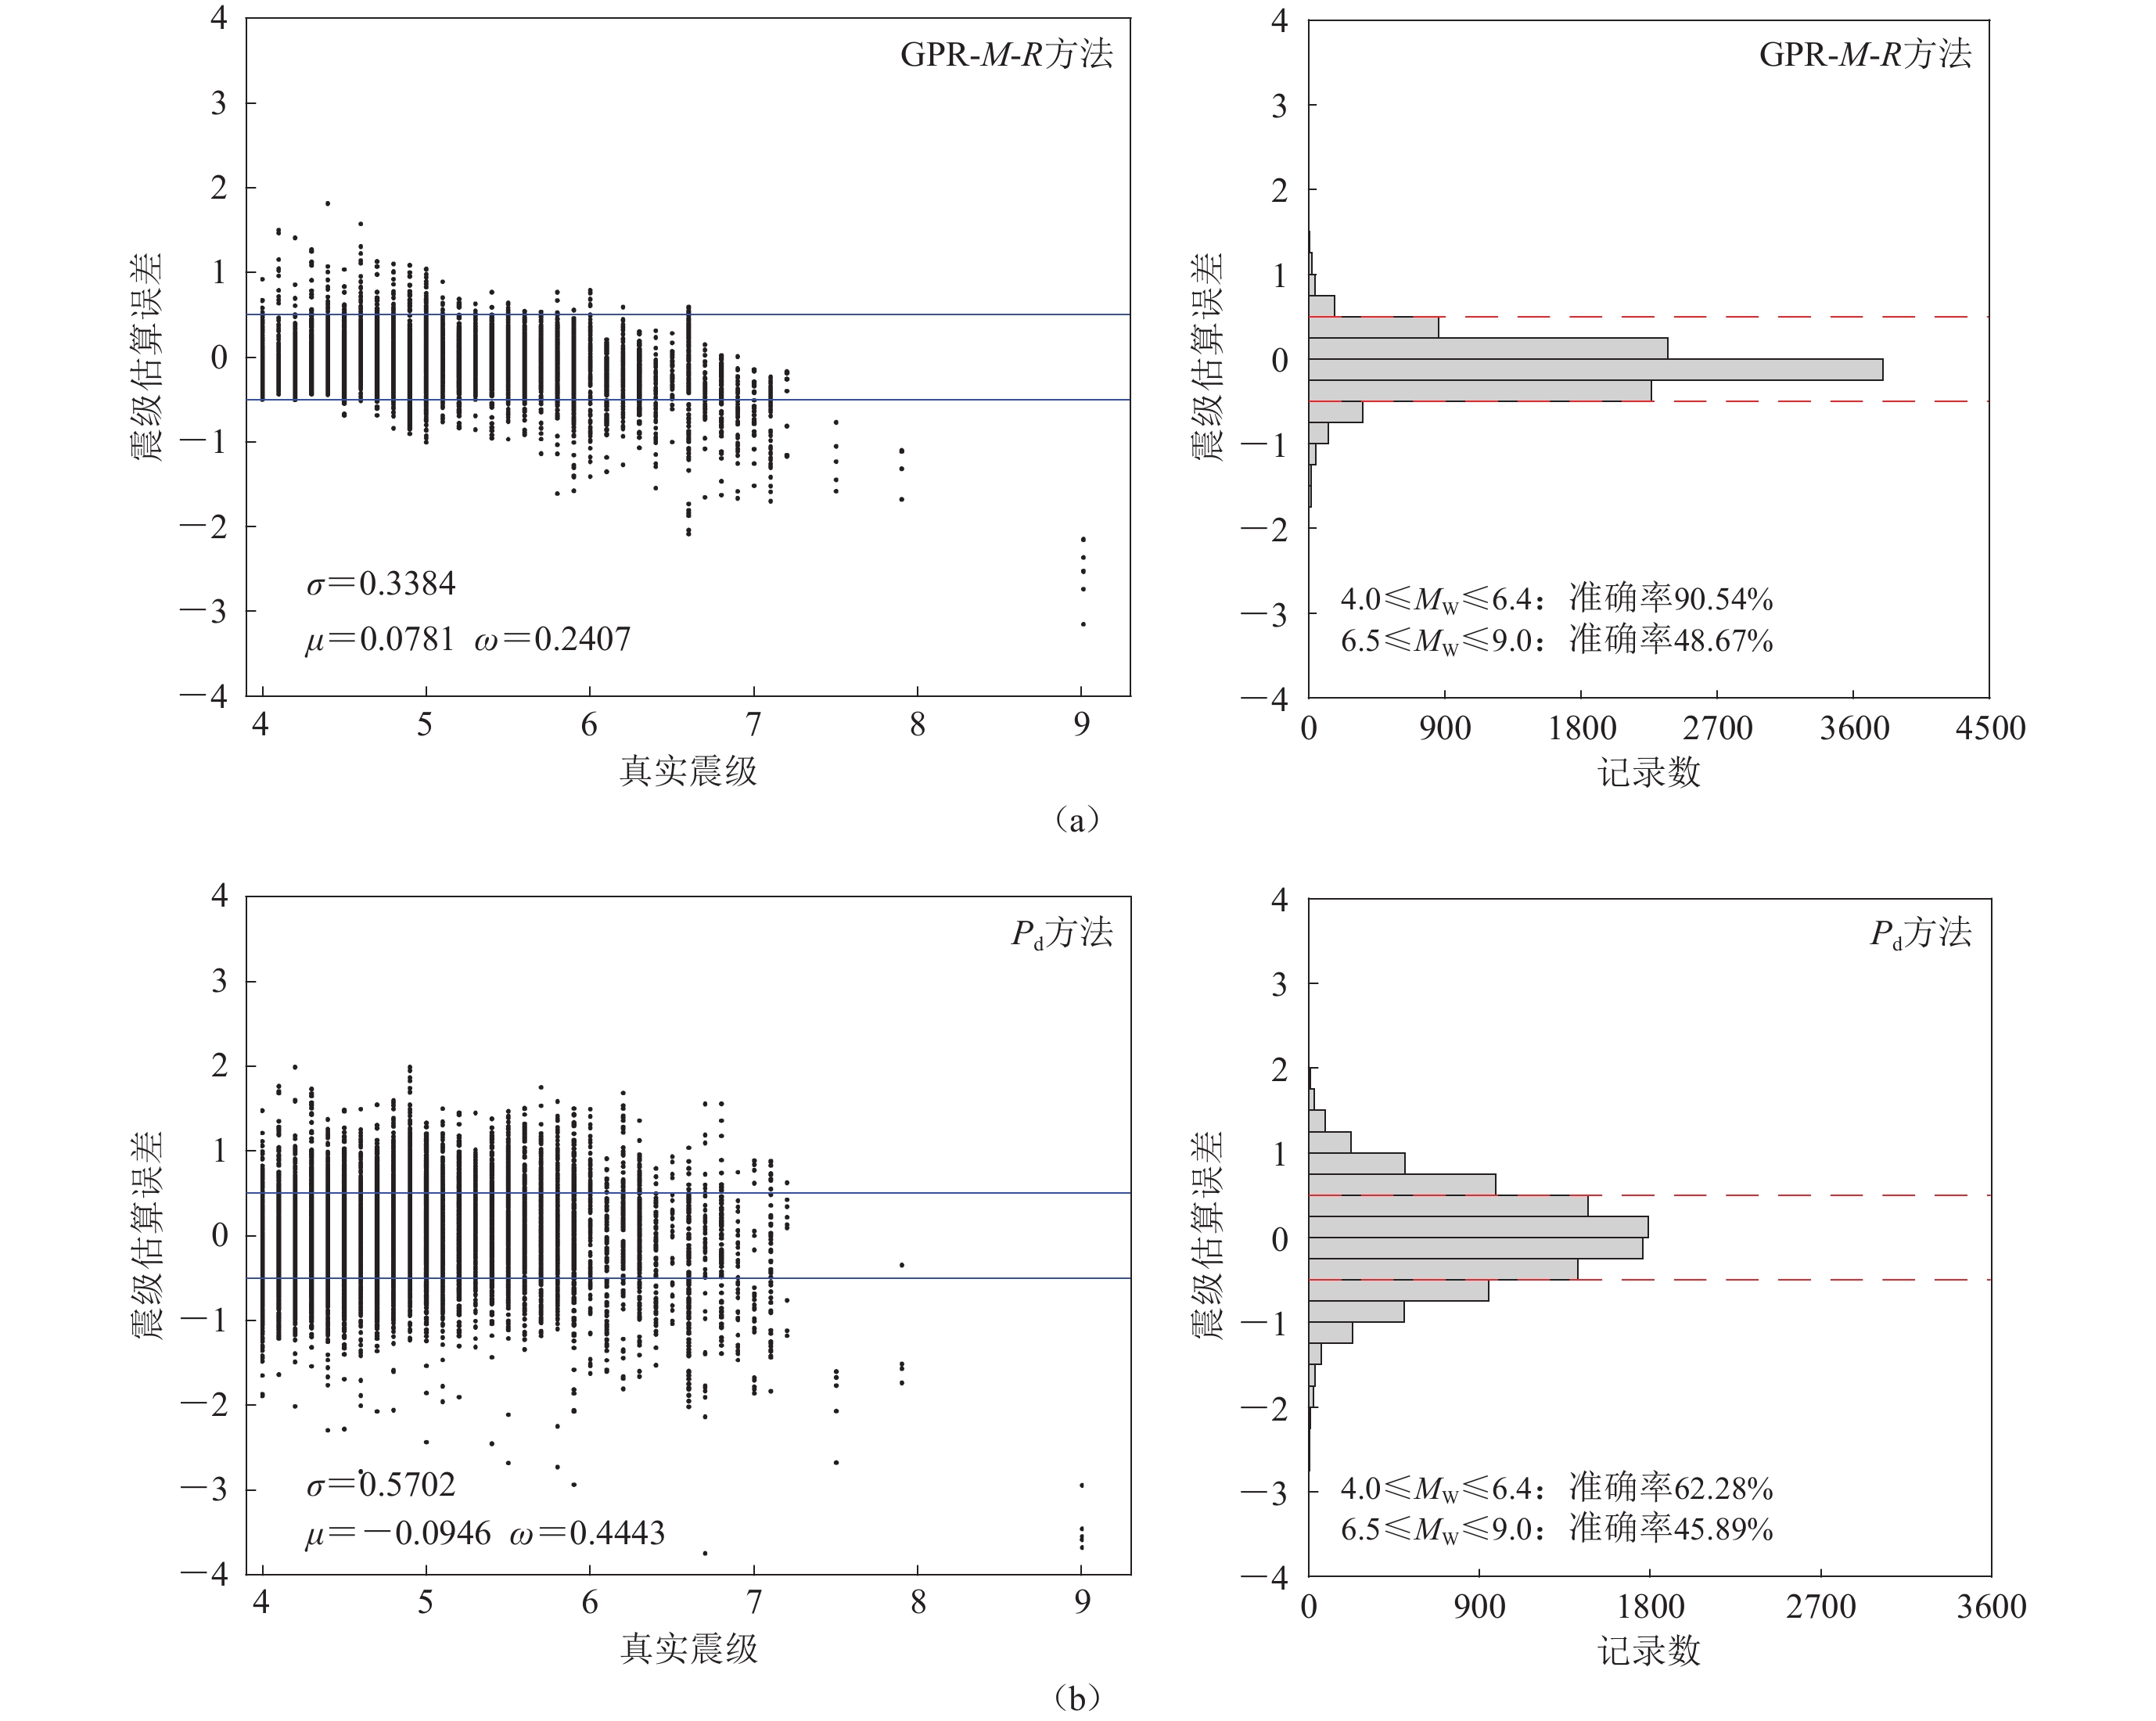
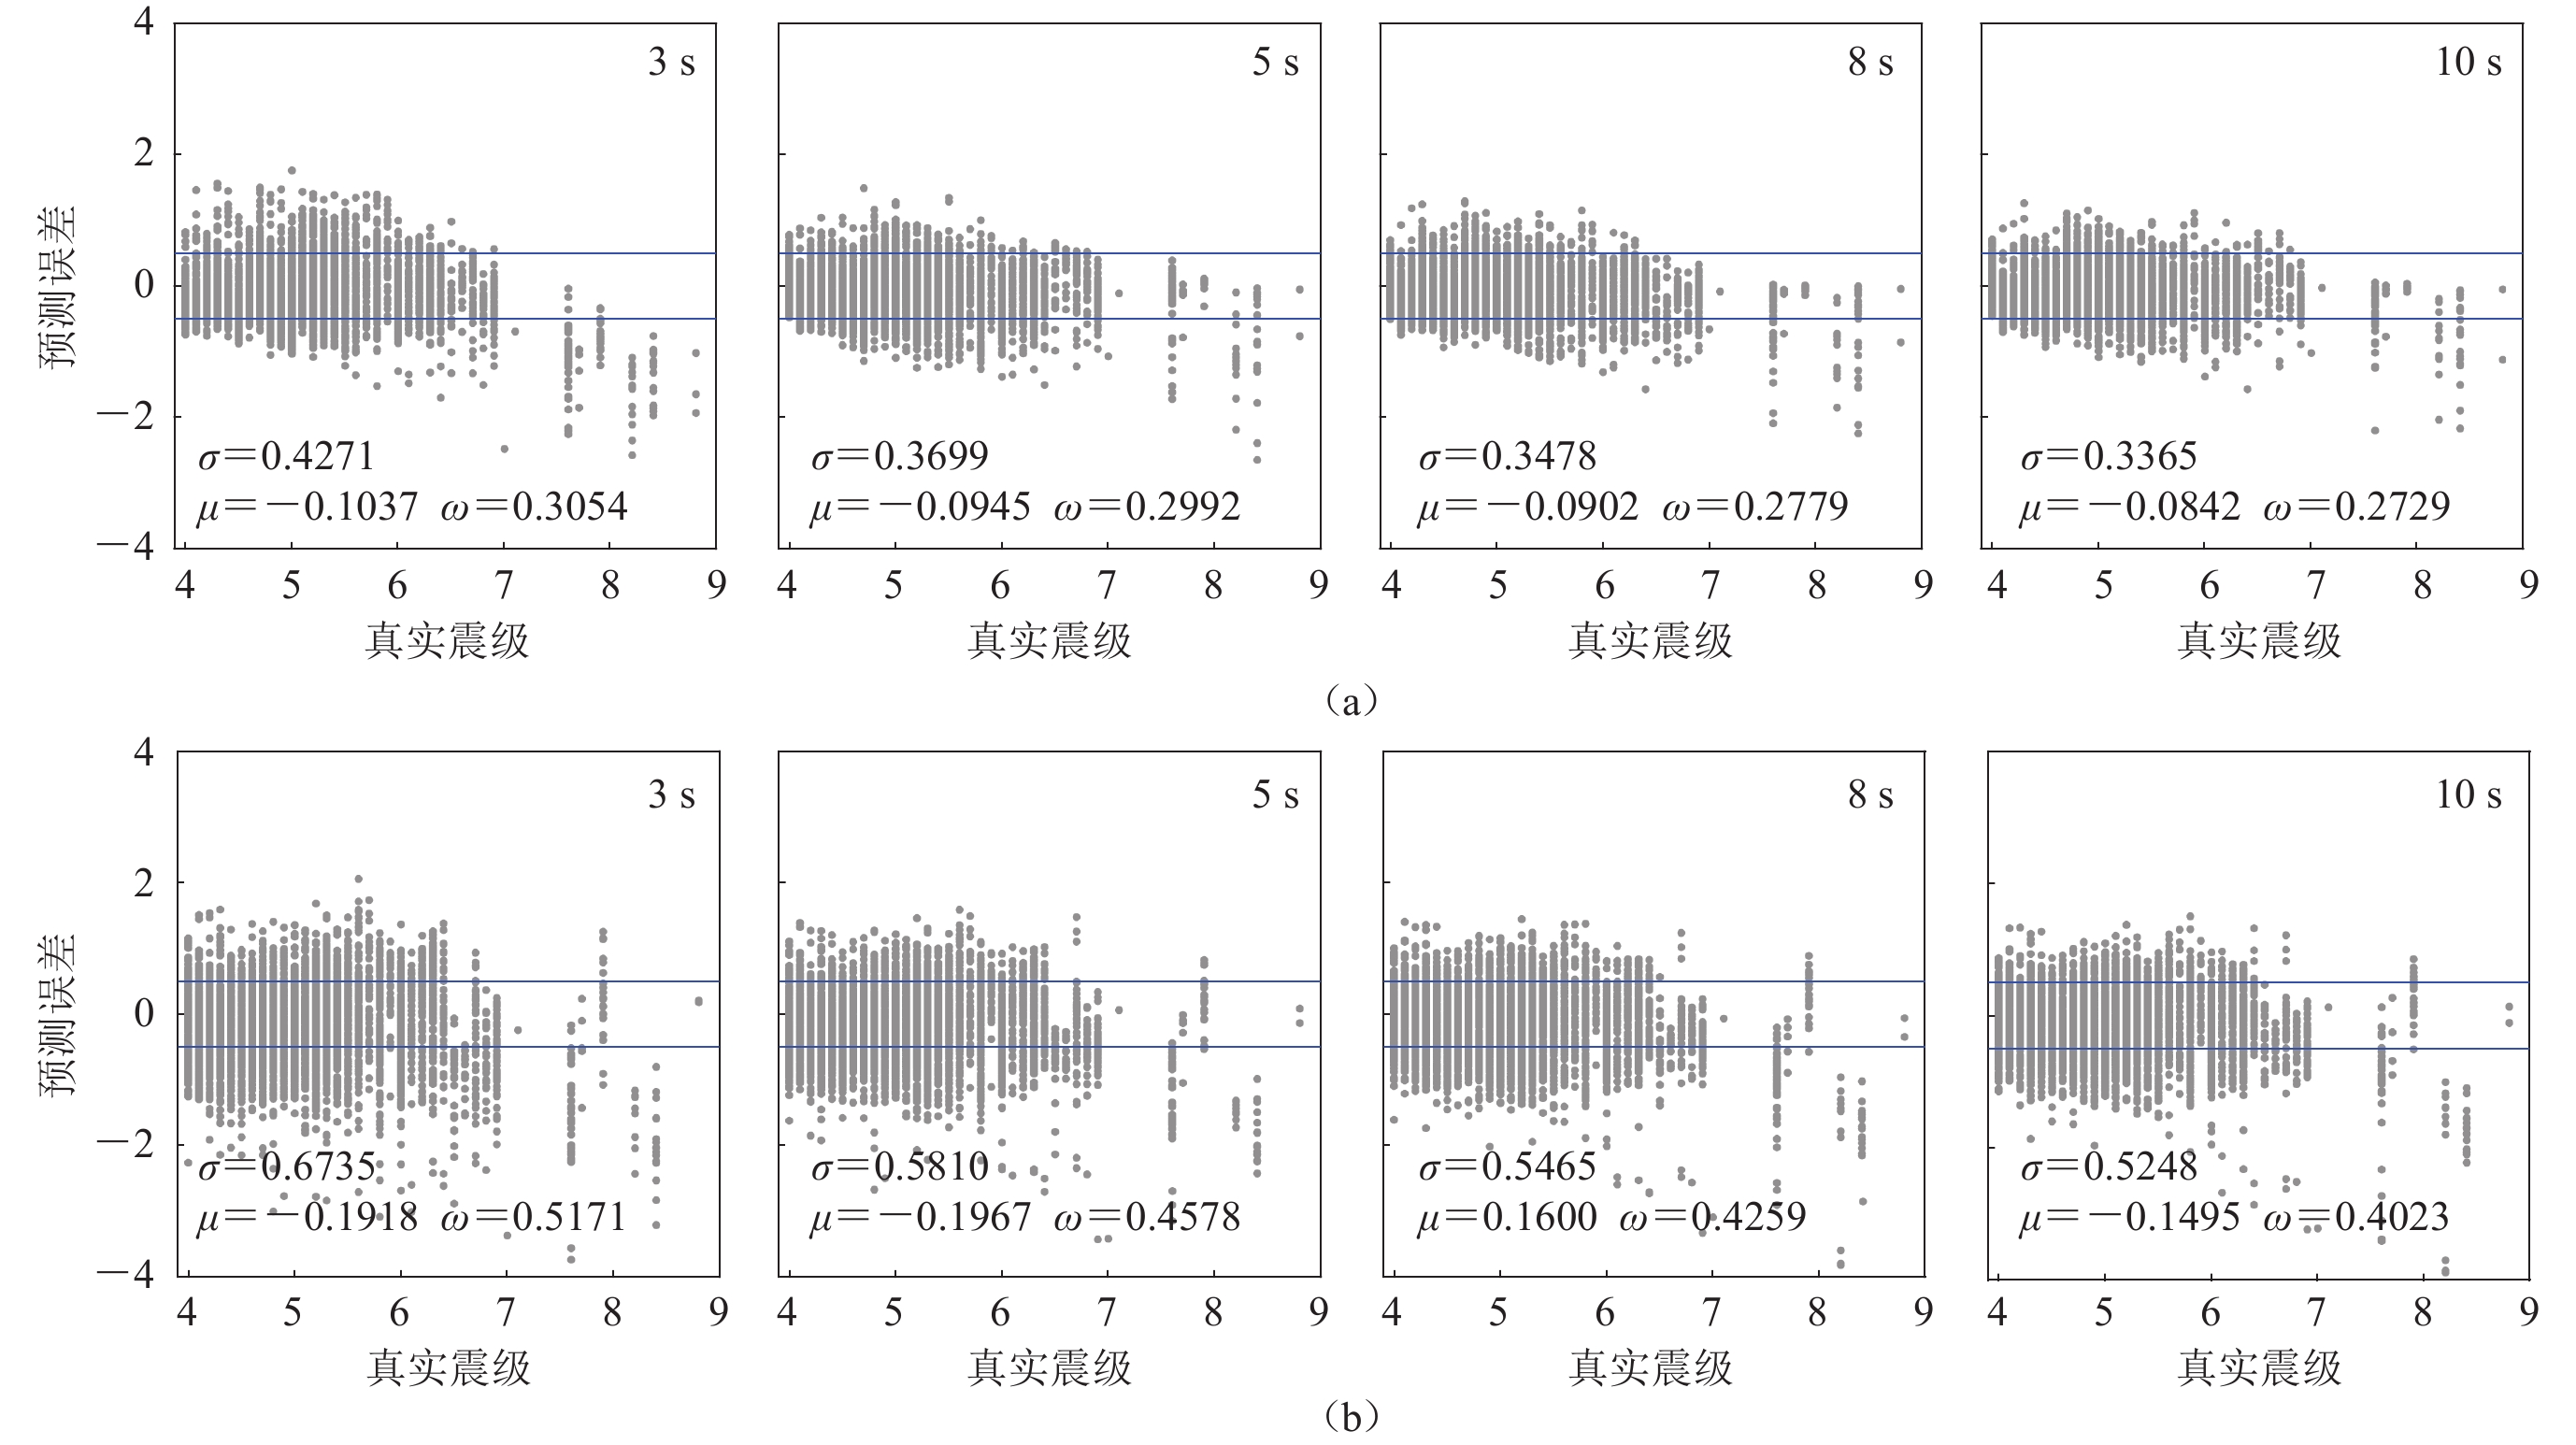
图 3 初至3 s P波时GPR-M (a)和$ {\tau ^{\max }_{\mathrm{p}}}$(b)估算震级的误差分布及其直方图
图中的散点表示每条记录估算震级的误差,蓝色实线和红色虚线表示±0.5,σ为误差标准差,μ为误差均值,ω为误差绝对值均值,准确率定义为误差在$ [ $−0.5, 0.5$ ] $的记录数与记录总数的比值,下同
Figure 3. Distribution of estimated magnitude errors by GPR-M (a) and $ {\tau ^{\max }_{\mathrm{p}}}$ (b) at initial 3 s P-wave
Scatter points show magnitude estimation errors based on per record. Blue solid lines and red dashed lines indicate ±0.5 . σ is error standard deviation,μ is mean error,ω is mean absolute error,accuracy is the ratio of records with errors in $ [ $−0.5,0.5$ ] $ to total records,the same below
![]()
图 4 初至3 s P波GPR-M-R (a)和P d (b)方法估算震级的误差分布
Figure 4. Distributions and histograms of estimated magnitude errors for GPR-M-R (a) and P d (b) for initial 3 s P-wave
![]()
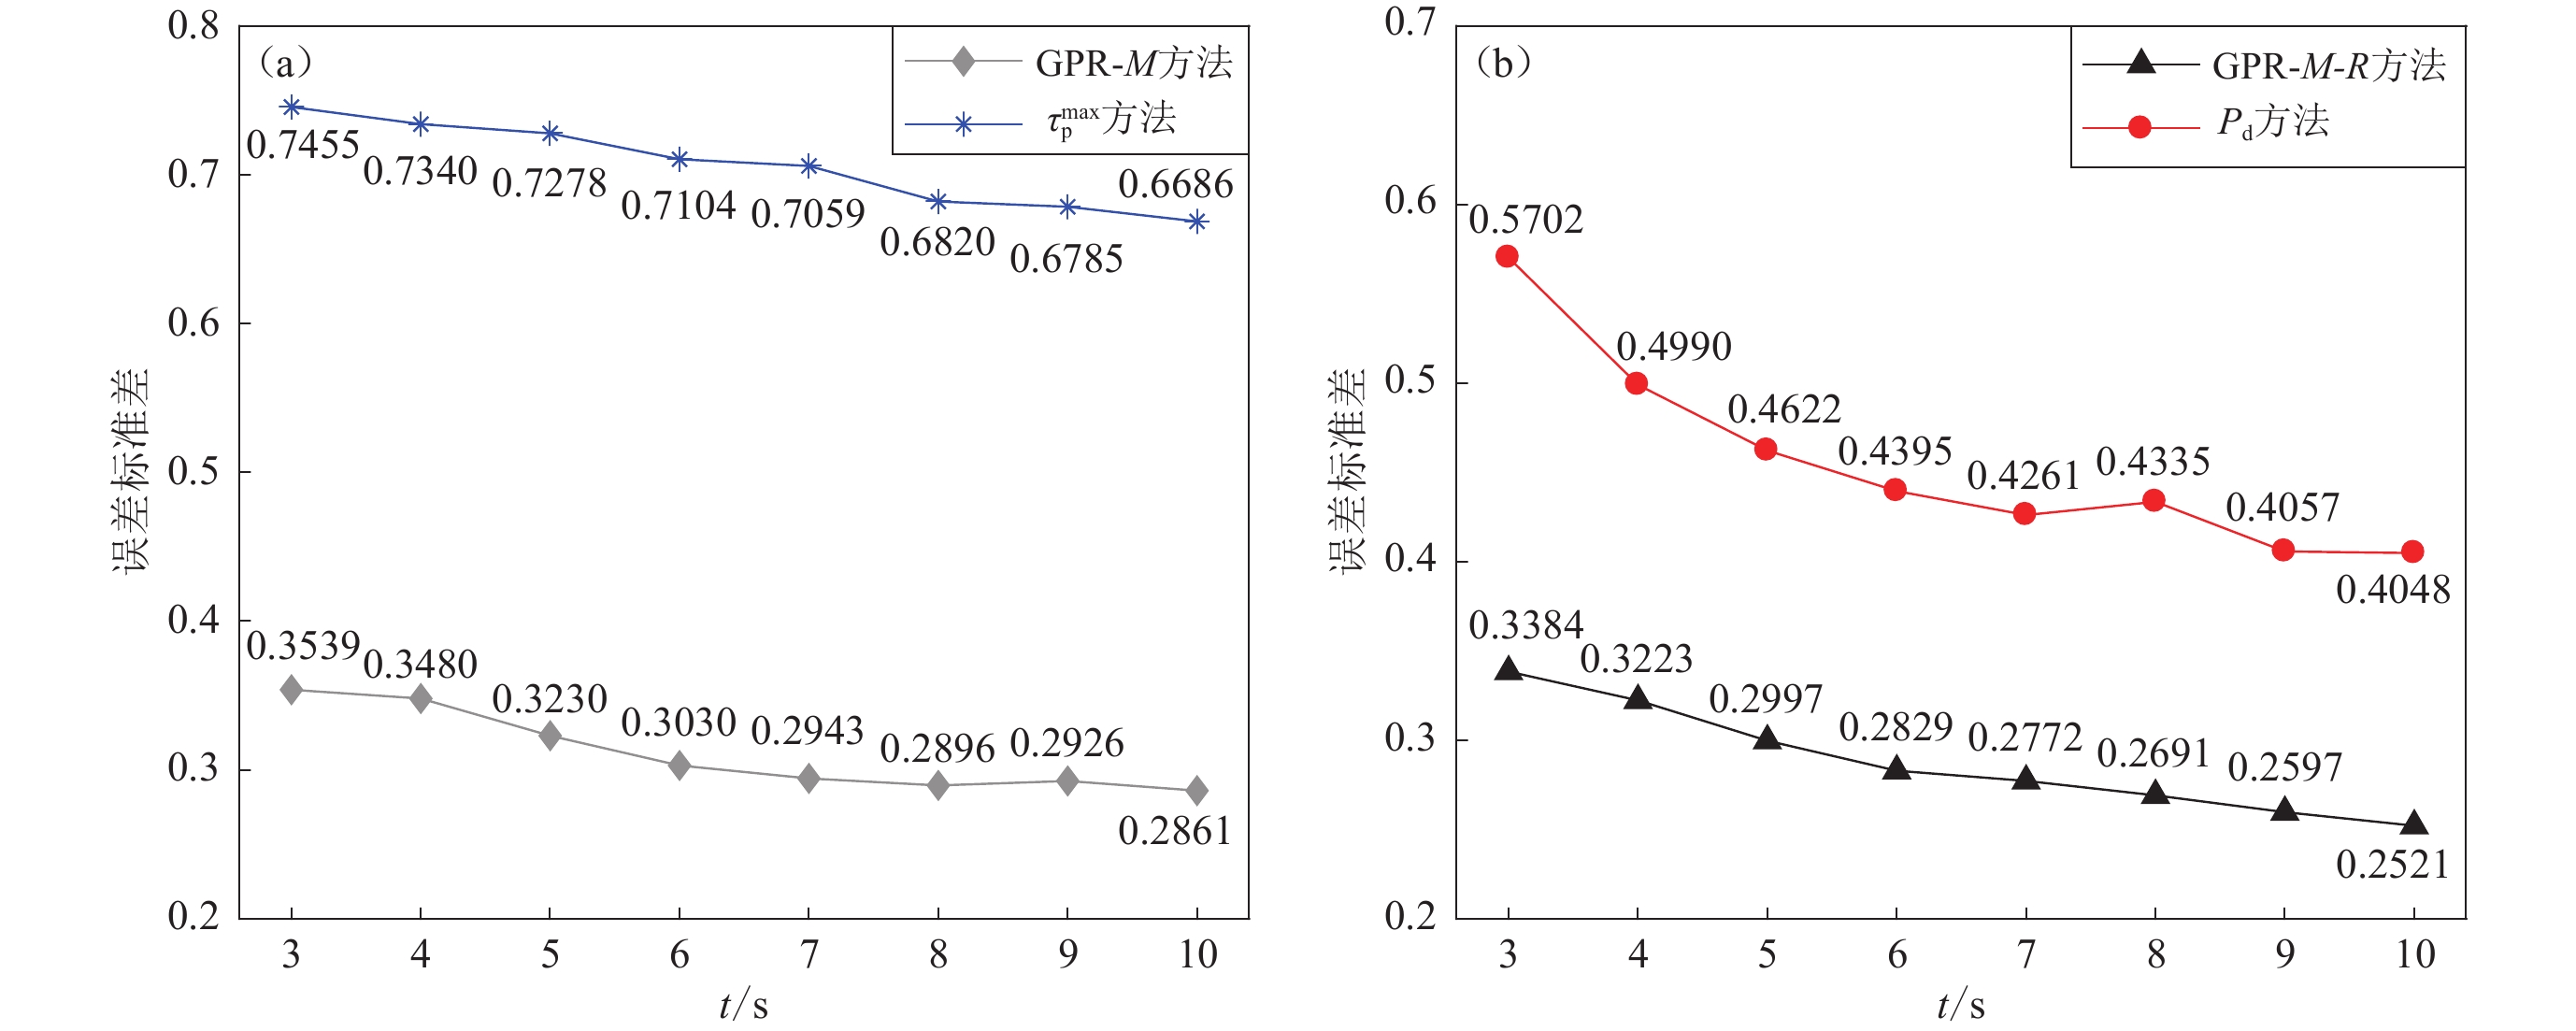
图 5 初至3—10 s地震波的不同方法估算震级的误差标准差对比
(a) GPR-M与$ {\tau ^{\max }_{\mathrm{p}}}$方法对比;(b) GPR-M与P d方法对比
Figure 5. Comparison of the standard deviation of errors in estimating magnitudes for initial 3−10 s seismic waves
(a) Comparison of GPR-M method with $ {\tau ^{\max }_{\mathrm{p}}}$ method ;(b) Comparison of GPR-M method with P d method
![]()
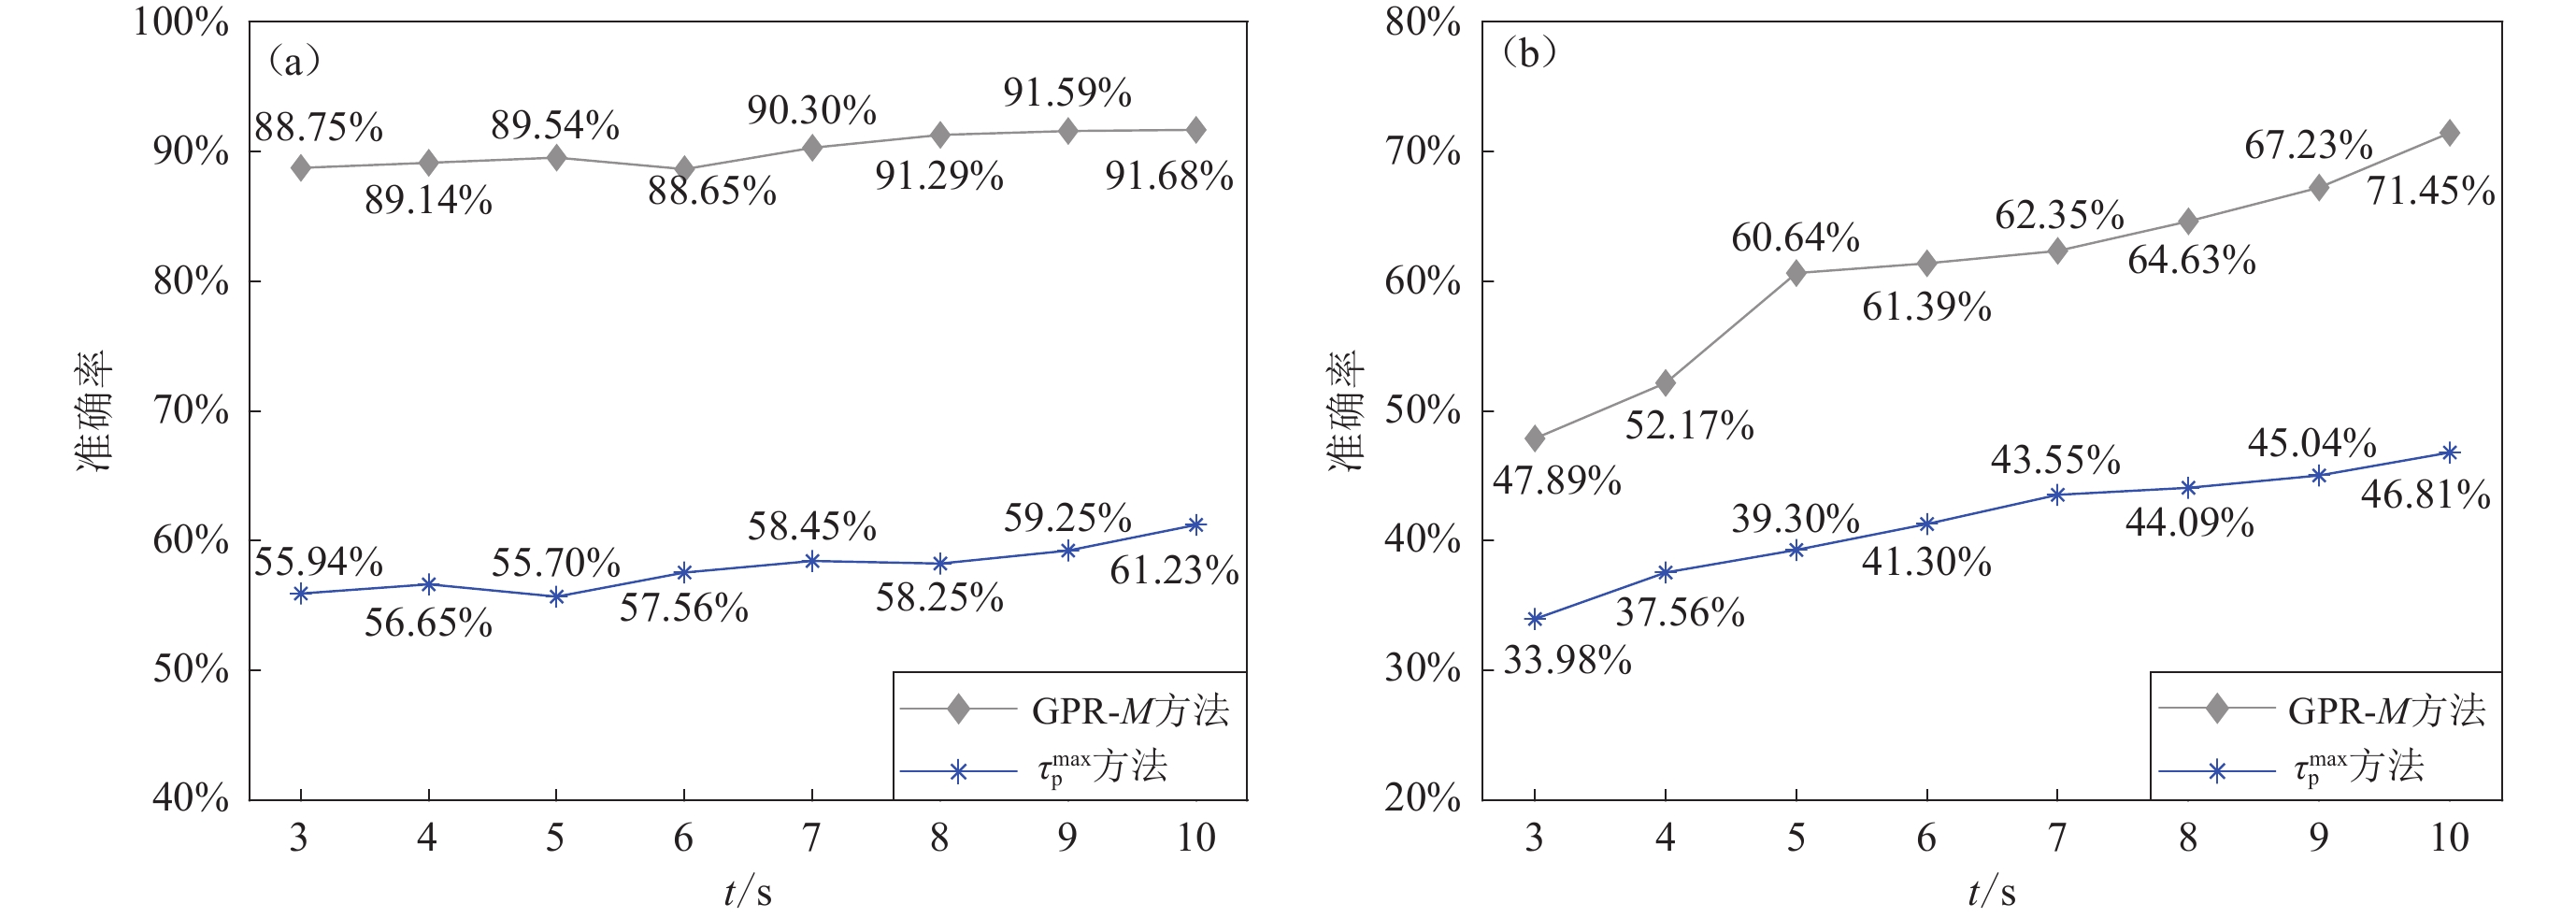
图 6 初至3—10 s地震波的GPR-M方法和$ {\tau ^{\max }_{\mathrm{p}}}$方法估算不同范围震级的准确率随时间变化趋势的对比
Figure 6. Comparison of the trends in estimation accuracy of different magnitude ranges based on the GPR-M and $ {\tau ^{\max }_{\mathrm{p}}}$ methods using initial 3−10 s seismic waves
(a) 4.0≤MW≤6.4;(b) 6.5≤MW≤9.0
![]()
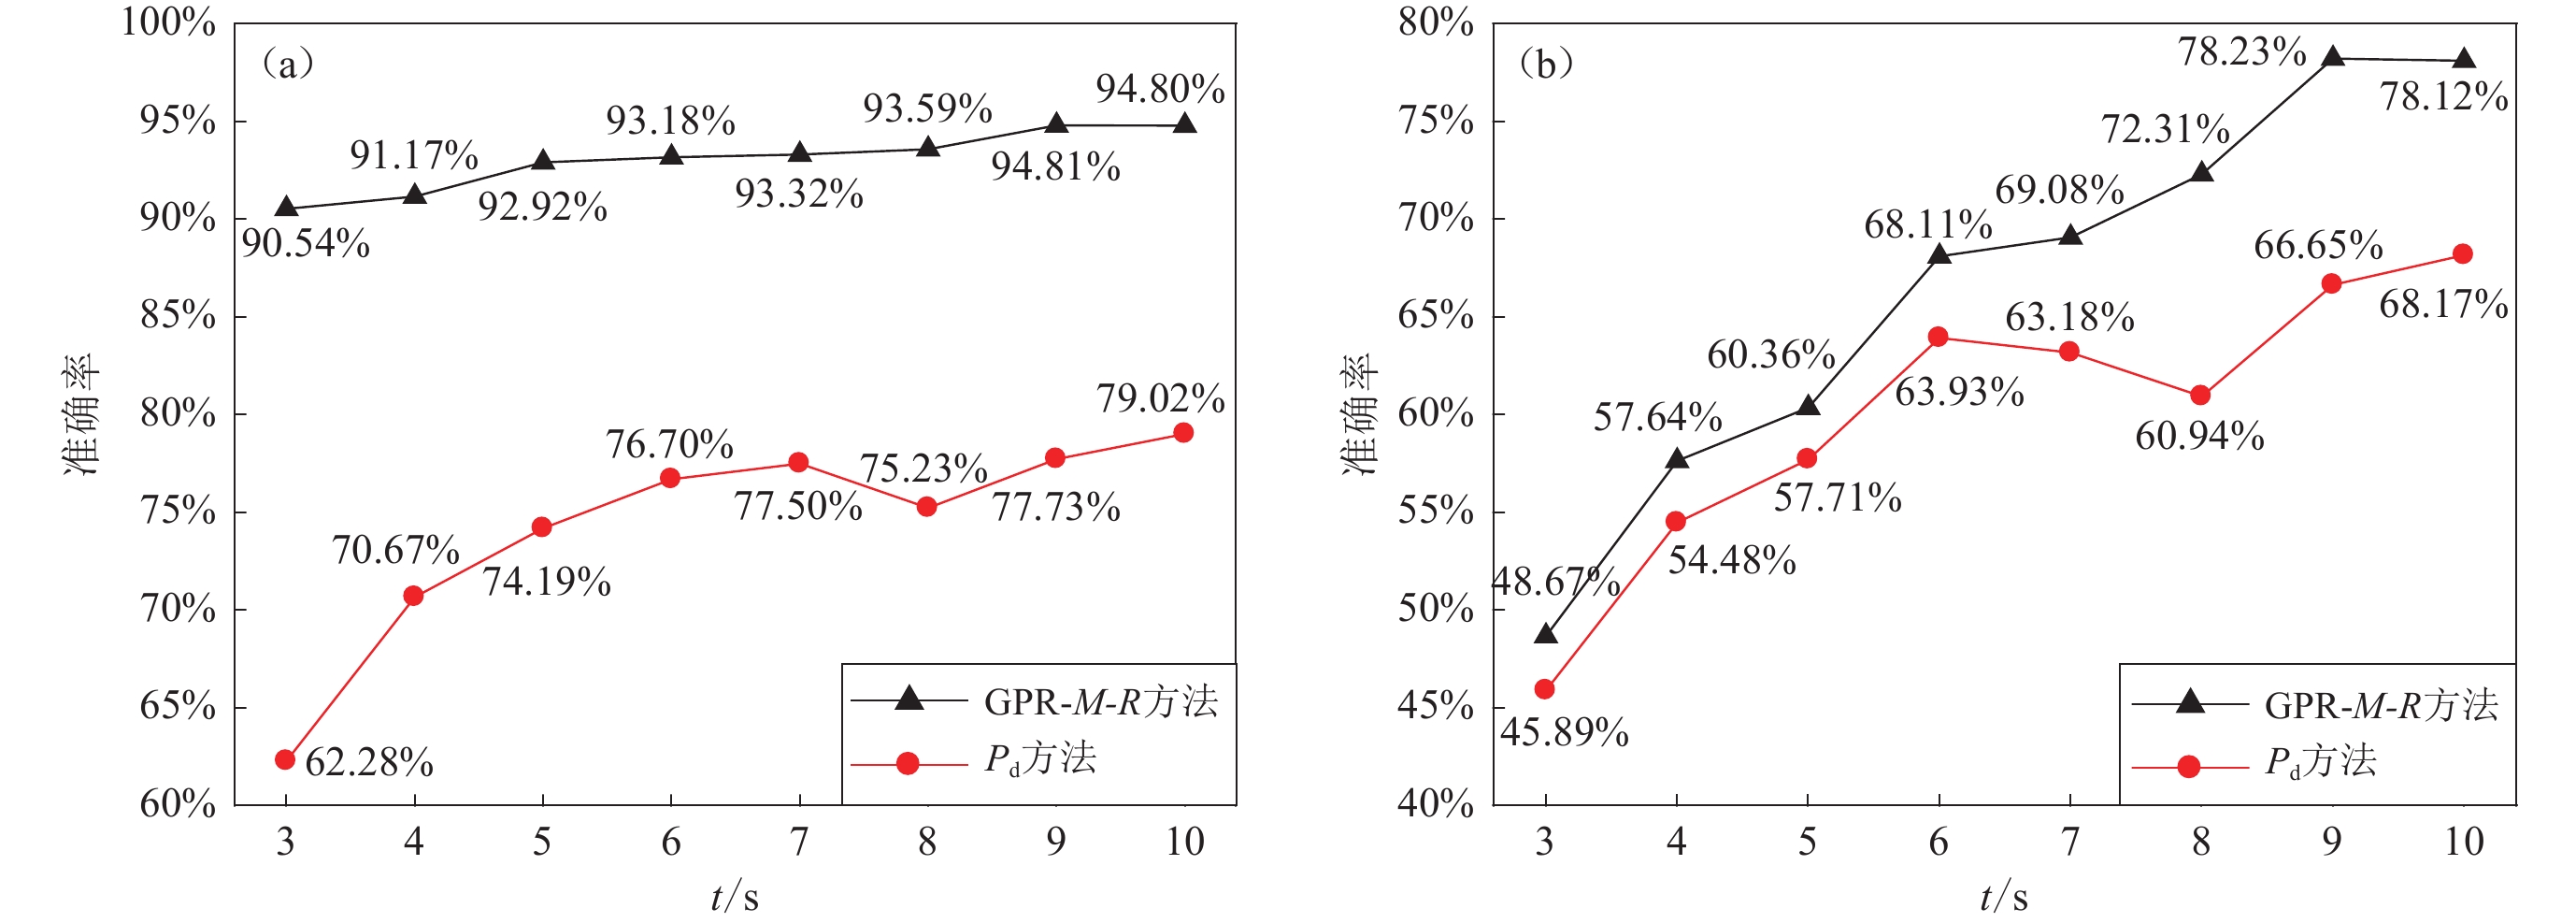
图 7 初至3—10 s地震波的GPR-M-R方法和P d方法估算不同范围震级的准确率随时间变化趋势的对比
Figure 7. Comparison of the trend of magnitude estimation accuracy change over time by the GPR-M-R and P d methods using initial 3−10 s seismic waves
(a) 4.0≤MW≤6.4;(b) 6.5≤MW≤9.0
![]()
图 8 P波到达后3 s,5 s,8 s,10 s GPR-M (a)和$ {\tau ^{\max }_{\mathrm{p}}}$ (b)方法估算泛化数据集震级的误差分布
Figure 8. Distributions of estimated magnitude errors in the generalized dataset using the GPR-M (a) and $ {\tau ^{\max }_{\mathrm{p}}}$ (b) at the P-wave first arrival times of 3 s,5 s,8 s,and 10 s
![]()
图 9 P波到达后3 s,5 s,8 s,10 s GPR-M-R (a)和P d (b)估算泛化数据集震级的误差分布
Figure 9. Distributions of estimating magnitude errors in the generalized dataset using the GPR-M (a) and P d (b) at the P-wave arrival times of 3 s,5 s,8 s,and 10 s
![]()
图 10 用于检验GPR震级估算效果所选取的我国三次地震的震中及所用台站分布
Figure 10. Distribution of epicenters and the stations used for testing the effectiveness of GPR magnitude estimation for three earthquakes in China
![]()
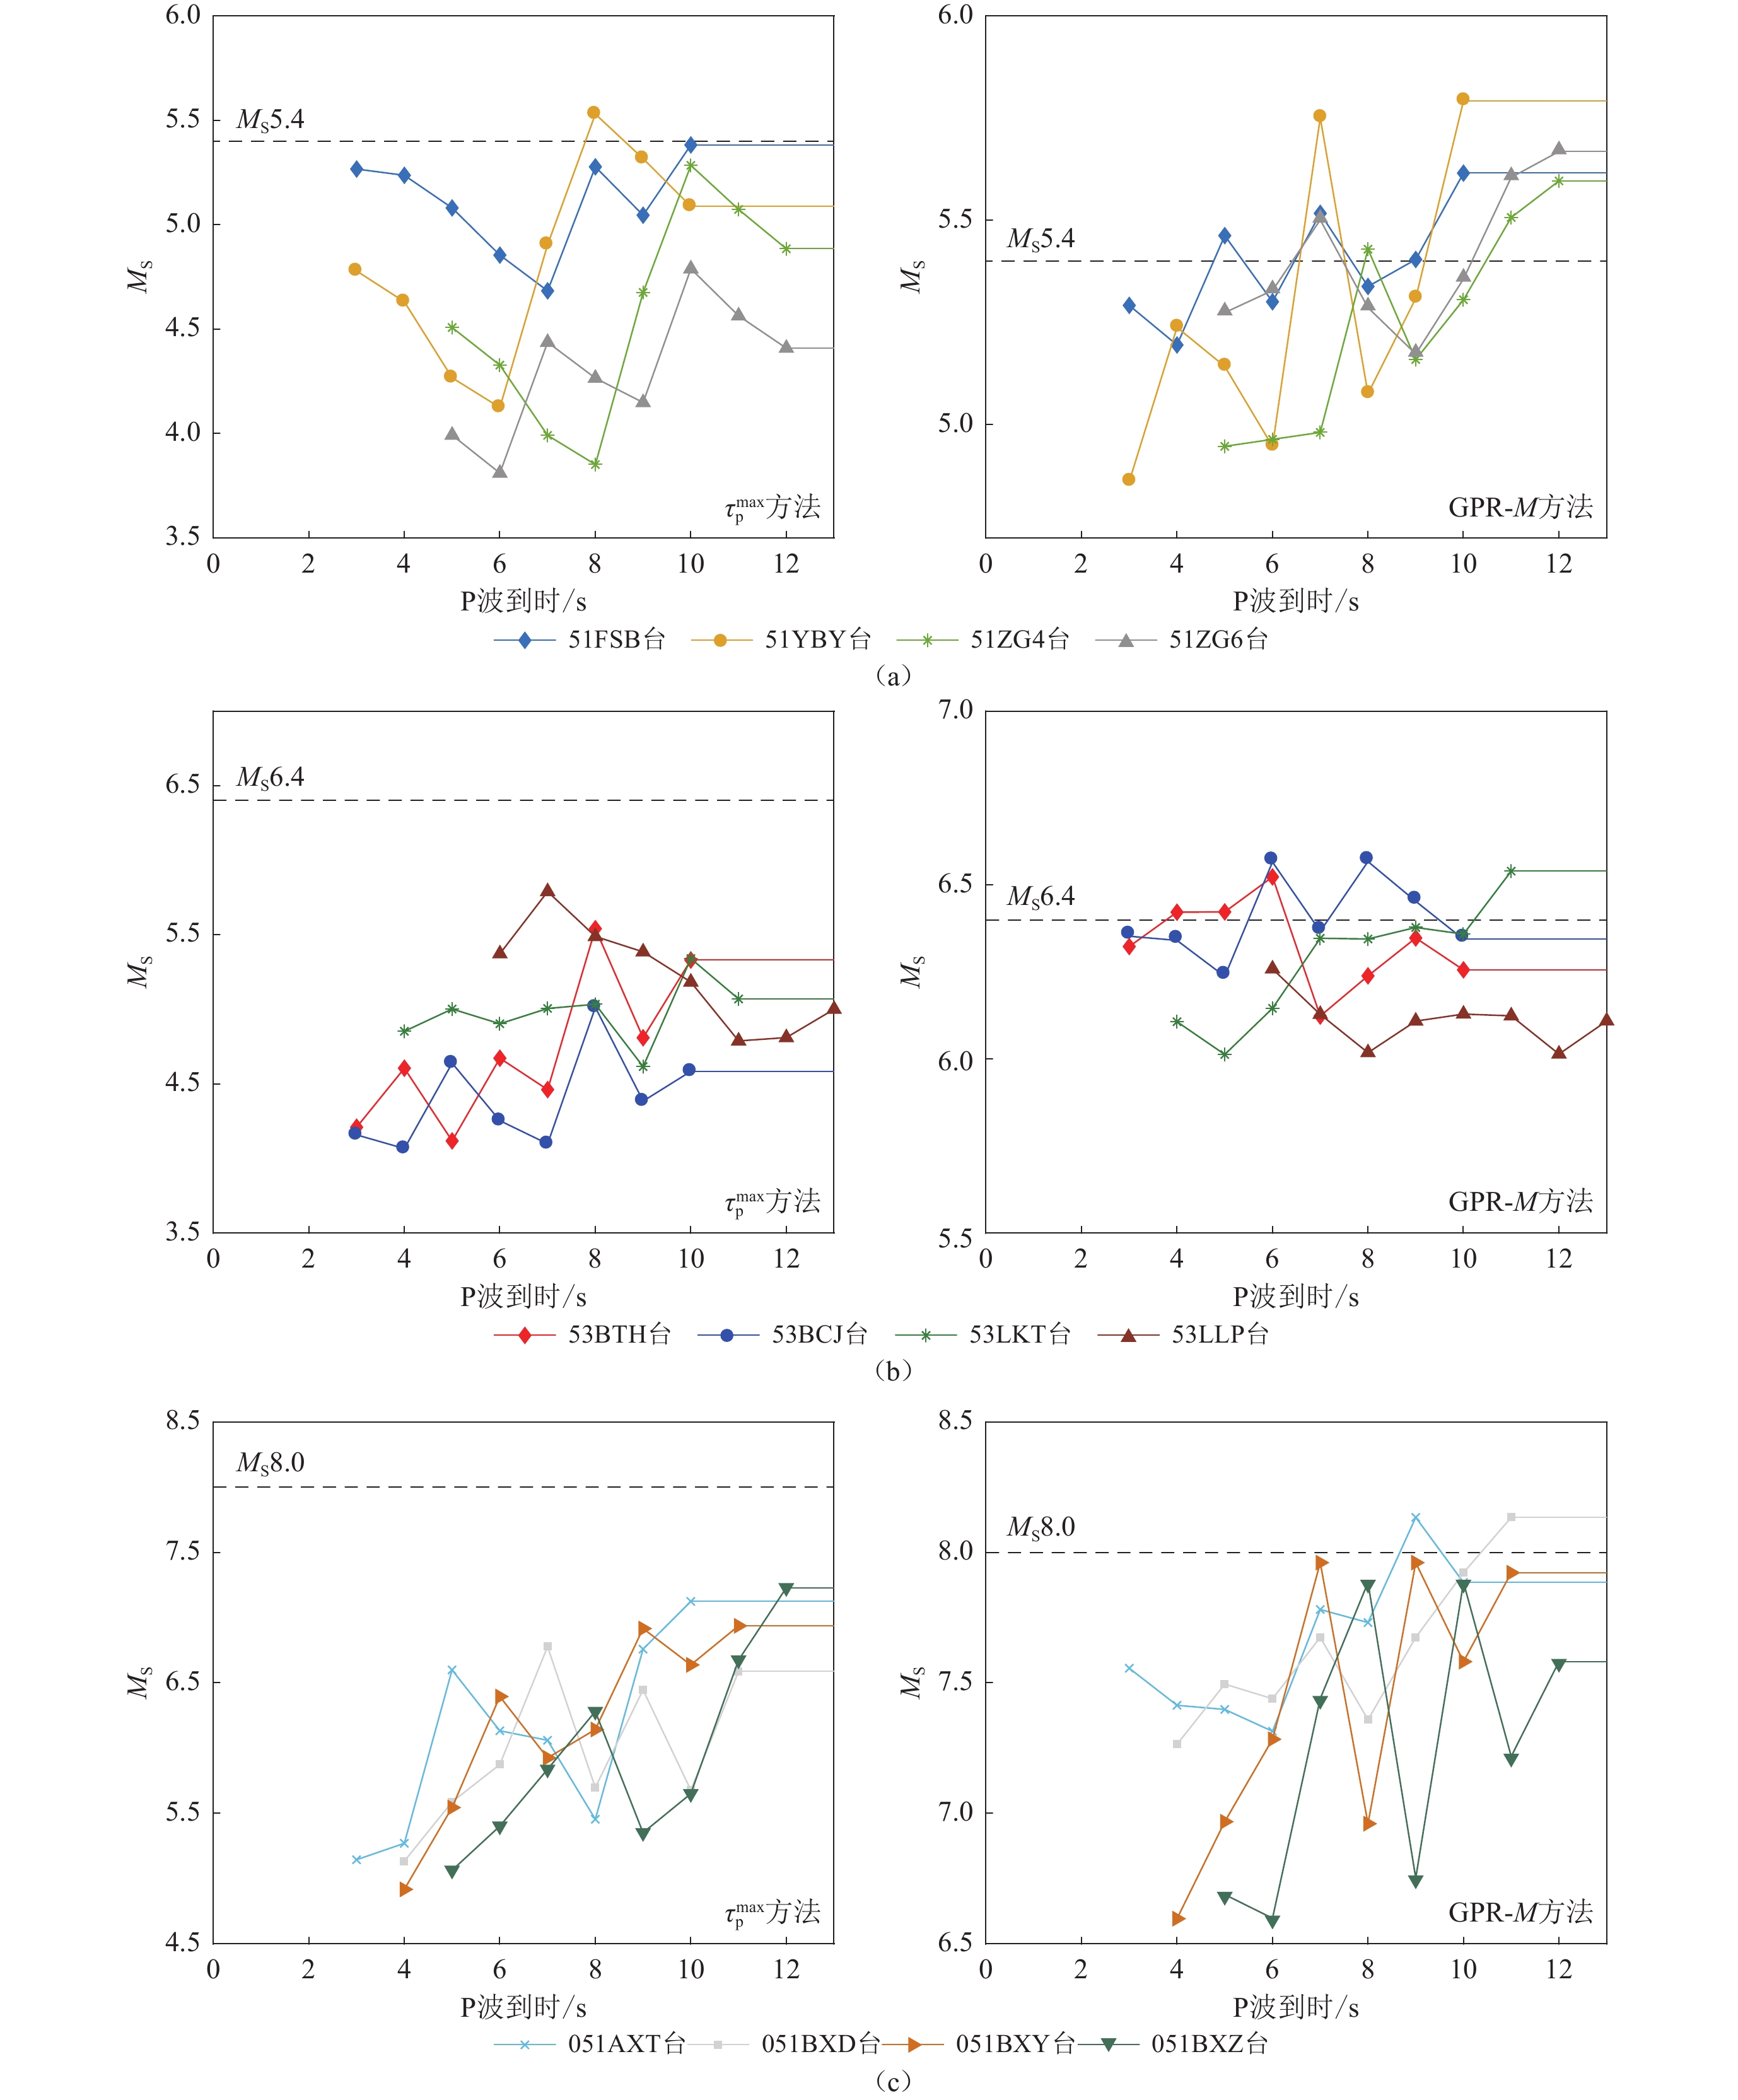
图 11 使用GPR-M方法(左)和$ {\tau ^{\max }_{\mathrm{p}}}$方法(右)持续估算我国2019年宜宾MS5.4 (a)、2021年漾濞MS6.4 (b)和2008年汶川MS8.0 (c)地震震级的结果
Figure 11. Results of continuous magnitude estimation for the 2019 Yibin MS5.4 (a),2021 Yangbi MS6.4 (b),and 2008 Wenchuan MS8.0 (c) earthquakes using the GPR-M-R (left panels) and $ {\tau ^{\max }_{\mathrm{p}}}$ (right panels) methods
![]()
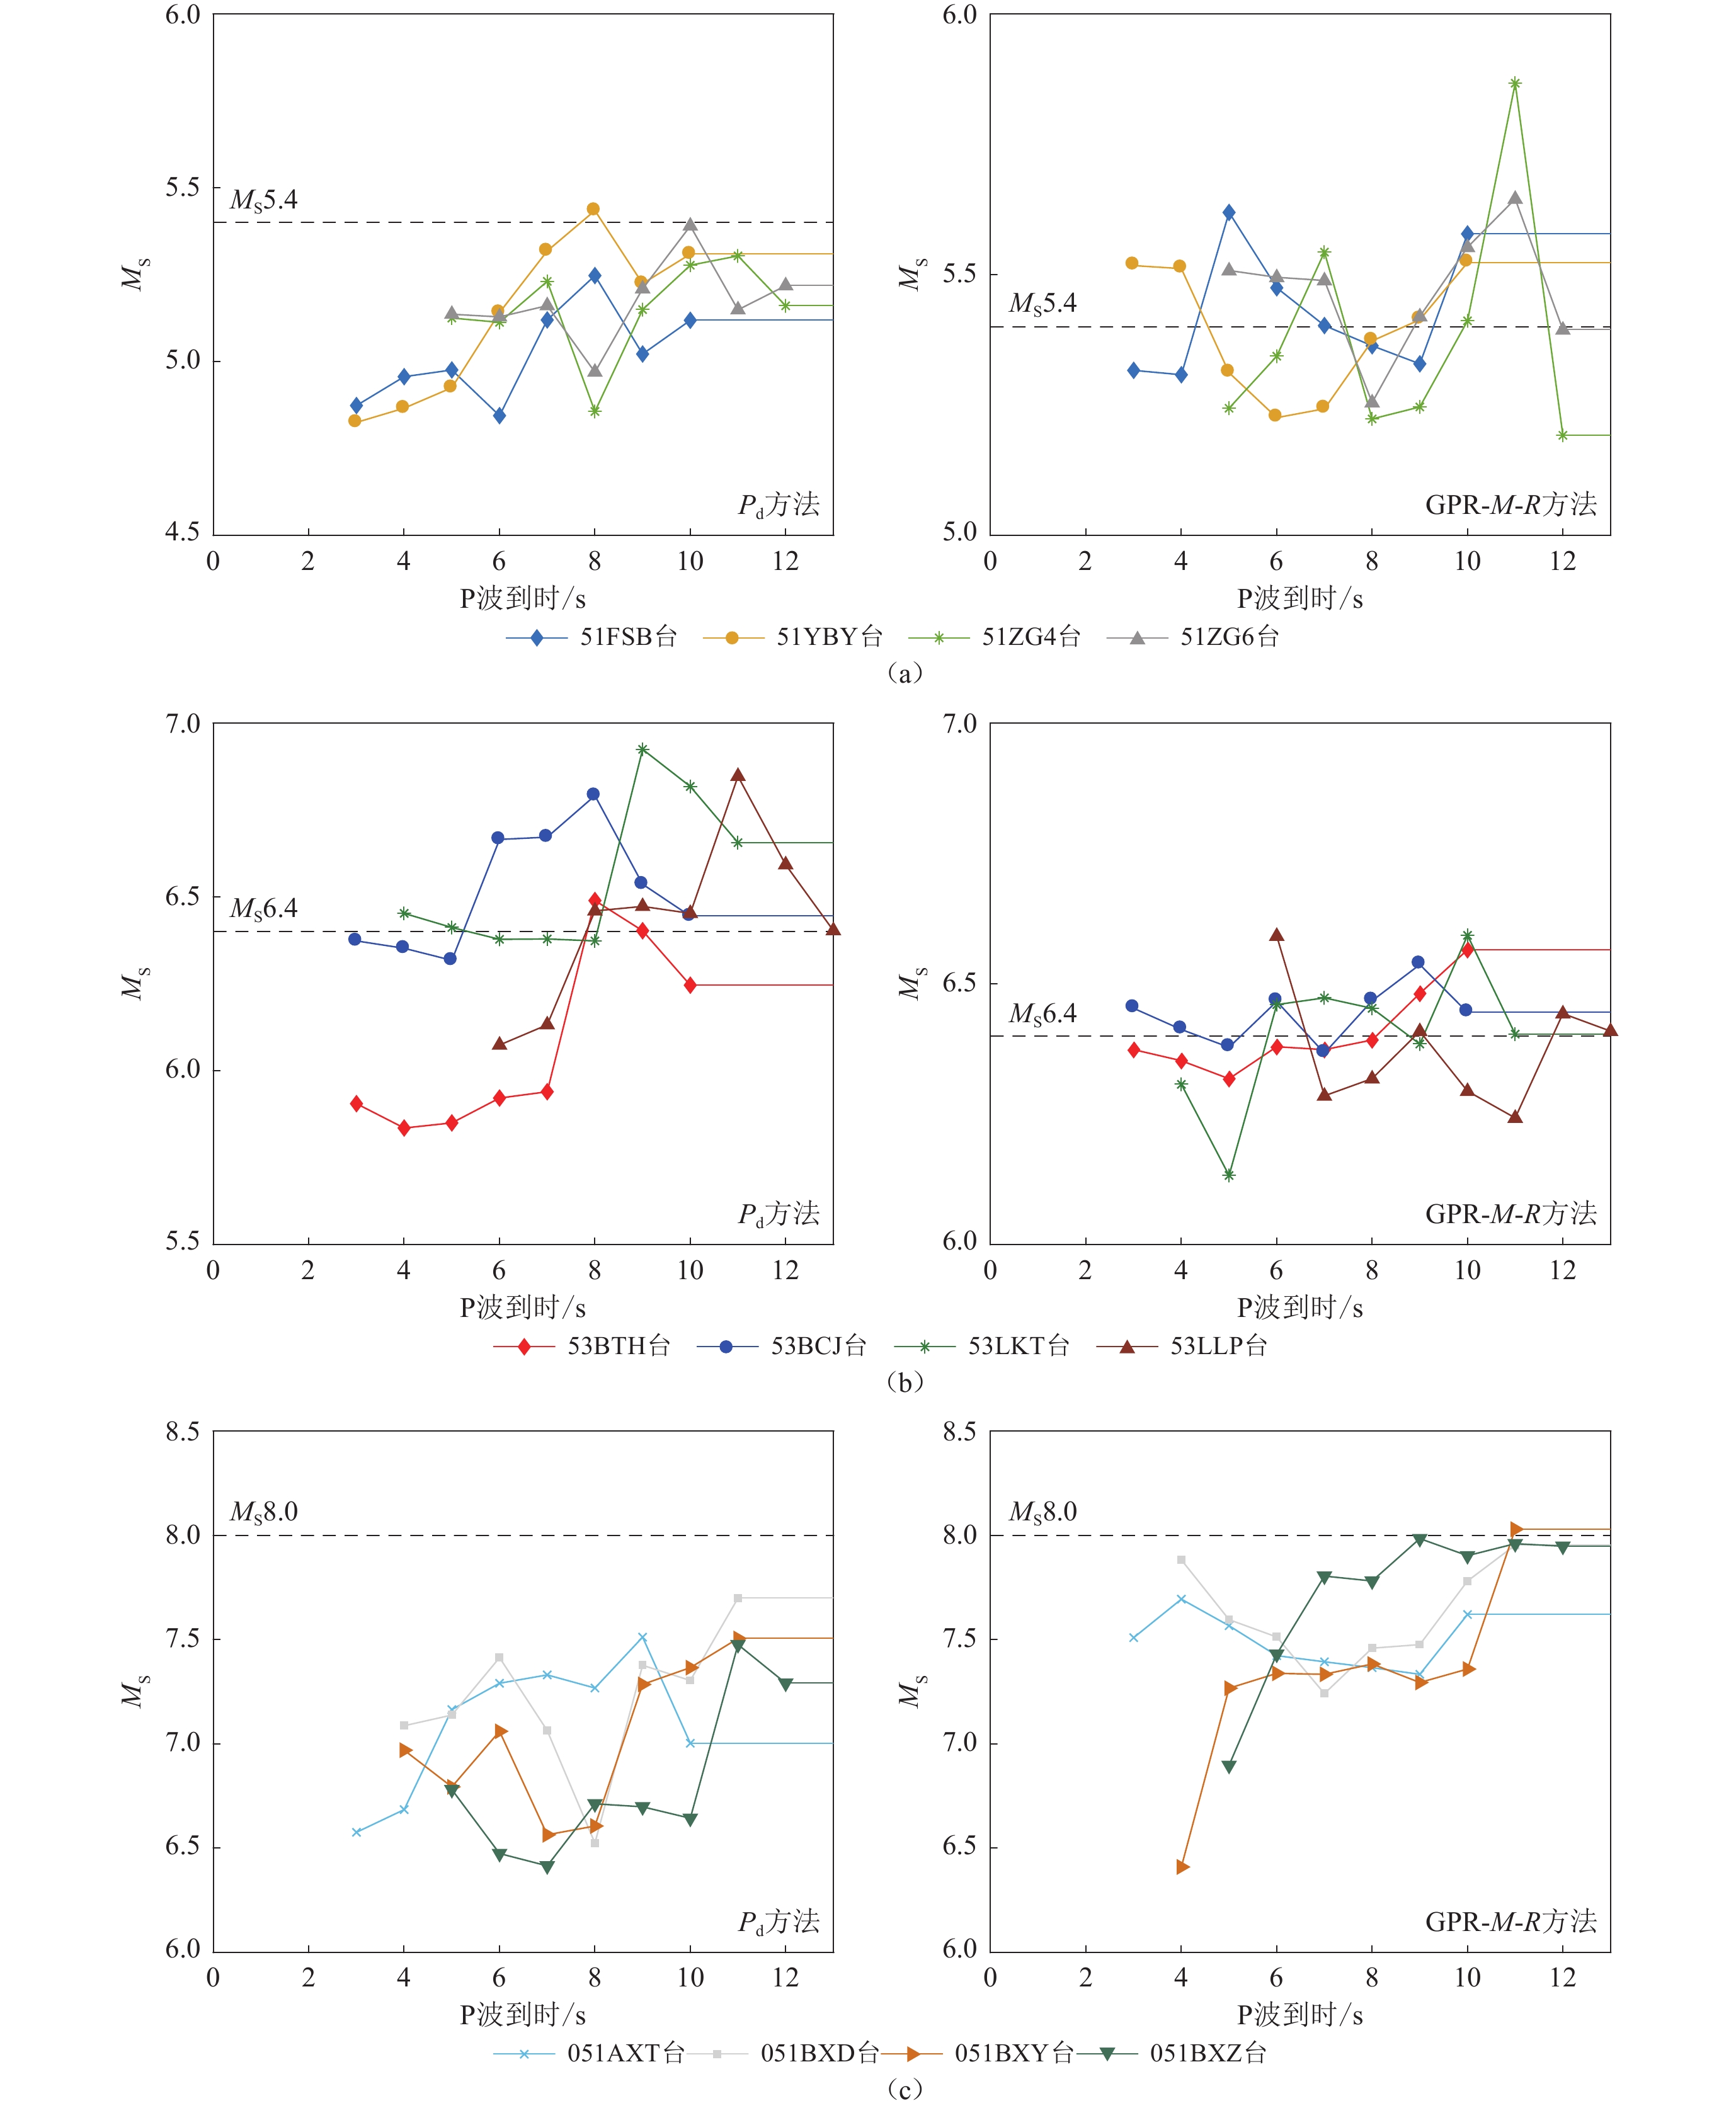
图 12 使用GPR-M-R (左)和P d (右)方法持续估算我国2019年宜宾MS5.4 (a)、2021年漾濞MS6.4 (b)和2008年汶川MS8.0 (c)地震震级的结果
Figure 12. Results of continuous magnitude estimation for the 2019 Yibin MS5.4 (a),2021 Yangbi MS6.4 (b),and 2008 Wenchuan MS8.0 (c) earthquakes using the GPR-M-R (left panels) and P d (right panels) methods
表 1 初至3—10 s地震波的Pd和$ {\tau ^{\max }_{\mathrm{p}}} $方法的拟合系数表
Table 1 Fitting coefficients for the Pd and $ {\tau ^{\max }_{\mathrm{p}}} $ methods based on the first 3−10 s seismic waves
初至地震波
窗长/s$P_{{\mathrm{d}}} $方法 $ {\tau ^{\max }_{\mathrm{p}}}$方法 a b c a b 3 0.639 4 −3.987 2 −0.840 7 0.309 6 −2.049 4 4 0.681 4 −3.910 9 −0.966 4 0.320 6 −2.048 3 5 0.708 0 −3.740 4 −1.104 4 0.329 8 −2.041 8 6 0.723 6 −3.518 2 −1.248 1 0.339 8 −2.016 5 7 0.738 2 −3.292 8 −1.378 0 0.348 6 −1.975 3 8 0.740 9 −3.070 7 −1.478 3 0.352 6 −1.955 5 9 0.737 8 −2.897 5 −1.538 8 0.358 3 −1.911 7 10 0.733 4 −2.791 4 −1.561 7 0.364 7 −1.875 0  下载: 导出CSV
-
郭凯,温瑞智,杨大克,彭克银. 2016. 地震预警系统的效能评估和社会效益分析[J]. 地震学报,38(1):146–154. doi: 10.11939/jass.2016.01.015 Guo K,Wen R Z,Yang D K,Peng K Y. 2016. Effectiveness evaluation and social benefits analyses on earthquake early warning system[J]. Acta Seismologica Sinica,38(1):146–154 (in Chinese).
何志昆,刘光斌,赵曦晶,王明昊. 2013. 高斯过程回归方法综述[J]. 控制与决策,28(8):1121–1129. He Z K,Liu G B,Zhao X J,Wang M H. 2013. Overview of Gaussian process regression[J]. Control and Decision,28(8):1121–1129 (in Chinese).
金星,张红才,李军,韦永祥,马强. 2012. 地震预警震级确定方法研究[J]. 地震学报,34(5):593–610. doi: 10.3969/j.issn.0253-3782.2012.05.002 Jin X,Zhang H C,Li J,Wei Y X,Ma Q. 2012. Research on earthquake early warning magnitude estimate[J]. Acta Seismologica Sinica,34(5):593–610 (in Chinese).
林彬华,金星,康兰池,韦永祥,李军,张燕明,陈惠芳,周施文. 2021. 基于卷积神经网络的地震震级测定研究[J]. 地球物理学报,64(10):3600–3611. doi: 10.6038/cjg2021O0370 Lin B H,Jin X,Kang L C,Wei Y X,Li J,Zhang Y M,Chen H F,Zhou S W. 2021. The research of earthquake magnitude determination based on convolutional neural networks[J]. Chinese Journal of Geophysics,64(10):3600–3611 (in Chinese).
马美帅,王延伟,汪祚赚,赵庆旭,潘代洪. 2022. 基于累积绝对位移值的震级估算方法[J]. 自然灾害学报,31(2):93–101. Ma M S,Wang Y W,Wang Z Z,Zhao Q X,Pan D H. 2022. Magnitude estimation based on the cumulative absolute displacement[J]. Journal of Natural Disasters,31(2):93–101 (in Chinese).
孙斌,姚海涛,刘婷. 2012. 基于高斯过程回归的短期风速预测[J]. 中国电机工程学报,32(29):104–109. Sun B,Yao H T,Liu T. 2012. Short-term wind speed forecasting based on Gaussian process regression model[J]. Proceedings of the CSEE,32(29):104–109 (in Chinese).
王延伟,李小军,曹振中,兰景岩,刘娟. 2020. 基于KiK-net井下基岩强震动记录的持续地震预警震级估算方法[J]. 地震工程与工程振动,40(4):42–52. Wang Y W,Li X J,Cao Z Z,Lan J Y,Liu J. 2020. Continuous estimation magnitude for earthquake early warning based on KiK-net borehole bedrock strong motions[J]. Earthquake Engineering and Engineering Dynamics,40(4):42–52 (in Chinese).
位栋梁,王延伟,王自法,廖吉安,赵登科. 2022. 基于卷积神经网络的地震震级快速估算方法[J]. 地震学报,44(2):316–326. doi: 10.11939/jass.20210198 Wei D L,Wang Y W,Wang Z F,Liao J A,Zhao D K. 2022. A fast estimation method of earthquake magnitude based on convolutional neural networks[J]. Acta Seismologica Sinica,44(2):316–326 (in Chinese).
杨黎薇,林国良,邱志刚,江汶乡,王玉石. 2018. 基于人工神经元网络和多特征参数的预警震级估算[J]. 地震研究,41(2):302–310. doi: 10.3969/j.issn.1000-0666.2018.02.019 Yang L W,Lin G L,Qiu Z G,Jiang W X,Wang Y S. 2018. Study on magnitude estimation of earthquake early warning based on various characteristic parameters and artificial neural networks[J]. Journal of Seismological Research,41(2):302–310 (in Chinese).
朱景宝,宋晋东,李山有. 2021. 基于支持向量机的地震预警震级快速估算研究[J]. 振动与冲击,40(7):126–134. Zhu J B,Song J D,Li S Y. 2021. Rapid magnitude estimation for earthquake early warning based on SVM[J]. Journal of Vibration and Shock,40(7):126–134 (in Chinese).
Alcik H,Ozel O,Apaydin N,Erdik M. 2009. A study on warning algorithms for Istanbul earthquake early warning system[J]. Geophys Res Lett,36(5):L00B05.
Allen R M,Kanamori H. 2003. The potential for earthquake early warning in southern California[J]. Science,300(5620):786–789. doi: 10.1126/science.1080912
Böse M,Heaton T,Hauksson E. 2012. Rapid estimation of earthquake source and ground-motion parameters for earthquake early warning using data from a single three-component broadband or strong-motion sensor[J]. Bull Seismol Soc Am,102(2):738–750. doi: 10.1785/0120110152
Cheng M H,Wu S,Heaton T H,Beck J L. 2014. Earthquake early warning application to buildings[J]. Eng Struct,60:155–164. doi: 10.1016/j.engstruct.2013.12.033
Chung A I,Henson I,Allen R M. 2019. Optimizing earthquake early warning performance:ElarmS-3[J]. Seismol Res Lett,90(2A):727–743. doi: 10.1785/0220180192
Cua G,Fischer M,Heaton T,Wiemer S. 2009. Real-time performance of the virtual seismologist earthquake early warning algorithm in southern California[J]. Seismol Res Lett,80(5):740–747. doi: 10.1785/gssrl.80.5.740
Cuéllar A,Suárez G,Espinosa-Aranda J M. 2018. A fast earthquake early warning algorithm based on the first 3 s of the P-wave coda[J]. Bull Seismol Soc Am,108(4):2068–2079. doi: 10.1785/0120180079
Festa G,Zollo A,Lancieri M. 2008. Earthquake magnitude estimation from early radiated energy[J]. Geophys Res Lett,35(22):L22307.
Hsiao N C,Wu Y M,Shin T C,Zhao L,Teng T L. 2009. Development of earthquake early warning system in Taiwan[J]. Geophys Res Lett,36(5):L00B02.
Hsiao N C,Wu Y M,Zhao L,Chen D Y,Huang W T,Kuo K H,Shin T C,Leu P L. 2011. A new prototype system for earthquake early warning in Taiwan[J]. Soil Dyn Earthq Eng,31(2):201–208. doi: 10.1016/j.soildyn.2010.01.008
Hsu T Y,Huang S K,Chang Y W,Kuo C H,Lin C M,Chang T M,Wen K L,Loh C H. 2013. Rapid on-site peak ground acceleration estimation based on support vector regression and P-wave features in Taiwan[J]. Soil Dyn Earthq Eng,49:210–217. doi: 10.1016/j.soildyn.2013.03.001
Hua T,Li Q Y,Dai K R,Zhang X J,Zhang H. 2023. Image denoisingvia neighborhood-based multidimensional Gaussian process regression[J]. Signal Image Video P, 17 (2):389-397.
Ide S. 2019. Frequent observations of identical onsets of large and small earthquakes[J]. Nature,573(7772):112–116. doi: 10.1038/s41586-019-1508-5
Kamigaichi O,Saito M,Doi K,Matsumori T,Tsukada S,Takeda K,Shimoyama T,Nakamura K,Kiyomoto M,Watanabe Y. 2009. Earthquake early warning in Japan:Warning the general public and future prospects[J]. Seismol Res Lett,80(5):717–726. doi: 10.1785/gssrl.80.5.717
Kanamori H. 2005. Real-time seismology and earthquake damage mitigation[J]. Annu Rev Earth Planet Sci,33(1):195–214. doi: 10.1146/annurev.earth.33.092203.122626
Kohler M D,Smith D E,Andrews J,Chung A I,Hartog R,Henson I,Given D D,De Groot R,Guiwits S. 2020. Earthquake early warning ShakeAlert 2.0:Public rollout[J]. Seismol Res Lett,91(3):1763–1775. doi: 10.1785/0220190245
Leyton F,Ruiz S,Baez J C,Meneses G,Madariaga R. 2018. How fast can we reliably estimate the magnitude of subduction earthquakes?[J]. Geophys Res Lett,45(18):9633–9641. doi: 10.1029/2018GL078991
Li Z F,Meier M A,Hauksson E,Zhan Z W,Andrews J. 2018. Machine learning seismic wave discrimination:Application to earthquake early warning[J]. Geophys Res Lett,45(10):4773–4779. doi: 10.1029/2018GL077870
Mousavi S M,Beroza G C. 2020. A machine-learning approach for earthquake magnitude estimation[J]. Geophys Res Lett,47(1):e2019GL085976. doi: 10.1029/2019GL085976
Nakamura Y. 1988. On the urgent earthquake detection and alarm system (UrEDAS)[C]//Proceedings of 9th World Conference on Earthquake Engineering. Tokyo:International Association for Earthquake Engineering:673−678.
Nazeri S,Shomali Z H,Colombelli S,Elia L,Zollo A. 2017. Magnitude estimation based on integrated amplitude and frequency content of the initial P wave in earthquake early warning applied to Tehran,Iran[J]. Bull Seismol Soc Am,107(3):1432–1438. doi: 10.1785/0120160380
Nguyen-Tuong D,Peters J,Seeger M. 2008. Local Gaussian process regression for real time online model learning and control[C]//Proceedings of the 21st International Conference on Neural Information Processing Systems. Vancouver,Canada:Curran Associates Inc:1193−1200.
Olson E L,Allen R M. 2005. The deterministic nature of earthquake rupture[J]. Nature,438(7065):212–215. doi: 10.1038/nature04214
Park C,Huang J Z,Ding Y. 2011. Domain decomposition approach for fast Gaussian process regression of large spatial data sets[J]. J Mach Learn Res,12:1697–1728.
Peng C Y,Yang J S,Zheng Y,Zhu X Y,Xu Z Q,Chen Y. 2017. New τc regression relationship derived from all P wave time windows for rapid magnitude estimation[J]. Geophys Res Lett,44(4):1724–1731. doi: 10.1002/2016GL071672
Perol T,Gharbi M,Denolle M. 2018. Convolutional neural network for earthquake detection and location[J]. Sci Adv,4(2):e1700578. doi: 10.1126/sciadv.1700578
Rasmussen C E,Williams C K I. 2006. Gaussian Processes for Machine Learning[M]. Cambridge:MIT Press:7−32.
Rohani A,Taki M,Abdollahpour M. 2018. A novel soft computing model (Gaussian process regression with K-fold cross validation) for daily and monthly solar radiation forecasting (Part:I)[J]. Renew Energy,115:411–422. doi: 10.1016/j.renene.2017.08.061
Seeger M. 2004. Gaussian processes for machine learning[J]. Int J Neural Syst,14(2):69–106. doi: 10.1142/S0129065704001899
Shieh J T,Wu Y M,Allen R M. 2008. A comparison of τc and τpmax for magnitude estimation in earthquake early warning[J]. Geophys Res Lett,35(20):L20301.
Wang Y W,Li X J,Wang Z F,Shi J P,Bao E H. 2021. Deep learning for P-wave arrival picking in earthquake early warning[J]. Earthq Eng Eng Vib,20(2):391–402. doi: 10.1007/s11803-021-2027-6
Wang Y W,Li X J,Li L,Wang Z F,Lan J Y. 2022. New magnitude proxy for earthquake early warning based on initial time series and frequency[J]. Seismol Res Lett,93(1):216–225. doi: 10.1785/0220210106
Wang Y W,Li X J,Wang Z F,Liu J. 2023. Deep learning for magnitude prediction in earthquake early warning[J]. Gondwana Res,123:164–173. doi: 10.1016/j.gr.2022.06.009
Wu Y M. 2002. A virtual subnetwork approach to earthquake early warning[J]. Bull Seismol Soc Am,92(5):2008–2018. doi: 10.1785/0120010217
Wu Y M,Kanamori H. 2005. Rapid assessment of damage potential of earthquakes in Taiwan from the beginning of P waves[J]. Bull Seismol Soc Am,95(3):1181–1185. doi: 10.1785/0120040193
Wu Y M,Zhao L. 2006. Magnitude estimation using the first three seconds P-wave amplitude in earthquake early warning[J]. Geophys Res Lett,33(16):L16312.
Zhang H C,Jin X,Wei Y X,Li J,Kang L C,Wang S C,Huang L Z,Yu P Q. 2016. An earthquake early warning system in Fujian,China[J]. Bull Seismol Soc Am,106(2):755–765. doi: 10.1785/0120150143
Ziv A. 2014. New frequency-based real-time magnitude proxy for earthquake early warning[J]. Geophys Res Lett,41(20):7035–7040. doi: 10.1002/2014GL061564
Zollo A,Lancieri M,Nielsen S. 2006. Earthquake magnitude estimation from peak amplitudes of very early seismic signals on strong motion records[J]. Geophys Res Lett,33(23):L23312.
Zollo A,Iannaccone G,Lancieri M,Cantore L,Convertito V,Emolo A,Festa G,lovič F,Vassallo M,Martino C,Satriano C,Gasparini P. 2009. Earthquake early warning system in southern Italy:Methodologies and performance evaluation[J]. Geophys Res Lett,36(5):L00B07.


计量
- 文章访问数: 200
- HTML全文浏览量: 34
- PDF下载量: 66
