

Relocation of the aftershock sequence of Milin MS6.9 earthquake in 2007 and spatio-temporal variation characteristics of b-value
-
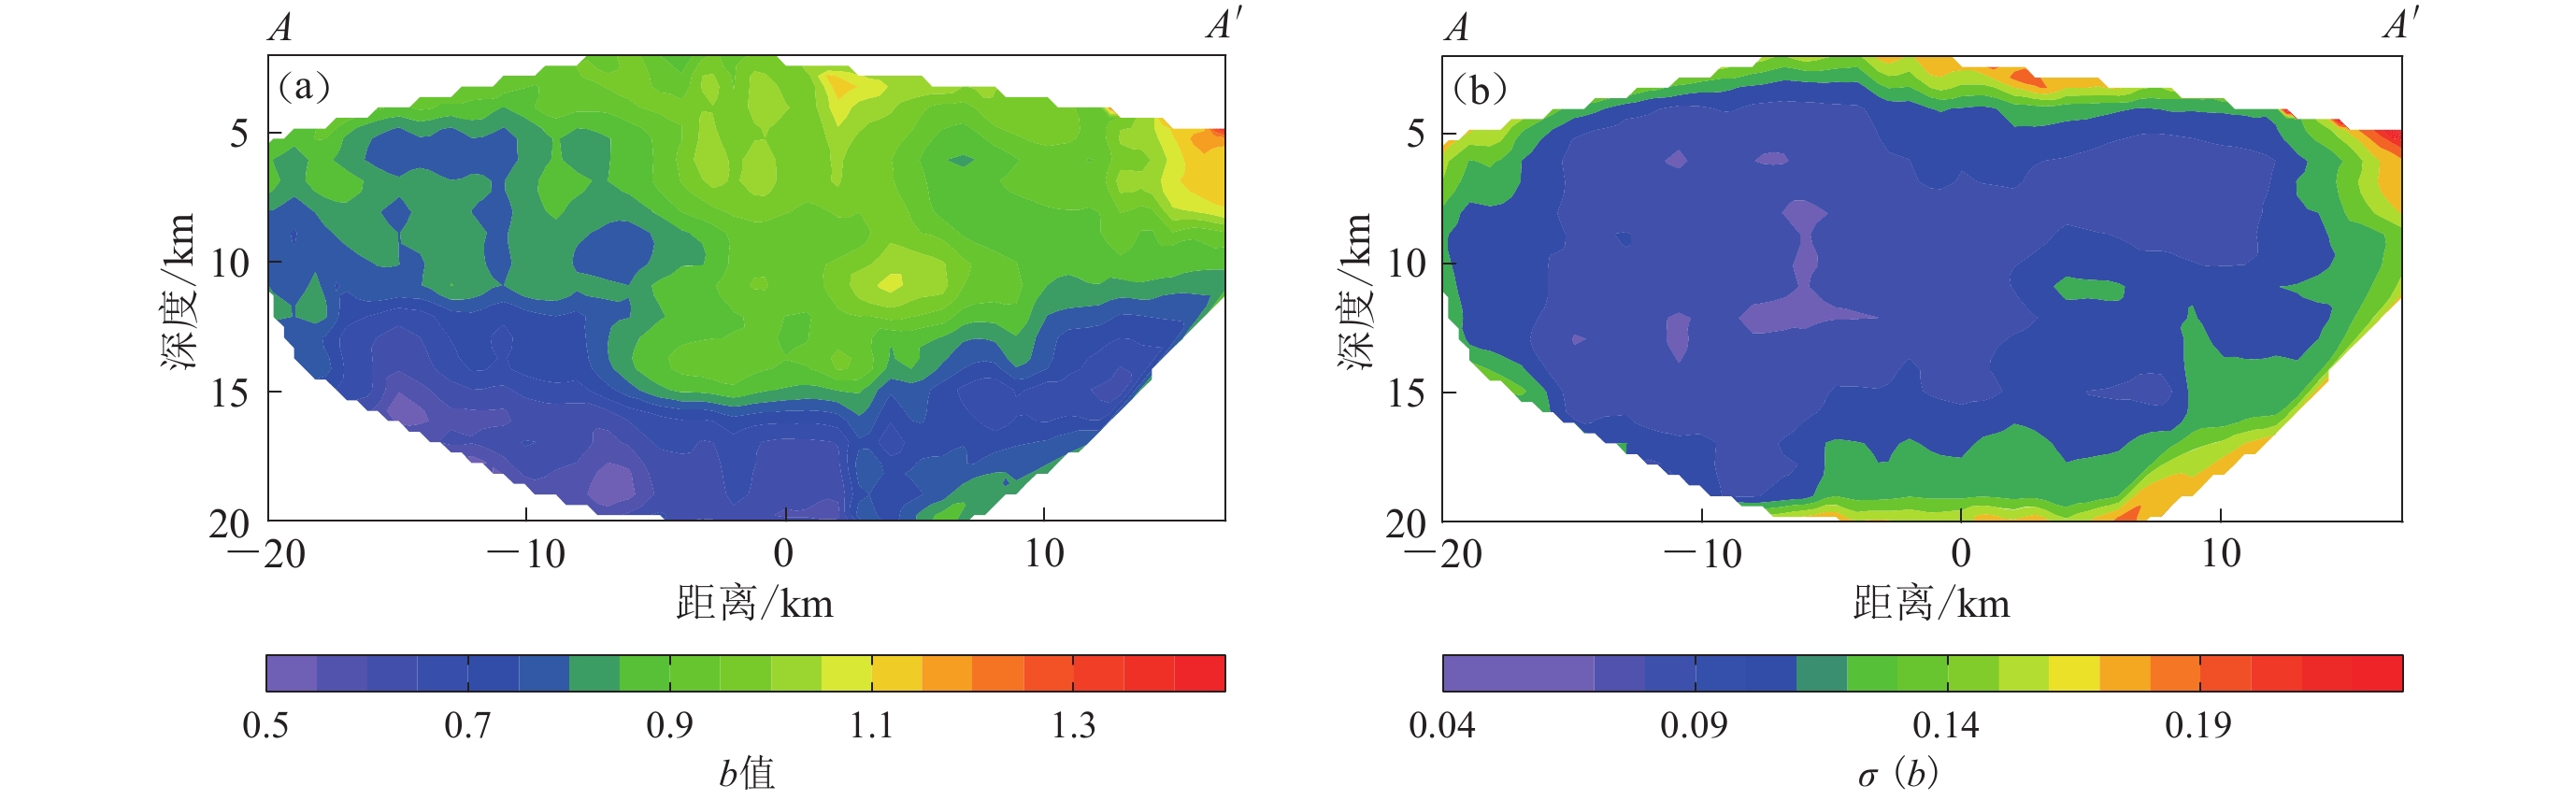
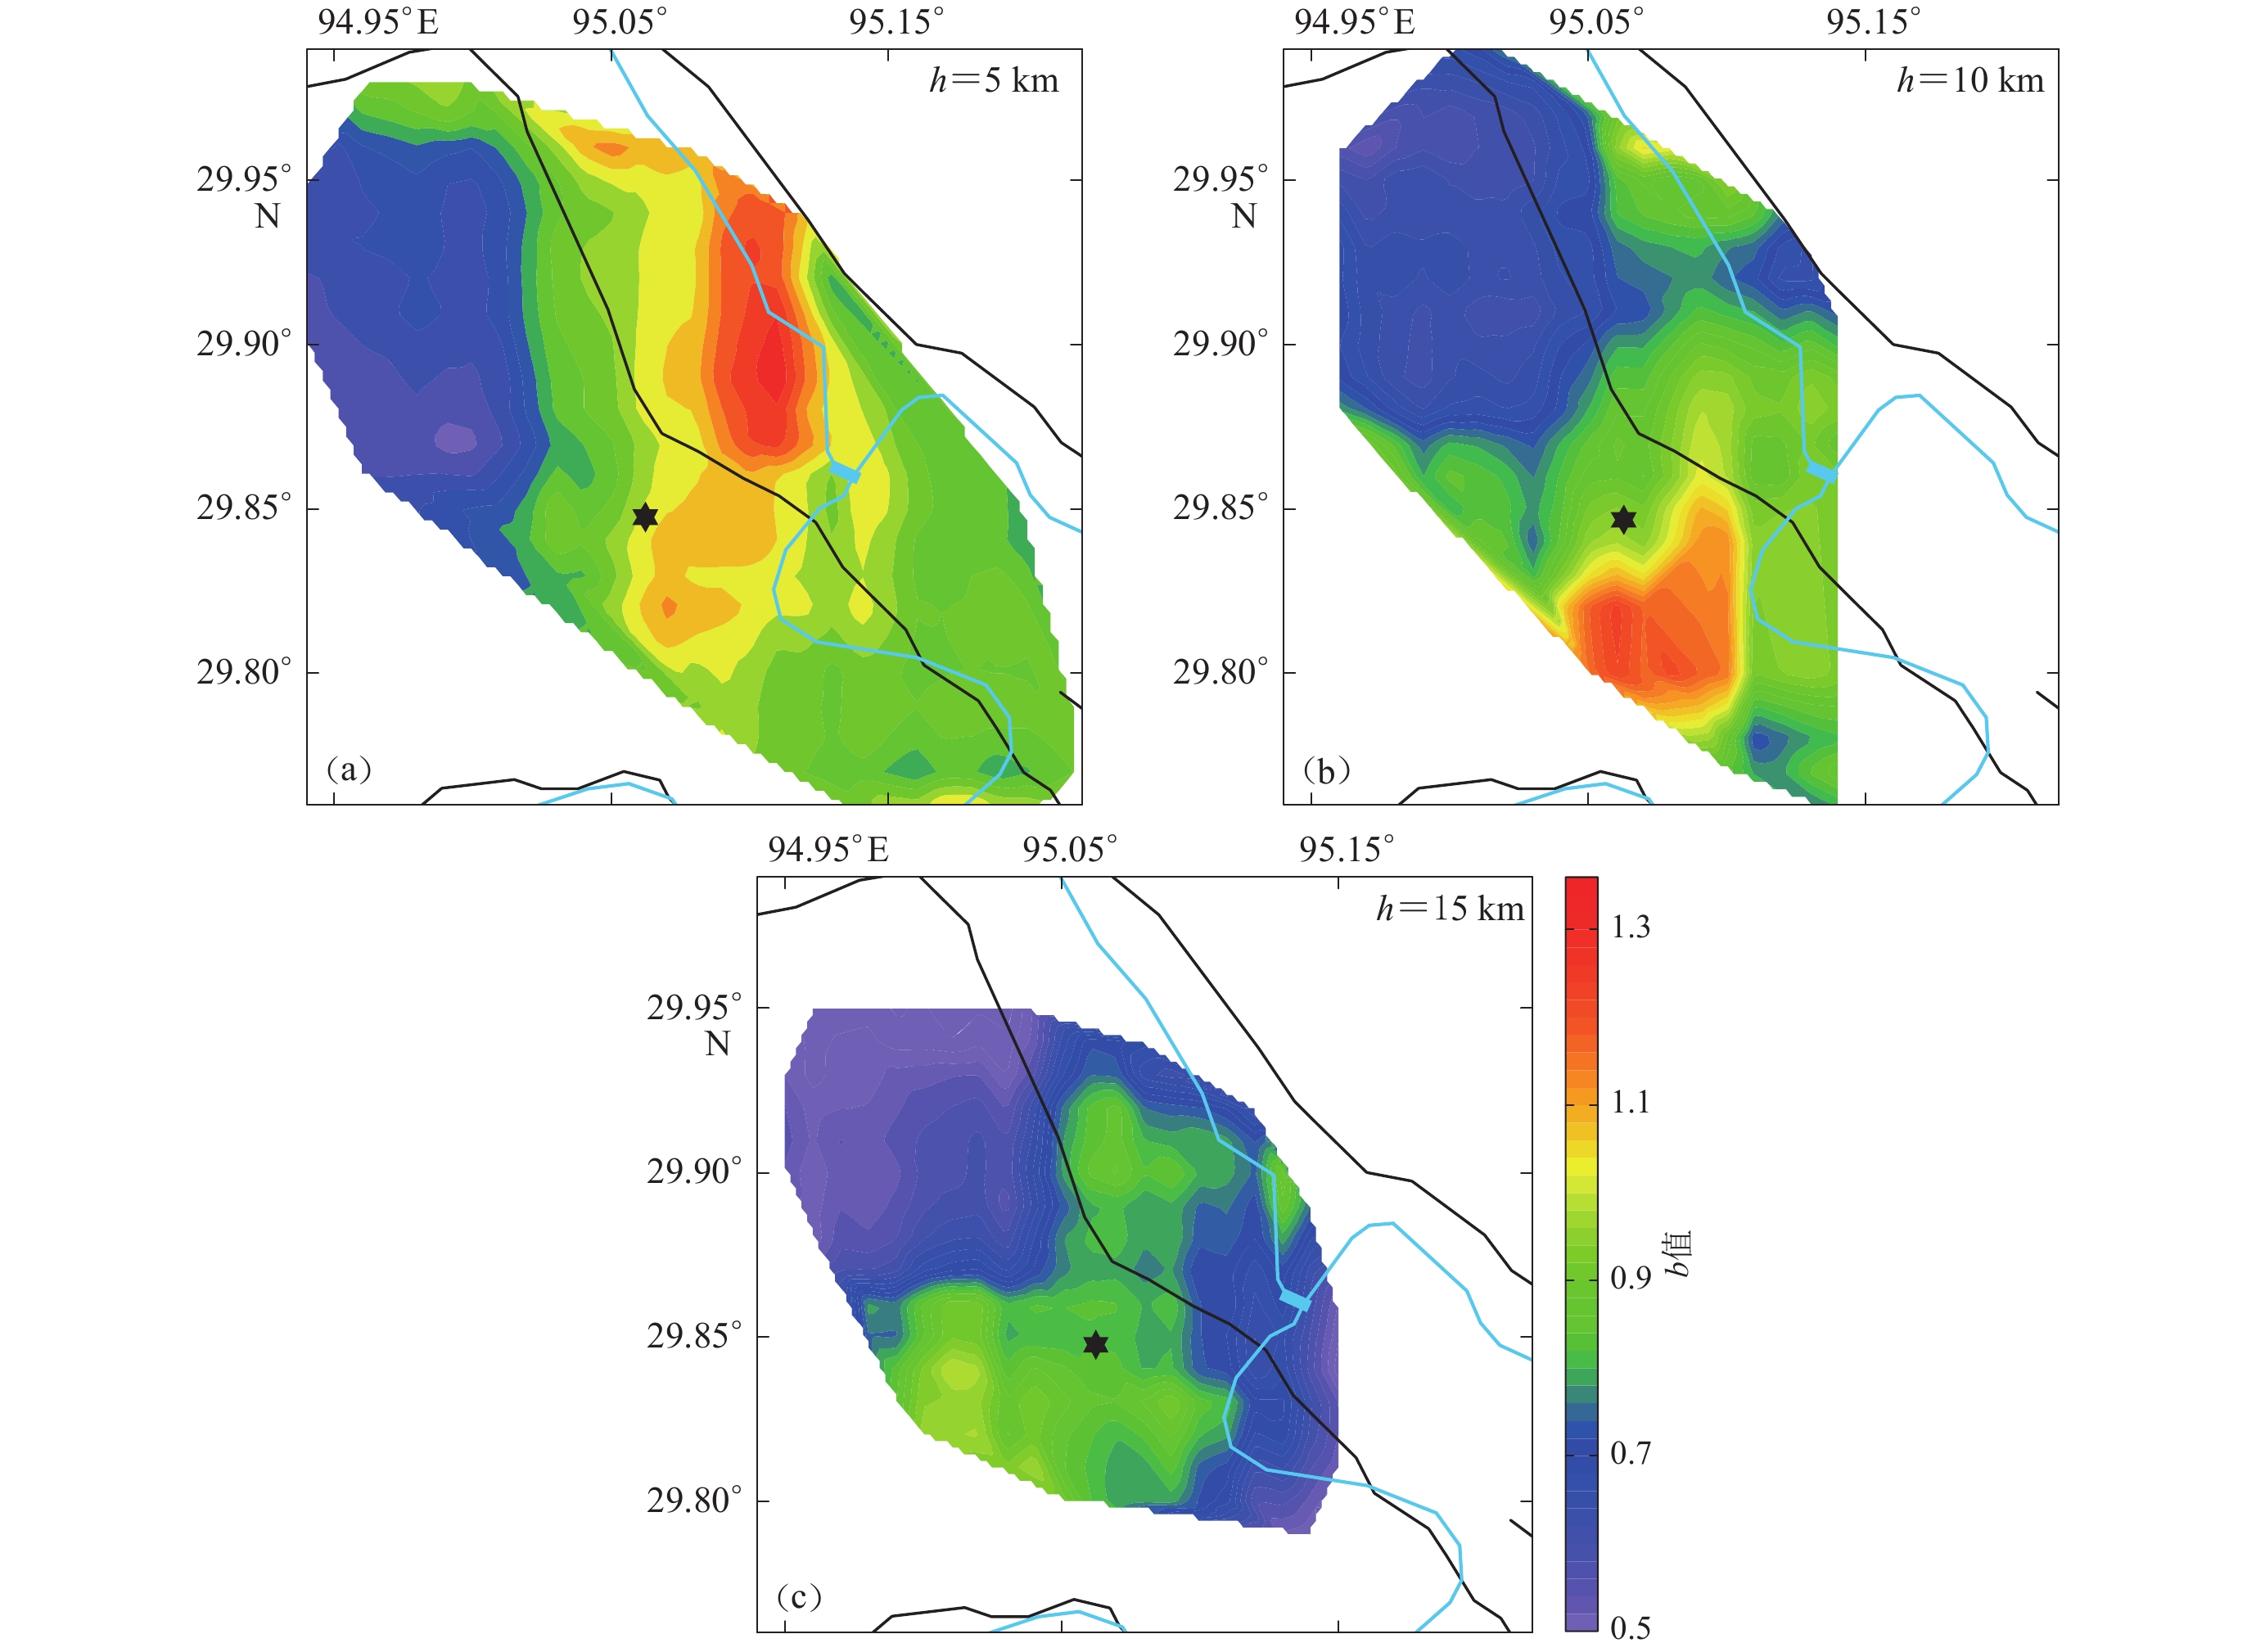
摘要: 本文采用双差定位方法对2017年西藏米林MS6.9地震的余震序列进行重定位,获得了较准确的余震空间分布。在此基础上,计算了米林地震震源区的b值空间分布,并结合前人资料研究了米林地震前后的b值变化。重定位结果显示:米林地震余震序列呈NW−SE向分布,主要分布在雅鲁藏布江大拐弯缝合带和比鲁构造岩片的北东边界,震源深度集中于3—20 km范围内。b值时间分布显示:米林地震震前震源区的b值降低,表明震前震源区存在较强的应力积累;地震后震源区的b值呈现跳跃式上升,反映出震源区应力释放,同时随时间的推移,b值逐渐趋于稳定。米林地震震源区的b值在0.52—1.35范围内变化,15 km深度以上b值在东、西方向上存在差异,15 km以下在东北、南西方向上存在差异,由此推测不同的b值分布与地下的结构特征有关,浅层的b值变化与震源区的破裂程度相关,深部变化则反映了不同构造单元的岩性差异。Abstract: The aftershock sequence of the Milin MS6.9 earthquake in Tibet in 2017 are relocated by double-difference algorithm in this paper. Based on the relocated results, the spatial distribution of b-value in the source region of Milin earthquake is obtained. Combining historical b-value data from previous researches, the temporal distribution of b-value in the studied area is also obtained. The relocation results show that the aftershock sequence of the Milin earthquake are distributed in NE−SE direction along the NE boundary of Indus-Yarlung Tsangpo big-turned suture and Bilu tectonic slice, most aftershocks are concentrated in 3−20 km depth. The temporal distribution of b-value shows before Milin earthquake b-value is lower than that in the year of 2008, indicating that the stress accumulation in the studied area is strong before Milin earthquake. After Milin earthquake, there was a step-rise of b-value, showing the releases of stress, and b-value tended to stable. b-value ranges in 0.52−1.35 in the source region of Milin earthquake, the b-value variation above the depth of 15 km is distributed along the east-west direction, and below 15 km along the NE−SW direction. Therefore, it is deduced that different b-value distribution represents different structure characteristics, i.e., the b-value variation of the shallow area is related to the degree of rupture in the source region, and the b-value variation of deep area reflects the lithology difference of different tectonic units.
-
引言
南极大陆是地球上最古老的大陆之一,原处于冈瓦纳古陆的核心位置. 由于其保存了地球演化中一些重大地质事件的记录,因而对南极大陆的研究关系到我们对全球构造格局形成和演化的认识. 特别是南极大陆特殊的地理位置和独特的自然条件,使它具有很高的科学研究价值(田宝峰等,2012). 中国南极长城站始建于1984年,是我国在南极建立的第一个科学考察站,也是我国对南极地区进行科学考察而设立的常年性科学考察站. 长城站位于南极洲南设得兰群岛的乔治王岛西部的菲尔德斯半岛上. 乔治王岛位于南极洲板块、 南美洲板块和太平洋板块的交汇地带,为研究地壳构造、 岩浆活动、 地震成因、 大气环流变化和气候演化规律等提供了良好的场所和数据资源.
南极地区自开展地震学研究以来获得了许多成果,使我们对南极地区的地震活动性、 地壳和上地幔的结构、 各向异性特点有了较为全面的认识. 南极地区是地震活动性较低的地区之一,但是位于火山活动区的地震活动性要强于南极洲边缘地带的地震活动. 南极地区的地震活动性具有区域性特征,主要分布于山脉构造带和火山地区(Kaminuma,Ishida,1971; Kaminuma,1995; Reading,2007). 南极地区地下结构通过地球物理研究的多种手段也获得了丰富的结果,表明南极地区地壳和上地幔在速度结构和层厚度等地质构造上具有明显的区域性特征(Bannister et al,2003; Anandakrishnan,Winberry,2004; Winberry,Anandakrishnan,2004; Watson et al,2006).
地震各向异性分析作为一个有效的手段,在研究地球内部变形、 演化以及应力的分布等方面起着重要的作用. 南极地区的地震各向异性研究结果表明其上地幔各向异性普遍存在且较为明显(Pondrelli,Azzara,1998; Müller,2001; Pondrelli et al,2005). 剪切波分裂作为地球介质各向异性最明确最直接的观测证据,被广泛用于地壳和上地幔的各向异性研究. 剪切波在各向异性介质中传播时会分裂成两个垂直极化、 速度不同的波列,这个分裂特征可以用快波偏振方向和慢波延迟时间两个参数来描述. 慢波延迟时间依赖于剪切波的有效传播路径和介质本身的各向异性程度. 快波偏振方向与裂隙方向及构造走向相关(Crampin,1985; Mainprice,Silver,1993).因此,剪切波分裂分析与地震各向异性的研究有着直接的关系.Silver(1996)的研究结果表明,上地幔慢波延迟时间在0—2 s内,而大陆地区地幔的慢波延迟时间平均值为1.0 s.
本文采用剪切波分裂方法,挑选出2008年2月—2010年3月长城站记录的近震和远震数据分别计算剪切波分裂参数,分析长城站地区地壳和上地幔剪切波分裂参数的分布,进而讨论该区域地壳和上地幔的各向异性特征.
1. 南极长城站背景和数字地震观测
1.1 长城站背景
南极长城站自1985年建立起,即开始了对南极地区地震进行研究. 第一次南极地震考察是由柯金文采用基氏地震仪进行的,总共记录到18次各种类型的震动(贾国强,1990). 长城站的地震台地理位置处于辉绿岩的火山岩株,经度为58.96°W,纬度为62.22°S. 台站位置如图1所示.
![]() 图 1 本文的研究区域(见图中长方框)(a)及研究区域内长城站位置(三角形)和地震(圆点)分布(b)Figure 1. The study area(rectangular in figure)(a),as well as location of Great Wall seismic station(triangle) and the distribution of earthquakes(solid circles)in the study area(b)
图 1 本文的研究区域(见图中长方框)(a)及研究区域内长城站位置(三角形)和地震(圆点)分布(b)Figure 1. The study area(rectangular in figure)(a),as well as location of Great Wall seismic station(triangle) and the distribution of earthquakes(solid circles)in the study area(b)1.2 长城站的地震观测资料
本文采用的地震数据来自我国第24次和第25次南极科学考察队,于2008年2月—2010年3月记录的资料(由中国地震局地球物理研究所提供). 图2给出了长城站所记录到的清晰的地震波形.
![]()
2. 剪切波分裂研究方法
利用剪切波分裂研究地震各向异性自20世纪90年代以来已发展为较成熟的方法. 剪切波分裂分析的方法很多,但是对于研究地壳和上地幔的各向异性,通常采用不同的剪切波分裂方法. 由多个地区的计算试验表明,对于地壳剪切波分裂,SAM方法较为可靠,已经应用于多个地区的地壳剪切波分裂研究(高原等,1996; 石玉涛等,2009). 对于上地幔剪切波分裂的计算,最小切向能量法的研究结果最为可靠(Silver,Chan,1991; 罗艳等,2004). 本文在计算长城站地区地壳介质剪切波分裂参数时,采用SAM方法; 对于该地区上地幔剪切波分裂参数的计算则采用最小切向能量法.
2.1 SAM计算方法原理
SAM方法是建立在相关函数基础上的一种用于剪切波分裂分析的系统分析方法,包括相关函数计算、 时间延迟校正和偏振分析检验等3个部分(石玉涛等,2009).
由于快、 慢剪切波均来自同一个波源,因此经过时间延迟校正之后的快、 慢波应该是相关的. 用相关函数的计算来寻求快波偏振方向和慢波延迟时间. 首先计算两水平分量波形数据在每个方向上不同时间延迟的互相关函数,得到的最大相关函数值所对应的方向和时间延迟,即为所求的快波偏振方向和慢波时间延迟.
根据相关函数计算的结果,再进行时间延迟校正和偏振分析检验. 时间延迟校正就是把得到的慢波波列提前一个时间量,使其到达时刻与快波一致,以消除时间延迟的影响; 而偏振分析检验则是对时间延迟校正前后的偏振图进行对比分析,以检验计算结果的准确性. 图3给出经过时间延迟校正之后的质点偏振图(已转为线性),进一步验证了其结果的可靠性.
![]() 图 3 剪切波分裂示意图(a),(b)分别为2008年5月11日22时12分6秒地震Sg波的质点偏振图和偏振校正后的线性质点偏振图;(c),(d)分别为2009年8月10 日4时6分31秒地震SKS波径向(实线)和切向(虚线)分量,及其校正前(实线)、后(虚线)的质点偏振图Figure 3. The diagrams of shear-wave splitting (a) and (b)are the trail of particle of Sg wave from the earthquake at 22:12:06 on May 11 2008,before and after the polarization correction,respectively.(c)is the radial(solid line) and transverse(dashed line)components of the SKS wave from the earthquake at 04:06:31 on 10 August 2009,and (d)is the trail of particle of SKS wave before(solid line) and after(dashed line)the polarization correction,respectively
图 3 剪切波分裂示意图(a),(b)分别为2008年5月11日22时12分6秒地震Sg波的质点偏振图和偏振校正后的线性质点偏振图;(c),(d)分别为2009年8月10 日4时6分31秒地震SKS波径向(实线)和切向(虚线)分量,及其校正前(实线)、后(虚线)的质点偏振图Figure 3. The diagrams of shear-wave splitting (a) and (b)are the trail of particle of Sg wave from the earthquake at 22:12:06 on May 11 2008,before and after the polarization correction,respectively.(c)is the radial(solid line) and transverse(dashed line)components of the SKS wave from the earthquake at 04:06:31 on 10 August 2009,and (d)is the trail of particle of SKS wave before(solid line) and after(dashed line)the polarization correction,respectively2.2 最小切向能量法的计算原理
最小能量法是由Silver和Chan(1991)提出的,也叫SC方法(罗艳等,2004). 震中距在85°—110°时,SKS波经过地核的反射之后垂直入射到台站下方. 当SKS波在各向同性介质中传播时,只有径向分量,没有切向分量. 当地幔中存在各向异性介质时,SKS波就会分裂成偏振方向垂直、 传播速度不同的两个波列. 因此可以用快波偏振方向和慢波延迟时间来描述各向异性介质的性质. 切向分量的信号是判断是否存在各向异性物质的关键. 当近似垂直入射的SKS波的切向分量显著且近似为径向分量的一阶时间导数时,表明在射线穿过的核幔边界到台站的路径有各向异性物质层存在; 如果无切向分量或者切向分量很小,则表明观测台站下面不存在各向异性物质,或SKS入射方向正好与各向异性对称轴平行或垂直.
在计算时,首先要将地震信号旋转到切向上,然后找出切向分量最小时所对应的偏振方向和延迟时间,即为我们需要的各向异性介质的参数.
3. 剪切波分裂研究结果
3.1 地壳剪切波分裂结果
计算地壳剪切波分裂要求选取剪切波窗口内的数据.实验证明在剪切波窗口外的地震波将产生径向分量很强的沿地表滑行的SP转换波,容易对直达剪切波产生干扰. 在剪切波窗口内,观测的地震波形与入射波相类似,而窗口外的剪切波会产生严重的畸变.本文选取的剪切波窗口为60°.选取2008年2月—2010年3月长城站记录到的震相清晰的近震数据. 由于南极地区地震较少,在剪切波窗口内的数据就更少了.本文选取的符合计算条件的数据共有12条,这些地震的深度多分布在10—20 km,震级均为ML1.0上下的小震.地壳剪切波分裂计算结果如表1所示,其中慢波延迟时间经过归一化处理,将计算结果归一化到ms/km. 从计算结果可以看出,在该研究区域,快波偏振方向主要集中在两个方向,分别计算平均值和均方根误差,结果分别为48.9°±13.90°,169.5°±3.11°. 慢波延迟时间结果较为零散,最大值达5.17 ms/km,最小值为1.45 ms/km,平均结果为(3.54±1.10)ms/km.
表 1 地壳剪切波分裂参数Table 1. The parameters of shear wave splitting in the crust
3.2 上地幔剪切波分裂结果
选取2008年2月—2010年3月长城站记录到的远震数据.根据SKS波分裂计算的要求,选取震中距范围为85°—110°之间的数据,震级均为ML≥5.5. 符合计算要求的地震事件共有20条(表2). 快波偏振方向主要集中在小于90°范围内,也有个别结果分布在120°左右. 而慢波延迟时间主要集中在2.0 s以下. 快波偏振方向可以归纳为两个,其中一个平均值为46.6°±20.27°,另一个为127.6°±23.07°; 慢波延迟时间平均值为(1.60±0.25)s.
表 2 上地幔剪切波分裂参数Table 2. The parameters of shear wave splitting in the upper mantle
4. 各向异性初步分析
根据长城站地区Sg波和SKS波分裂计算的结果,绘制了长城站地壳和上地幔各向异性快波偏振方向的结果图(图4).Sg波的分裂结果反映了地壳各向异性的分布情况,从快波偏振方向可以推断出该区域的裂隙走向、应力的分布情况等(Crampin,1985, 1999);而SKS波分裂结果则主要揭示了上地幔各向异性的结果.上地幔各向异性与板块演化过程中地幔流的作用有关.通过分析剪切波快波偏振方向与大型构造断裂走向之间的关系,可以推断该区域的各向异性特征,以及慢波延迟时间所反映的各向异性程度的大小(Vinnik et al,1989;Silver,Chan,1991).
4.1 长城站地区地壳和上地幔各向异性特征
通过对比长城站地区地壳和上地幔各向异性的结果,发现该地区地壳快波偏振方向的结果较上地幔的结果要离散,这可能是由于研究地壳剪切波分裂的一些近震事件受到了周围环境的干扰,例如海浪、 冰层的破裂等,而且冰层的覆盖对剪切波分裂结果或许也有一些影响. 但总体而言,该地区地壳和上地幔剪切波快波偏振方向优势取向明显. 从图4可以看出,该地区地壳的快波偏振方向有两个,分别为北东向和近南北向; 上地幔快波偏振方向也有两个,分别为北东向和南东向,优势取向明显为北东向. 另外从图4中还可以看出,该地区地壳和上地幔的快波偏振方向在北东向几乎是平行的. 地壳剪切波分裂的结果发现慢波延迟时间的分布较为离散,最大值与最小值的差距较大,平均慢波延迟时间为(3.54±1.10)ms/km; 上地幔的慢波延迟时间平均值为(1.60±0.25)s. 上述结果表明,长城站下方地壳和上地幔都具有明显的各向异性特征.
![]() 图 4 长城站地区剪切波偏振方向等面积投影玫瑰图 (a)地壳剪切波分裂结果;(b)上地幔剪切波分裂结果Figure 4. Homolographic projection rose diagrams of polarization directions of the fast shear wave at Great Wall seismic station (a)Shear wave splitting results in the crust;(b)Shear wave splitting results in the upper mantle
图 4 长城站地区剪切波偏振方向等面积投影玫瑰图 (a)地壳剪切波分裂结果;(b)上地幔剪切波分裂结果Figure 4. Homolographic projection rose diagrams of polarization directions of the fast shear wave at Great Wall seismic station (a)Shear wave splitting results in the crust;(b)Shear wave splitting results in the upper mantleMüller(2001)综合运用了SKS,SKKS,PKS波及直达S波研究了南极大陆及斯科舍海(Scotia Sea)地区13个台站下方的各向异性结构,结果表明南极地区具有明显的各向异性特征. 在斯科舍海地区快波偏振方向为近东西向和北东向,各向异性程度从西到东逐渐减小. 由于本文数据有限,只分析了长城站一个台站的数据,并不能得到南极地区各向异性的空间分布特征,但是长城站北东向的各向异性方向与Müller(2001)的研究结果基本一致,而且来自上地幔的慢波延迟时间结果与斯科舍海东边的PMSA台站结果相近(Müller,2001).
4.2 各向异性与区域构造
长城站地区地壳和上地幔北东向的快波偏振方向揭示了该地区壳幔一致的变形特征. 快波偏振方向反映了地壳内区域主压应力的主要趋势,南极长城站地区地壳各向异性的快波偏振方向揭示了区域应力的方向为北东向. 慢剪切波延迟时间表明了各向异性程度的大小. 地壳各向异性产生的慢波延迟时间平均为3.54 ms/km,表明了南极长城站地区地壳具有明显的各向异性特征. 通常情况下,地壳产生的SKS波分裂的延迟时间为0.1—0.3 s(Hess,1964),远远小于该研究区域SKS波分裂所产生的慢波延迟时间1.60 s.所以SKS波产生的慢波延迟时间主要源于上地幔,而且该地区的上地幔同样具有明显的各向异性特征. Sieminski等(2003)的研究结果也表明了该地区具有明显的各向异性,面波层析成像结果显示了在南极地区地壳和上地幔具有明显的低速异常.
上地幔各向异性普遍被认为是由于形变导致橄榄石等矿物晶格优选方位所引起的. 产生地幔物质变形的原因可能有多种,但是最直接的原因是由于板块运动所致,板块运动的速度和方向在很大程度上决定了上地幔各向异性的方向和强度(Nicolas,Christensen,1987; 常利军等,2008). 根据Gripp和Gordon(1990)全球板块运动的模型,南极地区斯科舍海附近的绝对板块运动的方向为北东—南西向,而我们计算所得到的长城站地区地壳和上地幔各向异性的方向为北东向,与板块运动的结果是一致的. 这说明了该地区板块运动驱动下的软流圈地幔流是上地幔各向异性的主要原因,即在板块运动驱动力的作用下上地幔橄榄岩等晶体的晶格优势取向沿着地幔物质流动的方向而变化,从而导致了上地幔北东向的快波偏振方向.
Hayes(1991)的研究结果表明,在整个南极板块边界中发散边界多达92%,从而导致了南极地区剪切波分裂结果显示快剪切波偏振方向多数与海岸线平行. 将本文剪切波计算的上地幔快波偏振方向与海沟的走向以及海岸线的方向对比(图5),发现快波偏振方向与海沟的方向平行,同时也平行于海岸线的方向,表明该结果与Hayes(1991)结果一致,进一步验证了本文结果的可靠性.
![]() 图 5 各向异性与构造之间的关系. 实线箭头表示地壳和上地幔北东向的快波偏振方向,虚线箭头表示地壳和上地幔南东向的快波偏振方向Figure 5. Relationship between the anisotropic direction and tectonic structure Solid arrows are the NE fast wave polarization direction from the crust and upper mantle; dashed arrows are the SE fast wave polarization direction from the crust and upper mantle
图 5 各向异性与构造之间的关系. 实线箭头表示地壳和上地幔北东向的快波偏振方向,虚线箭头表示地壳和上地幔南东向的快波偏振方向Figure 5. Relationship between the anisotropic direction and tectonic structure Solid arrows are the NE fast wave polarization direction from the crust and upper mantle; dashed arrows are the SE fast wave polarization direction from the crust and upper mantle5. 讨论与结论
通过对南极长城站在2008年2月—2010年3月记录到的近震和远震数据进行剪切波分裂的研究,使我们对南极长城站地区地壳和上地幔的各向异性有了进一步的了解. 本文综合分析了近震和远震的剪切波分裂参数特征,从各向异性快波偏振方向和各向异性程度两个方面,初步判定该地区地壳和上地幔具有明显的各向异性特征,并且地壳与上地幔快波偏振的方向是一致的,均为北东方向,这一结果与前人的研究结果相一致.
南极长城站地区地壳快波偏振方向结果反映了区域应力的方向为北东向,上地幔各向异性快波偏振方向与海沟和海岸线的方向近于平行,均为北东向. 另外本文对比了上地幔快波偏振方向与绝对板块的运动方向,它们之间的一致关系揭示了绝对板块的运动是构成上地幔各向异性的主要原因.
南极地区的地震学研究一直备受关注,但是由于南极地区恶劣的自然环境,地震观测资料相对稀少. 本文所使用的数据量有限,对南极长城站地区各向异性的研究仅限于初级阶段. 鉴于数据量和台站的有限性,本文没有考虑复杂的各向异性结构特征,而且也没有考虑覆盖的冰层对地壳各向异性的影响. 这些问题将在进一步的研究中予以解决.
-
![]()
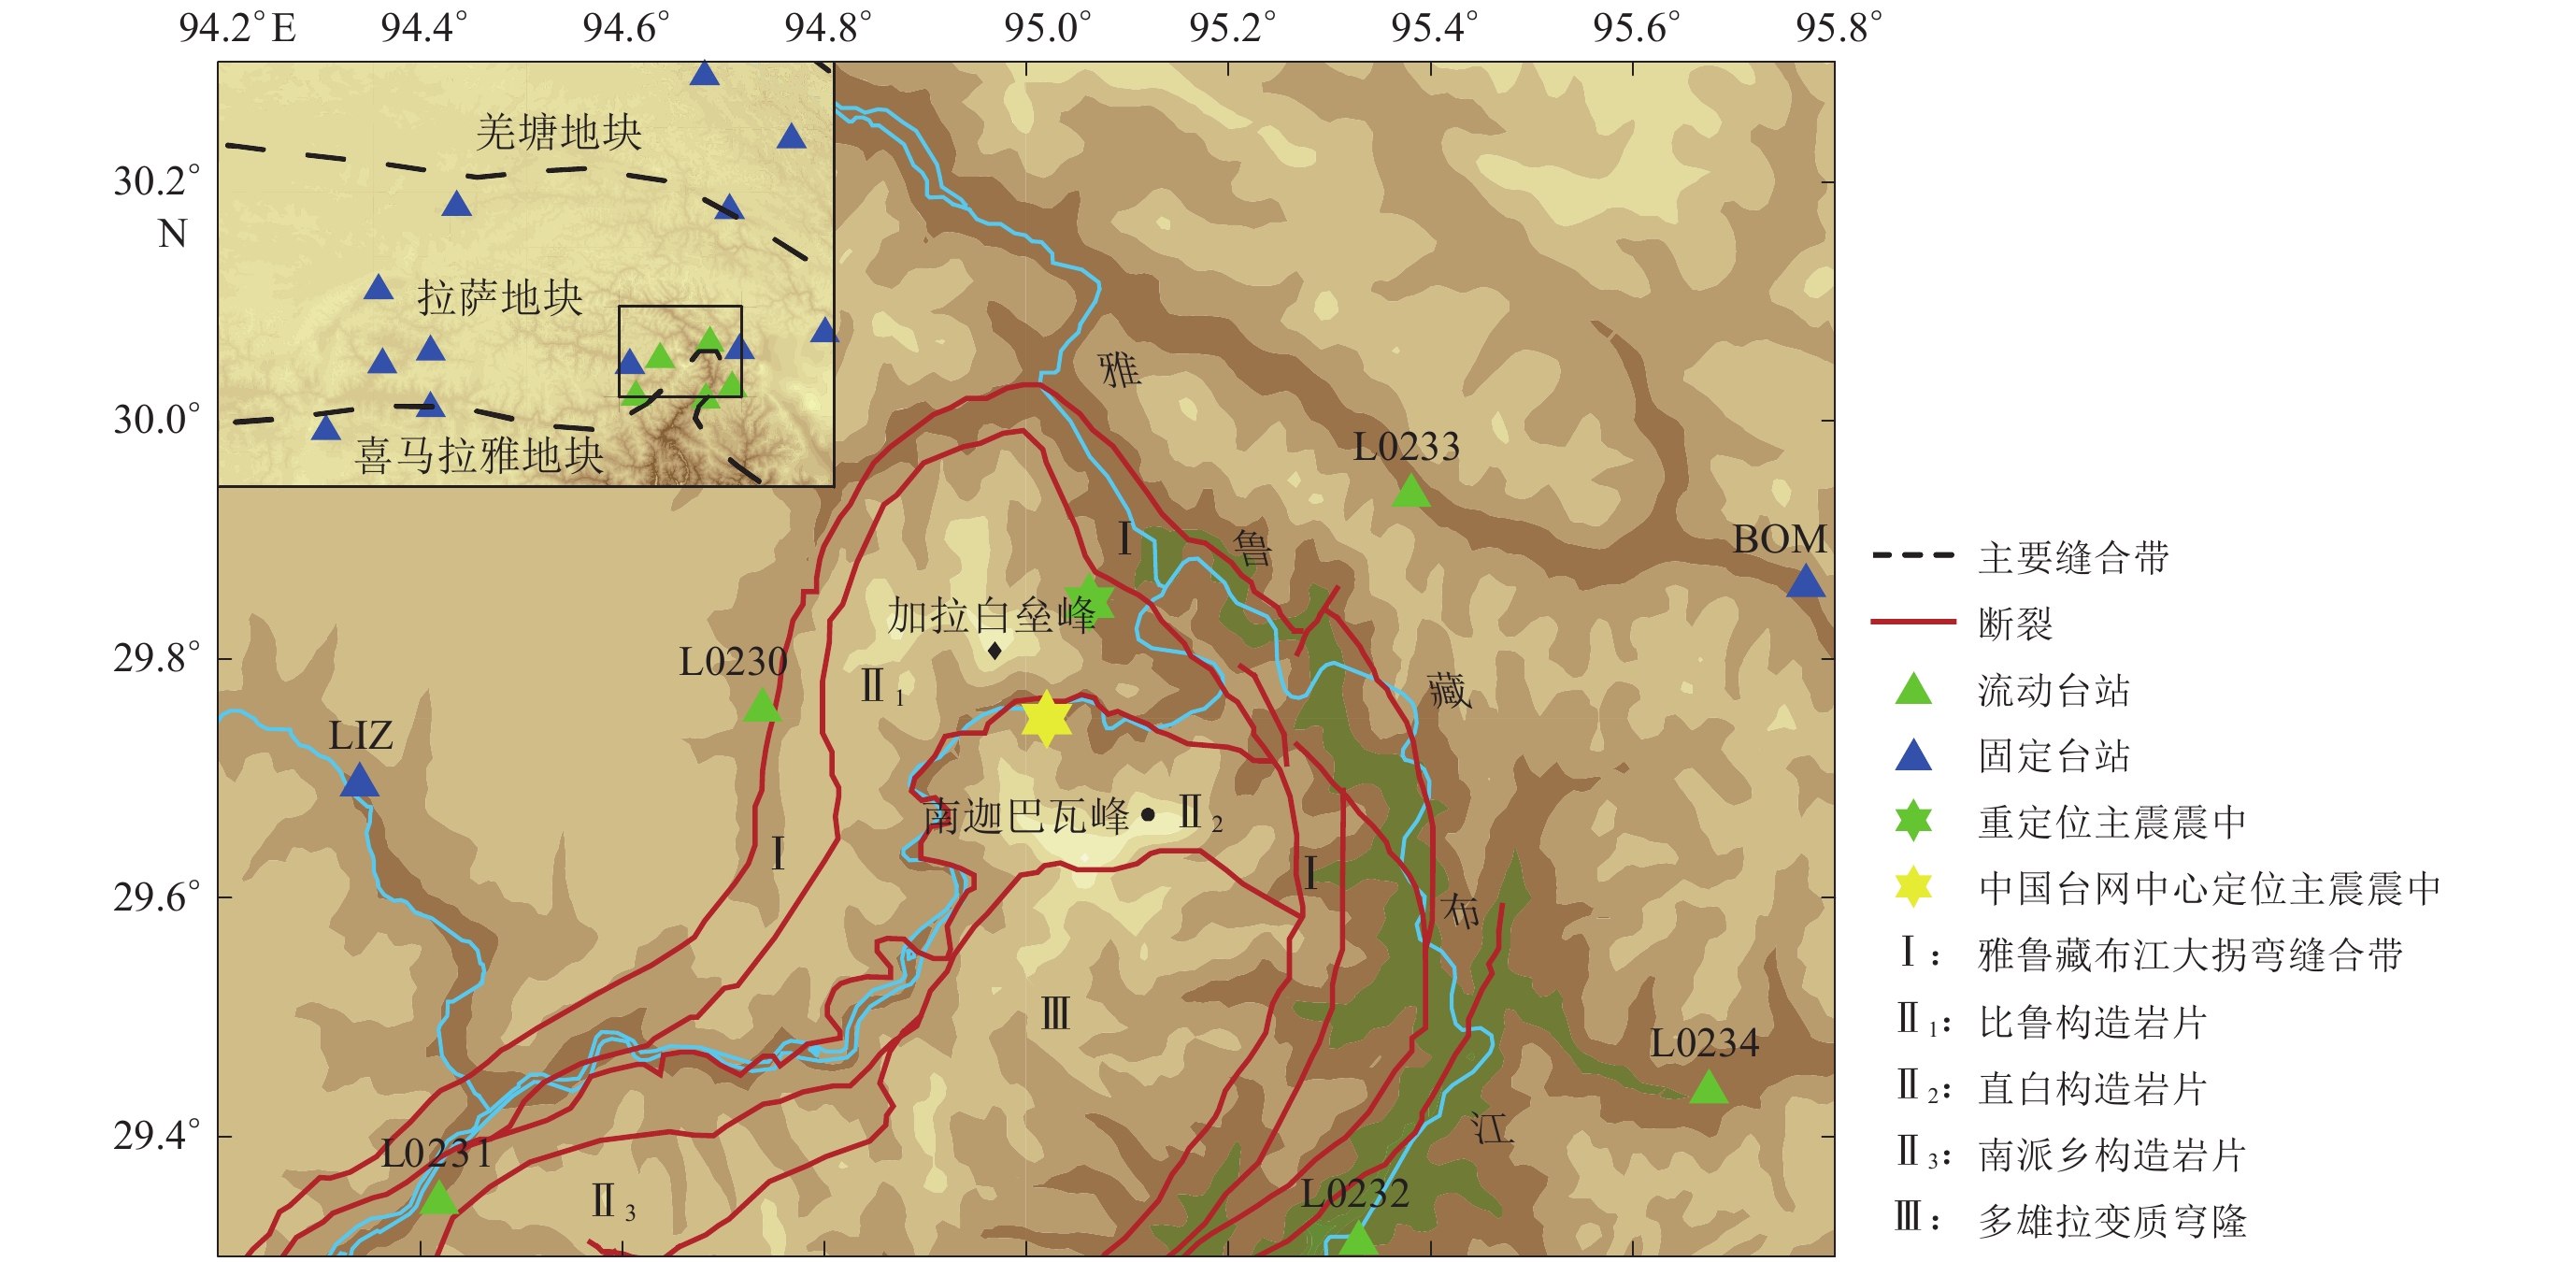
图 1 米林地震震中、台站分布及研究区构造背景图(修改自Xu et al,2012)
Figure 1. Epicentral location of the Milin earthquake,station distribution and tectonic settings of the studied area (revised after Xu et al,2012)
![]()
图 2 米林地震序列重定位结果
(a) 震中分布图,图中震源机制解数据来自GCMT (Dziewonski et al,1981;Ekström et al,2012);(b) 走时残差直方图
Figure 2. Relocation result of Milin earthquake sequence
(a) Distribution of Milin earthquake sequence,where the focal mechanism refers to GCMT (Dziewonski et al,1981;Ekström et al,2012) catalog;(b) Histogram of the travel time residuals after relocation
![]()
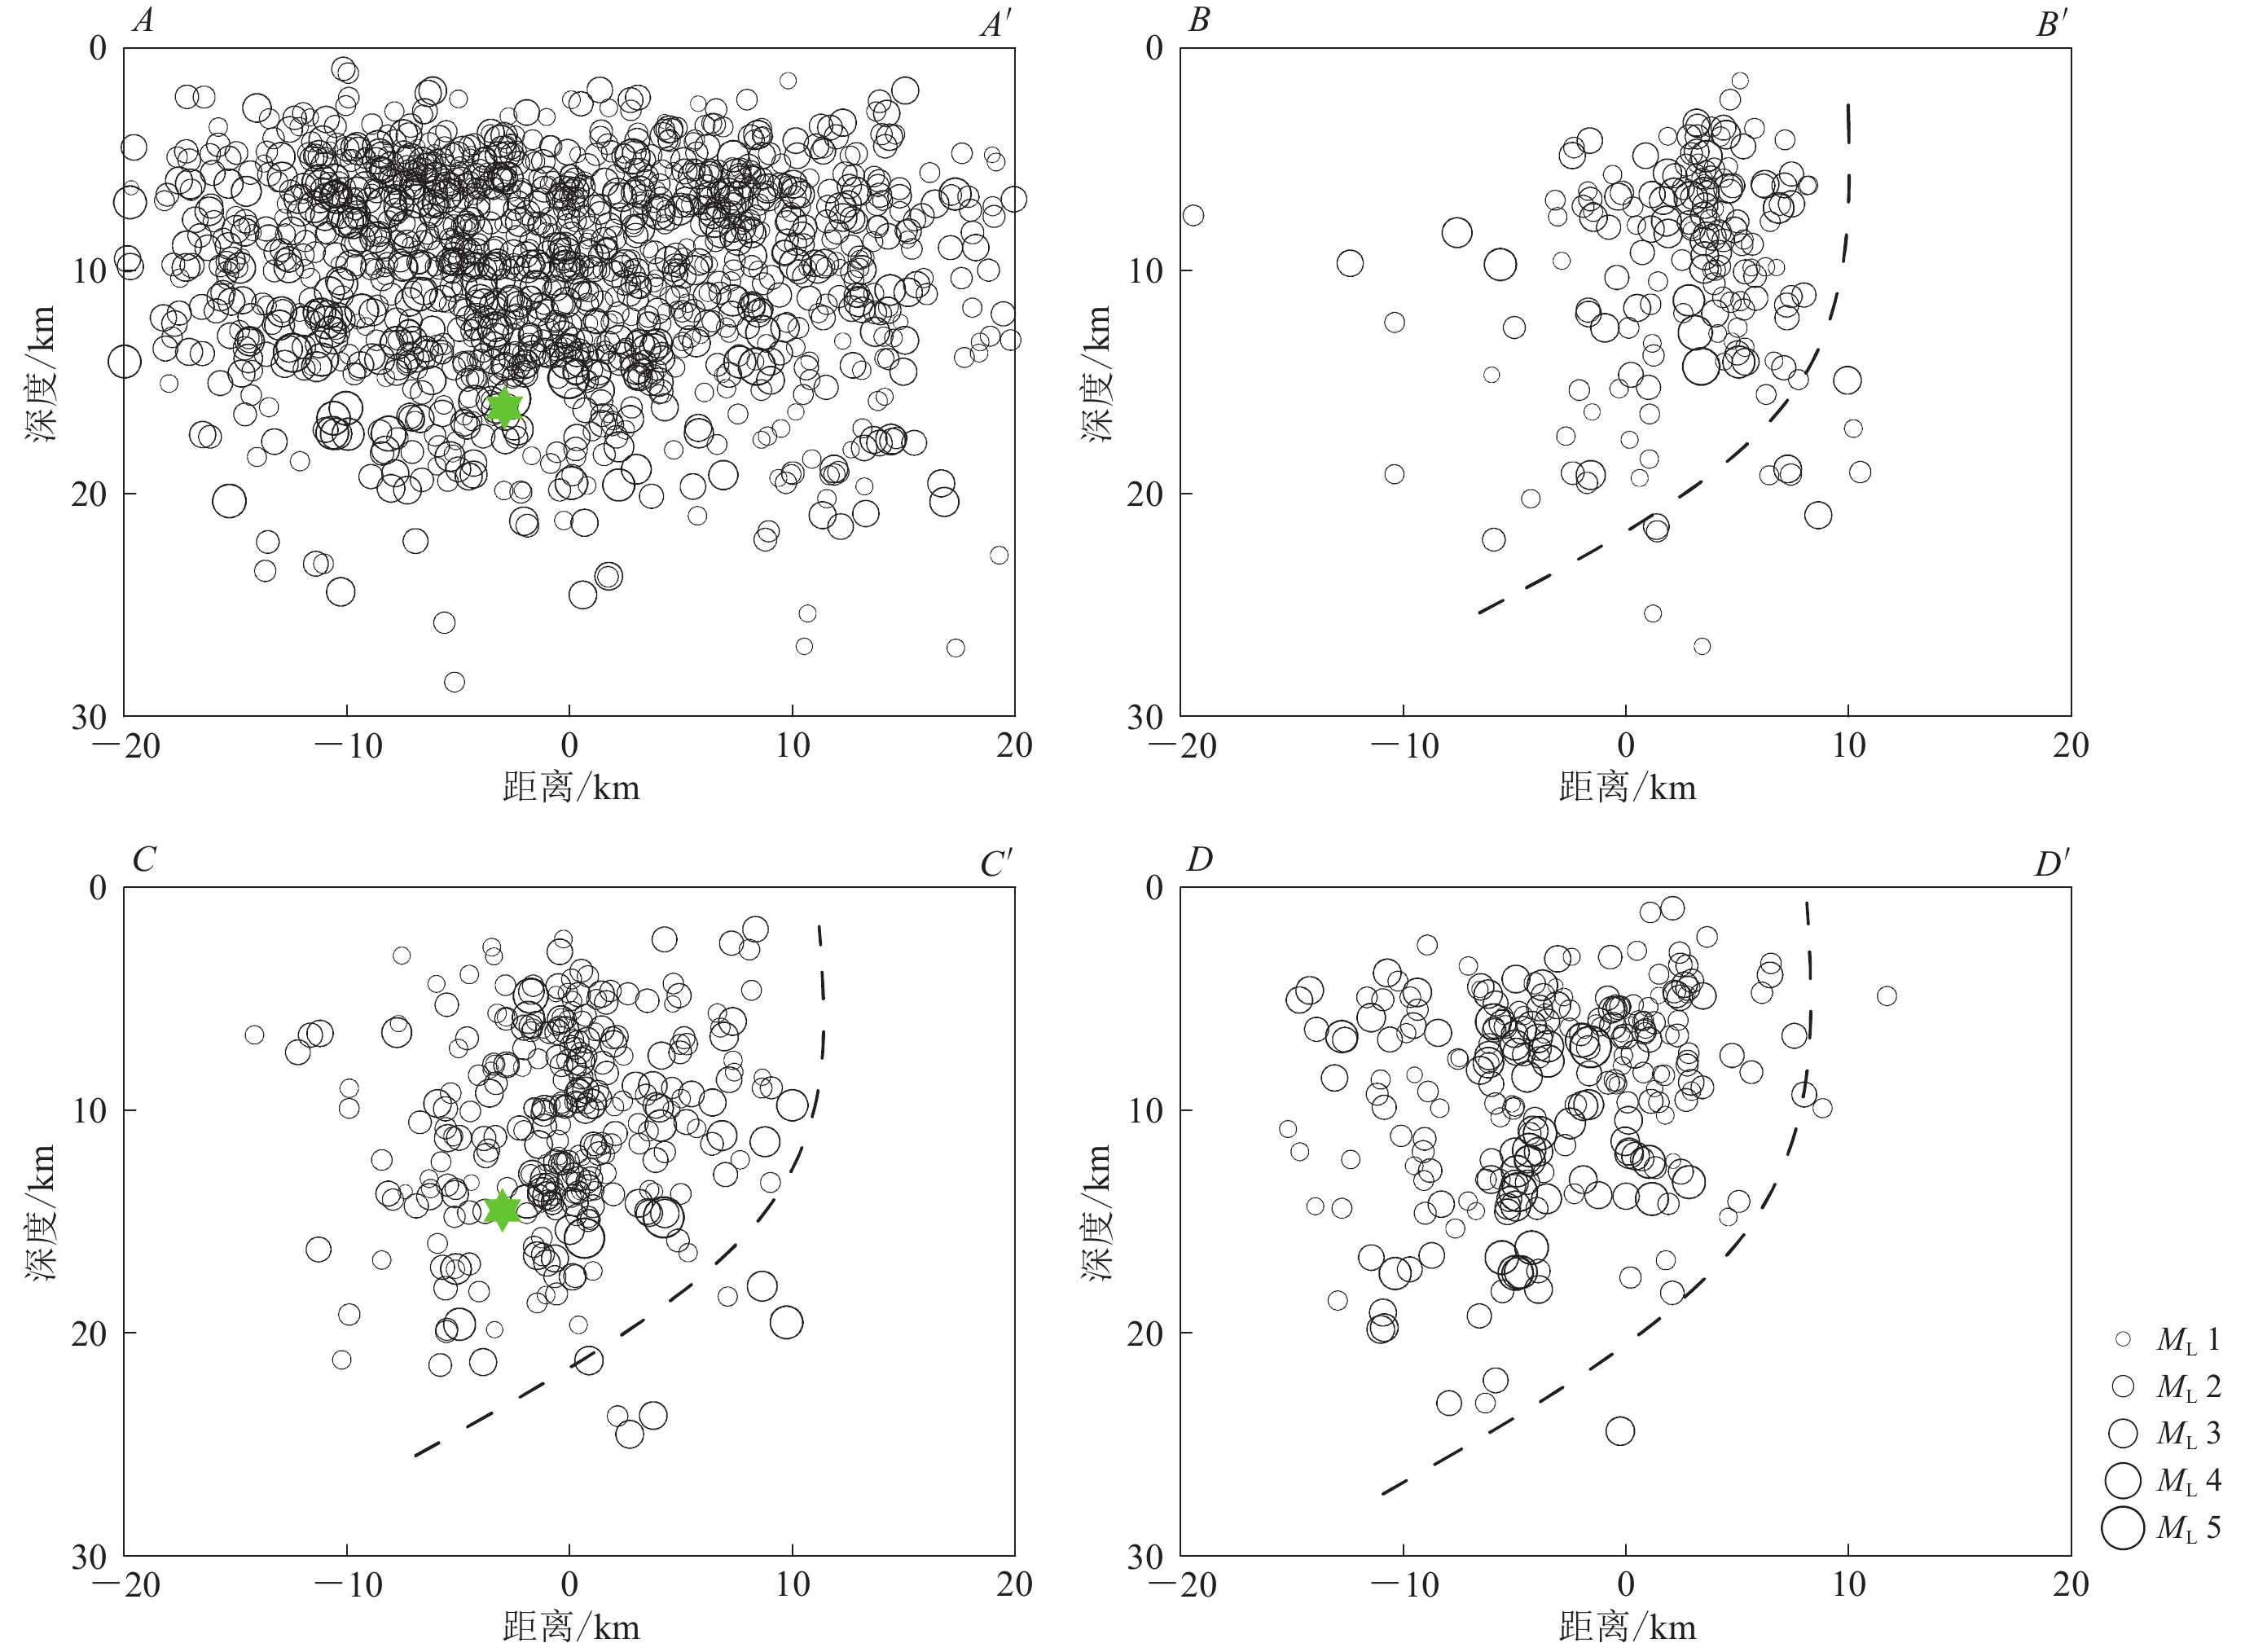
图 3 沿AA′ ,BB′ ,CC′ ,DD′ 剖面的余震分布图(虚线为推测的结构面)
Figure 3. The aftershocks distribution along the profiles AA′ ,BB′ ,CC′ and DD′
Dashed lines indicate inferred structural plane
![]()
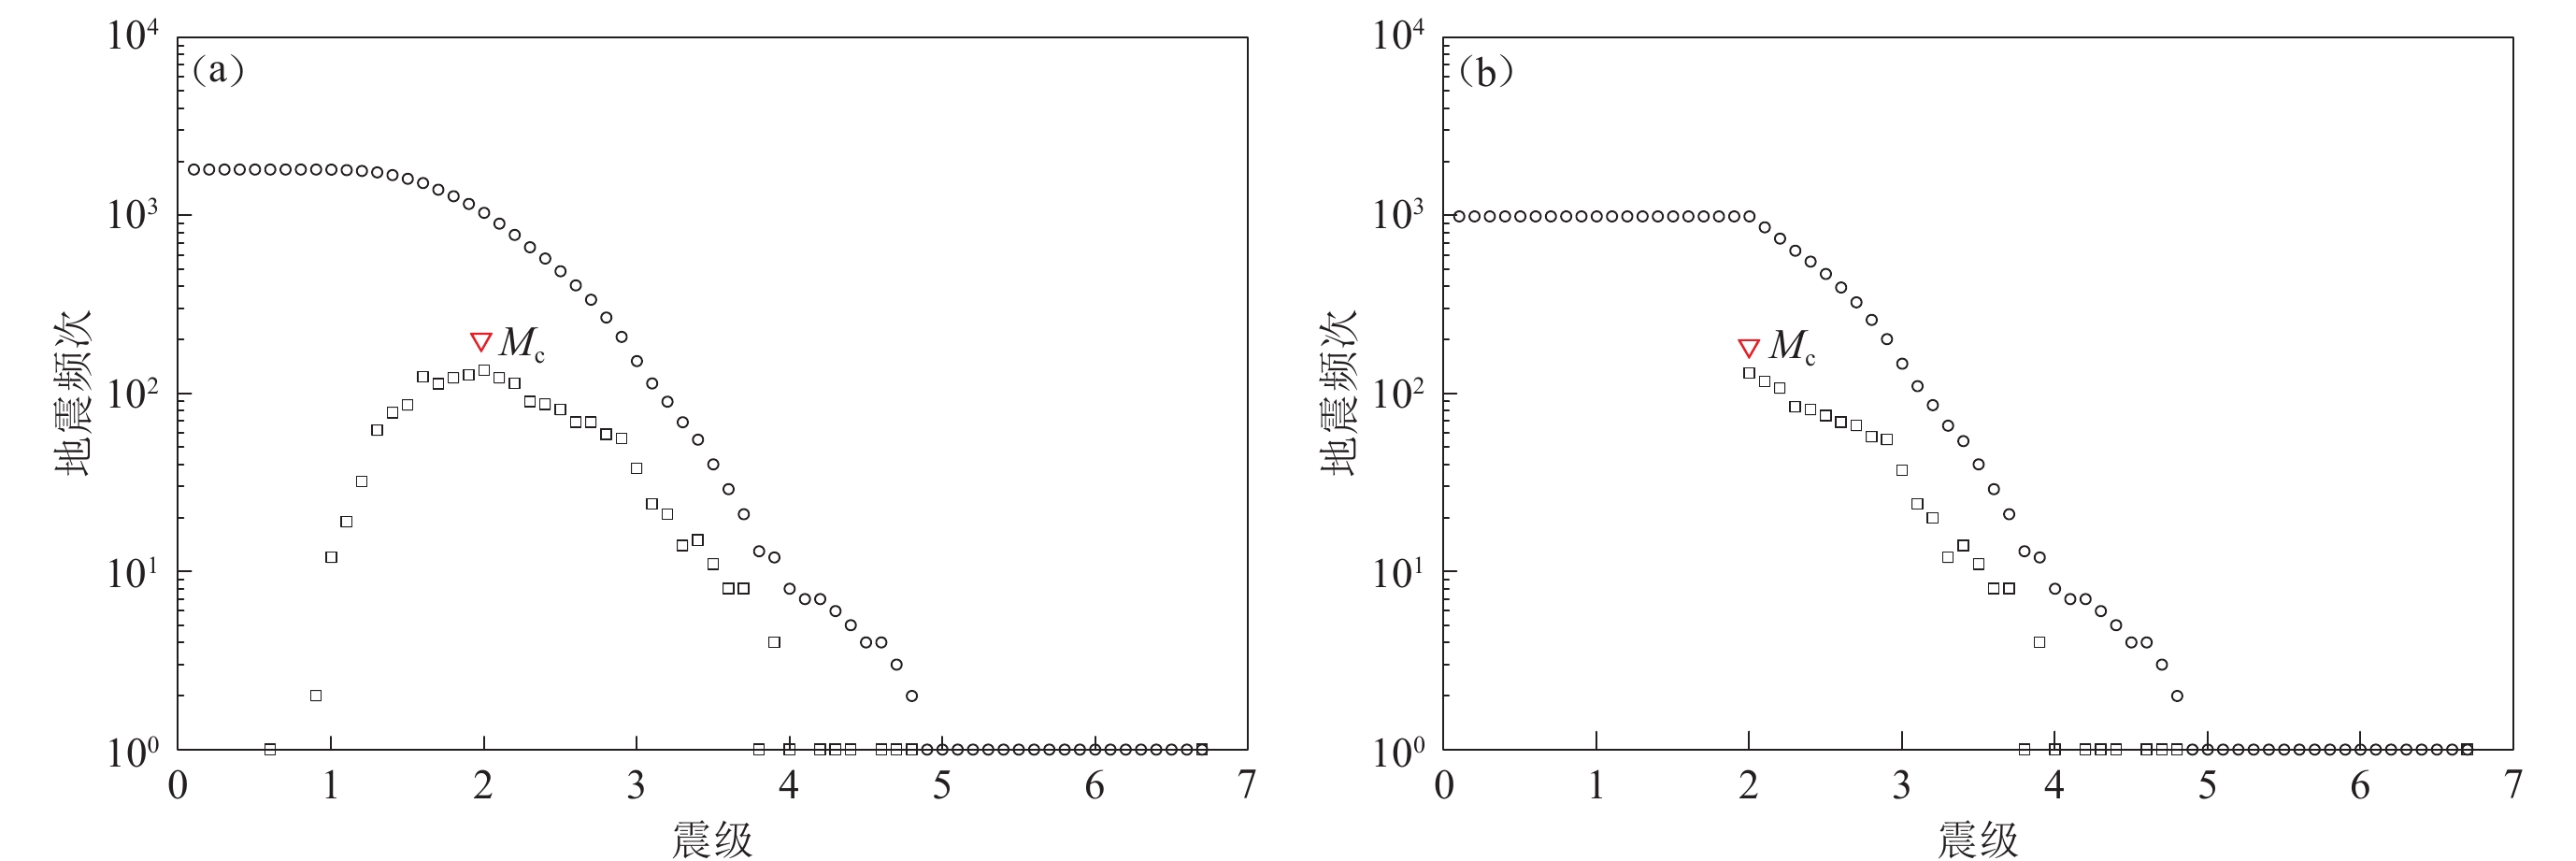
图 4 基于原始地震目录(a)和重定位后地震目录(b)的震级-频度关系曲线
Figure 4. Frequency-magnitude distributions from original earthquake catalogue (a) and relocated earthquake catalogue (b)
![]()
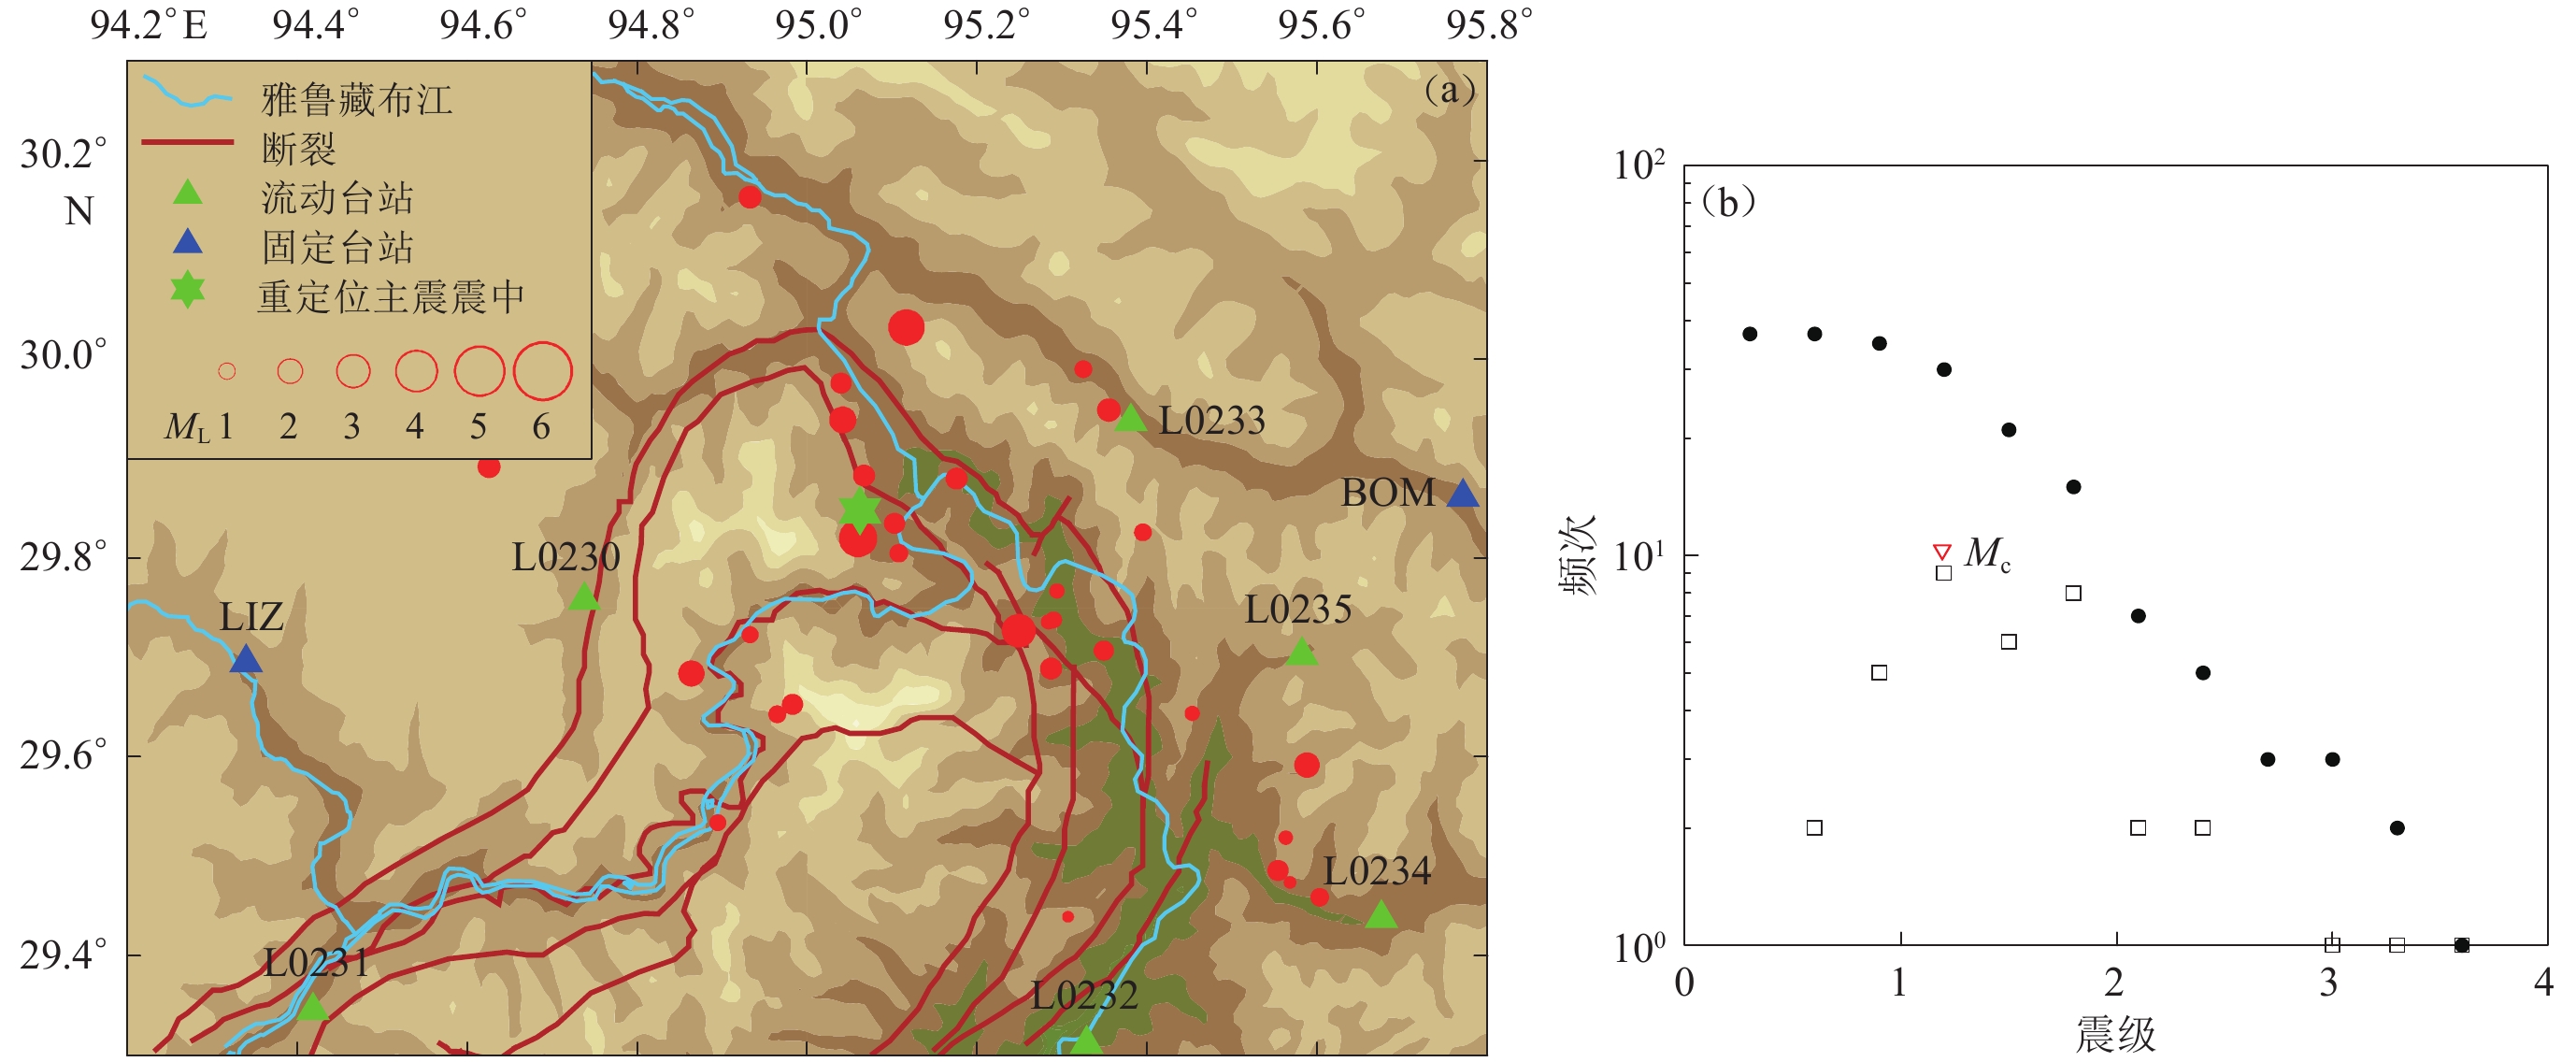
图 5 2017年1—5月南迦巴瓦台网观测资料给出的震中分布 (a)和震级-频度分布 (b)
Figure 5. Spatial distribution of earthquakes (a) and magnitude-frequency distribution (b) obtained from earthquake data recorded by Namche Barwa earthquake network from January to May of 2017
![]()
图 6 b值相关参数随时间的变化
(a) b值;(b) Mc;(c) σ(b)
Figure 6. Temporal variation of b-value relevant parameterts
(a) b-value;(b) Mc;(c) σ(b)
![]()
图 7 b值(a)和σ(b)(b)沿AA′ 剖面的变化情况
Figure 7. Variation of b value (a) and σ(b) (b) along the profile AA′
![]()
图 8 b值(a)和σ(b)(b)沿BB′ 剖面的变化情况
Figure 8. Variation of b value (a) and σ(b) (b) along the profile BB′
![]()
图 9 b值深度切片(黑色六角星为主震位置)
Figure 9. The depth section of b-value (Black hexagram indicates the main shock)
-
白玲,李国辉,宋博文. 2017. 2017年西藏米林6.9级地震震源参数及其构造意义[J]. 地球物理学报,60(12):4956–4963. doi: 10.6038/cjg20171234 Bai L,Li G H,Song B W. 2017. The source parameters of the M6.9 Mainling,Tibet earthquake and its tectonic implications[J]. Chinese Journal of Geophysics,60(12):4956–4963 (in Chinese).
程成,白玲,丁林,李国辉,杨建亚,许强. 2017. 利用接收函数方法研究喜马拉雅东构造结地区地壳结构[J]. 地球物理学报,60(8):2969–2979. Cheng C,Bai L,Ding L,Li G H,Yang J Y,Xu Q. 2017. Crustal structure of Eastern Himalayan Syntaxis revealed by receiver function method[J]. Chinese Journal of Geophysics,60(8):2969–2979 (in Chinese).
方亚如,蔡戴恩,刘晓红,李纪汉,郝晋昇,耿乃光. 1986. 含水岩石破裂前的声发射b值变化[J]. 地震,(2):1–6. Fang Y R,Cai D E,Liu X H,Li J H,Hao J S,Geng N G. 1986. The change of b-value of acoustic emission before ruptures of water-bearing rocks[J]. Earthquake,(2):1–6 (in Chinese).
黄亦磊,周仕勇,庄建仓. 2016. 基于地震目录估计完备震级方法的数值实验[J]. 地球物理学报,59(4):1350–1358. Huang Y L,Zhou S Y,Zhuang J C. 2016. Numerical tests on catalog-based methods to estimate magnitude of completeness[J]. Chinese Journal of Geophysics,59(4):1350–1358 (in Chinese).
李莹甄,殷娜,李小晗. 2014. 不同震级标度转换关系研究概述[J]. 地震工程学报,36(1):80–87. doi: 10.3969/j.issn.1000-0844.2014.01.0080 Li Y Z,Yin N,Li X H. 2014. Review of the conversional relationship for different magnitude scales[J]. China Earthquake Engi-neering Journal,36(1):80–87 (in Chinese).
邵翠茹. 2009. 雅鲁藏布大峡谷地区地震活动性研究[D]. 北京: 中国地震局地球物理研究所: 51–68. Shao C R. 2009. Seismicity of the Yarlung Tsangpo Grand Canyon Region, China[D]. Beijing: Institute of Geophysics, China Earthquake Administration: 51–68 (in Chinese).
王鹏,侯金欣,吴朋. 2017. 2017年九寨沟MS7.0地震序列活动特征分析[J]. 中国地震,33(4):453–462. doi: 10.3969/j.issn.1001-4683.2017.04.001 Wang P,Hou J X,Wu P. 2017. Temporal evolution of the seismicity of the 2017 Jiuzhaigou MS7.0 earthquake sequence[J]. Earthquake Research in China,33(4):453–462 (in Chinese).
王未来,吴建平,房立华,王长在. 2012. 2010年玉树MS7.1地震及其余震的双差定位研究[J]. 中国科学:地球科学,42(7):1037–1046. Wang W L,Wu J P,Fang L H,Wang C Z. 2013. Relocation of the Yushu MS7.1 earthquake and its aftershocks in 2010 from HypoDD[J]. Science China Earth Sciences,56(2):182–191. doi: 10.1007/s11430-012-4450-z
王未来,吴建平,房立华,来贵娟. 2014. 2014年云南鲁甸MS6.5地震序列的双差定位[J]. 地球物理学报,57(9):3042–3051. Wang W L,Wu J P,Fang L H,Lai G J. 2014. Double difference location of the Ludian MS6.5 earthquake sequences in Yunnan Province in 2014[J]. Chinese Journal of Geophysics,57(9):3042–3051 (in Chinese).
张盛峰,吴忠良,房立华. 2014. 双差(DD)定位地震目录能用于地震序列的统计地震学参数计算吗? :云南鲁甸MS6.5地震序列b值的空间分布[J]. 地震地质,36(4):1244–1259. doi: 10.3969/j.issn.0253-4967.2014.04.024 Zhang S F,Wu Z L,Fang L H. 2014. Can the DD-relocated earthquake catalogue be used for the statistical parameters of an earthquake sequence? :A case study of the spatial distribution of b-values for the aftershocks of the 2014 Ludian MS6.5 earthquake[J]. Seismology and Geology,36(4):1244–1259 (in Chinese).
张勇, 许力生, 陈运泰. 2017. 2017年11月18日西藏米林6.9级地震(应急处置科技产品报告)[EB/OL]. [2018-04-20]. http://www.cea-igp.ac.cn/tpxw/276003.html. Zhang Y, Xu L, Chen Y T. 2017. Earthquake summary poster for November 18, 2017, Milin, Tibet, MS6.9 earthquake[EB/OL]. [2018-04-20]. http://www.cea-igp.ac.cn/tpxw/276003.html (in Chinese).
郑钰,杨建思. 2008. 双差算法的剖析及参数对定位的影响[J]. 地震地磁观测与研究,29(3):85–93. doi: 10.3969/j.issn.1003-3246.2008.03.016 Zheng Y,Yang J S. 2008. Analysis of double-difference algorithm and the affect of its parameter in location[J]. Seismological and Geomagnetic Observation and Research,29(3):85–93 (in Chinese).
Aki K. 1965. Maximum likelihood estimate of b in the formula logN=a-bM and its confidence limits[J]. Bull Seismol Soc Am,43:237–239.
Amitrano D. 2003. Brittle-ductile transition and associated seismicity:Experimental and numerical studies and relationship with the b value[J]. J Geophys Res,108(B1):ESE 19-1–ESE 19-15.
Dziewonski A M,Chou T A,Woodhouse J H. 1981. Determination of earthquake source parameters from waveform data for studies of global and regional seismicity[J]. J Geophys Res,86:2825–2852. doi: 10.1029/JB086iB04p02825
Ekström G,Nettles M,Dziewonski A M. 2012. The global CMT project 2004−2010:Centroid-moment tensors for 13 017 earthquakes[J]. Phys Earth Planet Inter,200:1–9.
Frohlich C,Davis S D. 1993. Teleseismic b values;Or,much ado about 1.0[J]. J Geophys Res,98(B1):631–644. doi: 10.1029/92JB01891
Gupta H K. 2002. A review of recent studies of triggered earthquakes by artificial water reservoirs with special emphasis on earthquakes in Koyna,India[J]. Earth-Sci Rev,58(3/4):279–310.
Gutenberg B, Richter C F. 1954. Seismicity of the Earth and Associated Phenomena[M]. 2nd ed. Princeton: Princeton University Press: 1–310.
Mogi K. 1962. Study of elastic shocks caused by the fracture of heterogeneous materials and its relations to earthquake phenomena[J]. Bull Earthq Res Inst,Univ Tokyo,40(1):125–173.
Mogi K. 1967. Regional variations in magnitude-frequency relation of earthquakes[J]. Bull Earthq Res Inst,Univ Tokyo,45(2):313–325.
Nakaya S. 2006. Spatio-temporal variation in b value within the subducting slab prior to the 2003 Tokachi-Oki earthquake (M8.0),Japan[J]. J Geophys Res,111(B3):B03311.
Nuannin P,Kulhánek O,Persson L. 2012. Variations of b-values preceding large earthquakes in the Andaman-Sumatra subduction zone[J]. J Asian Earth Sci,61:237–242. doi: 10.1016/j.jseaes.2012.10.013
Papazachos B C. 1974. Dependence of the seismic parameter b on the magnitude range[J]. Pure Appl Geophys,112(6):1059–1065. doi: 10.1007/BF00881508
Rydelek P A,Sacks I S. 1989. Testing the completeness of earthquake catalogues and the hypothesis of self-similarity[J]. Nature,337(6204):251–253. doi: 10.1038/337251a0
Scholz C H. 1968. The frequency-magnitude relation of microfracturing in rock and its relation to earthquakes[J]. Bull Seismol Soc Am,58(9):399–415.
Schorlemmer D,Wiemer S,Wyss M,Jackson D D. 2004. Earthquake statistics at Parkfield:2. Probabilistic forecasting and testing[J]. J Geophys Res,109(B12):B12308. doi: 10.1029/2004JB003235
Schorlemmer D,Wiemer S,Wyss M. 2005. Variations in earthquake-size distribution across different stress regimes[J]. Nature,434(7058):539–542.
Shi Y L,Bolt B A. 1982. The standard error of the magnitude-frequency b value[J]. Bull Seismol Soc Am,72(5):1677–1687.
Smith W D. 1981. The b-value as an earthquake precursor[J]. Nature,289(5794):136–139. doi: 10.1038/289136a0
Waldhauser F,Ellsworth W L. 2000. A double-difference earthquake location algorithm:Method and application to the northern Hayward fault,California[J]. Bull Seismol Soc Am,90(6):1353–1368. doi: 10.1785/0120000006
Waldhauser F,Ellsworth W L. 2002. Fault structure and mechanics of the Hayward fault,California,from double-difference earthquake locations[J]. J Geophys Res,107(B3):ESE 3-1–ESE 3-15.
Wiemer S,Katsumata K. 1999. Spatial variability of seismicity parameters in aftershock zones[J]. J Geophys Res,104(B6):13135–13151. doi: 10.1029/1999JB900032
Wiemer S,Wyss M. 2000. Minimum magnitude of completeness in earthquake catalogs:Examples from Alaska,the western United States,and Japan[J]. Bull Seismol Soc Am,90(4):859–869. doi: 10.1785/0119990114
Wiemer S,Gerstenberge M,Hauksson E. 2002. Properties of the aftershock sequence of the 1999 MW7.1 Hector Mine earthquake:Implications for aftershock hazard[J]. Bull Seismol Soc Am,90(4):1227–1240.
Xu Z Q,Ji S C,Cai Z H,Zeng L S,Geng Q R,Cao H. 2012. Kinematics and dynamics of the Namche Barwa Syntaxis,eastern Himalaya:Constraints from deformation,fabrics and geochronology[J]. Gondwana Res,21(1):19–36. doi: 10.1016/j.gr.2011.06.010
Zeitler P K, Meltzer A S, Brown L, Kidd W S F, Lim C, Enkelmann E. 2014. Tectonics and topographic evolution of Namche Barwa and the easternmost Lhasa block, Tibet[G]//Toward an Improved Understanding of Uplift Mechanisms and the Elevation History of the Tibetan Plateau. Colorado: Geological Society of America, 507: 23–58.

 下载:
下载:


计量
- 文章访问数: 2086
- HTML全文浏览量: 1212
- PDF下载量: 127
