

Spatial distribution characteristics of soil radon in the southern Tangyin graben
-
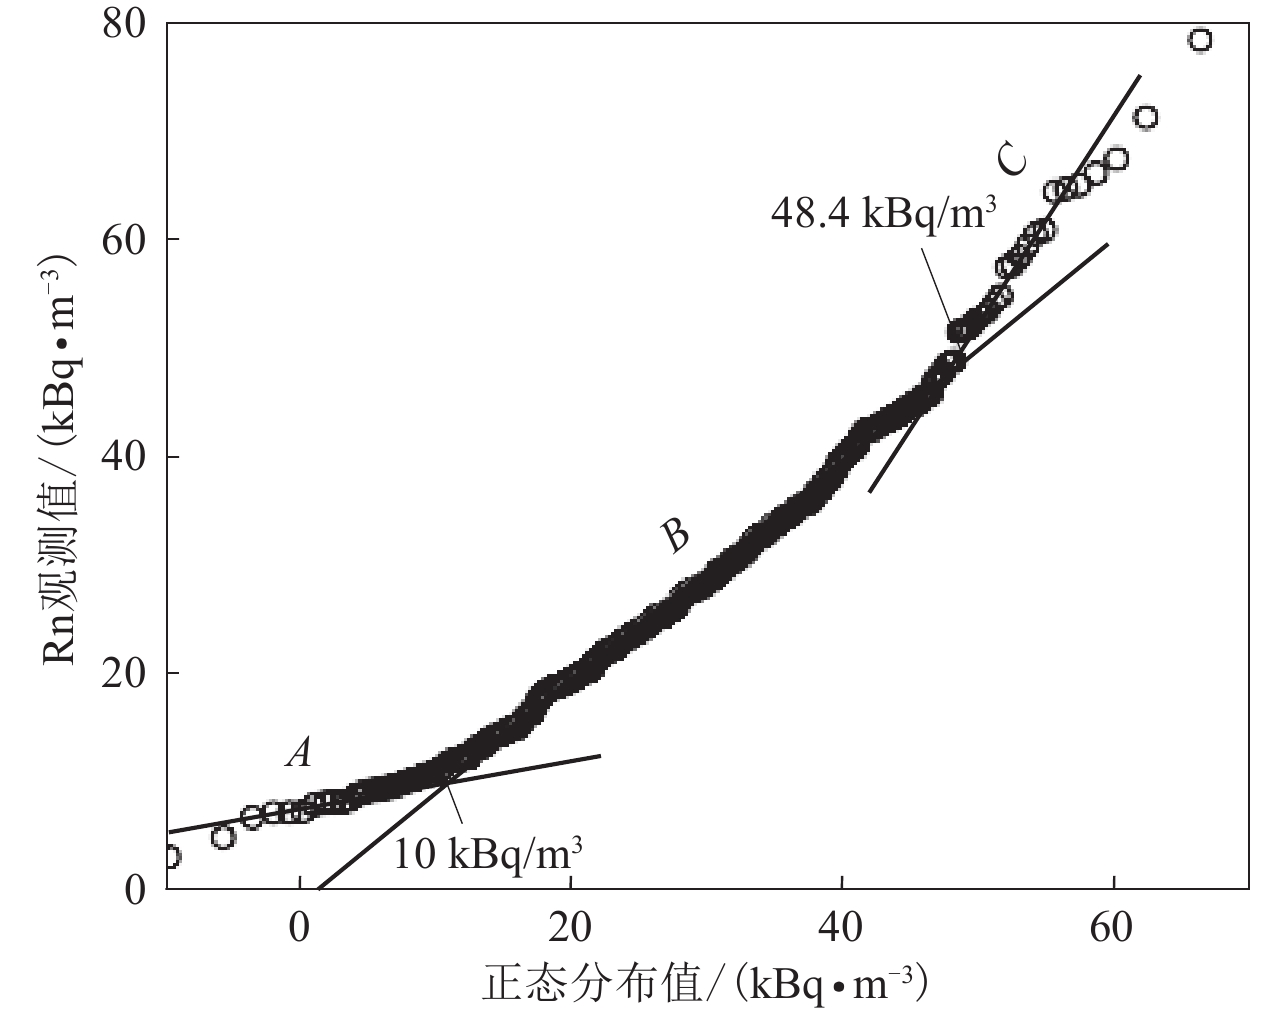
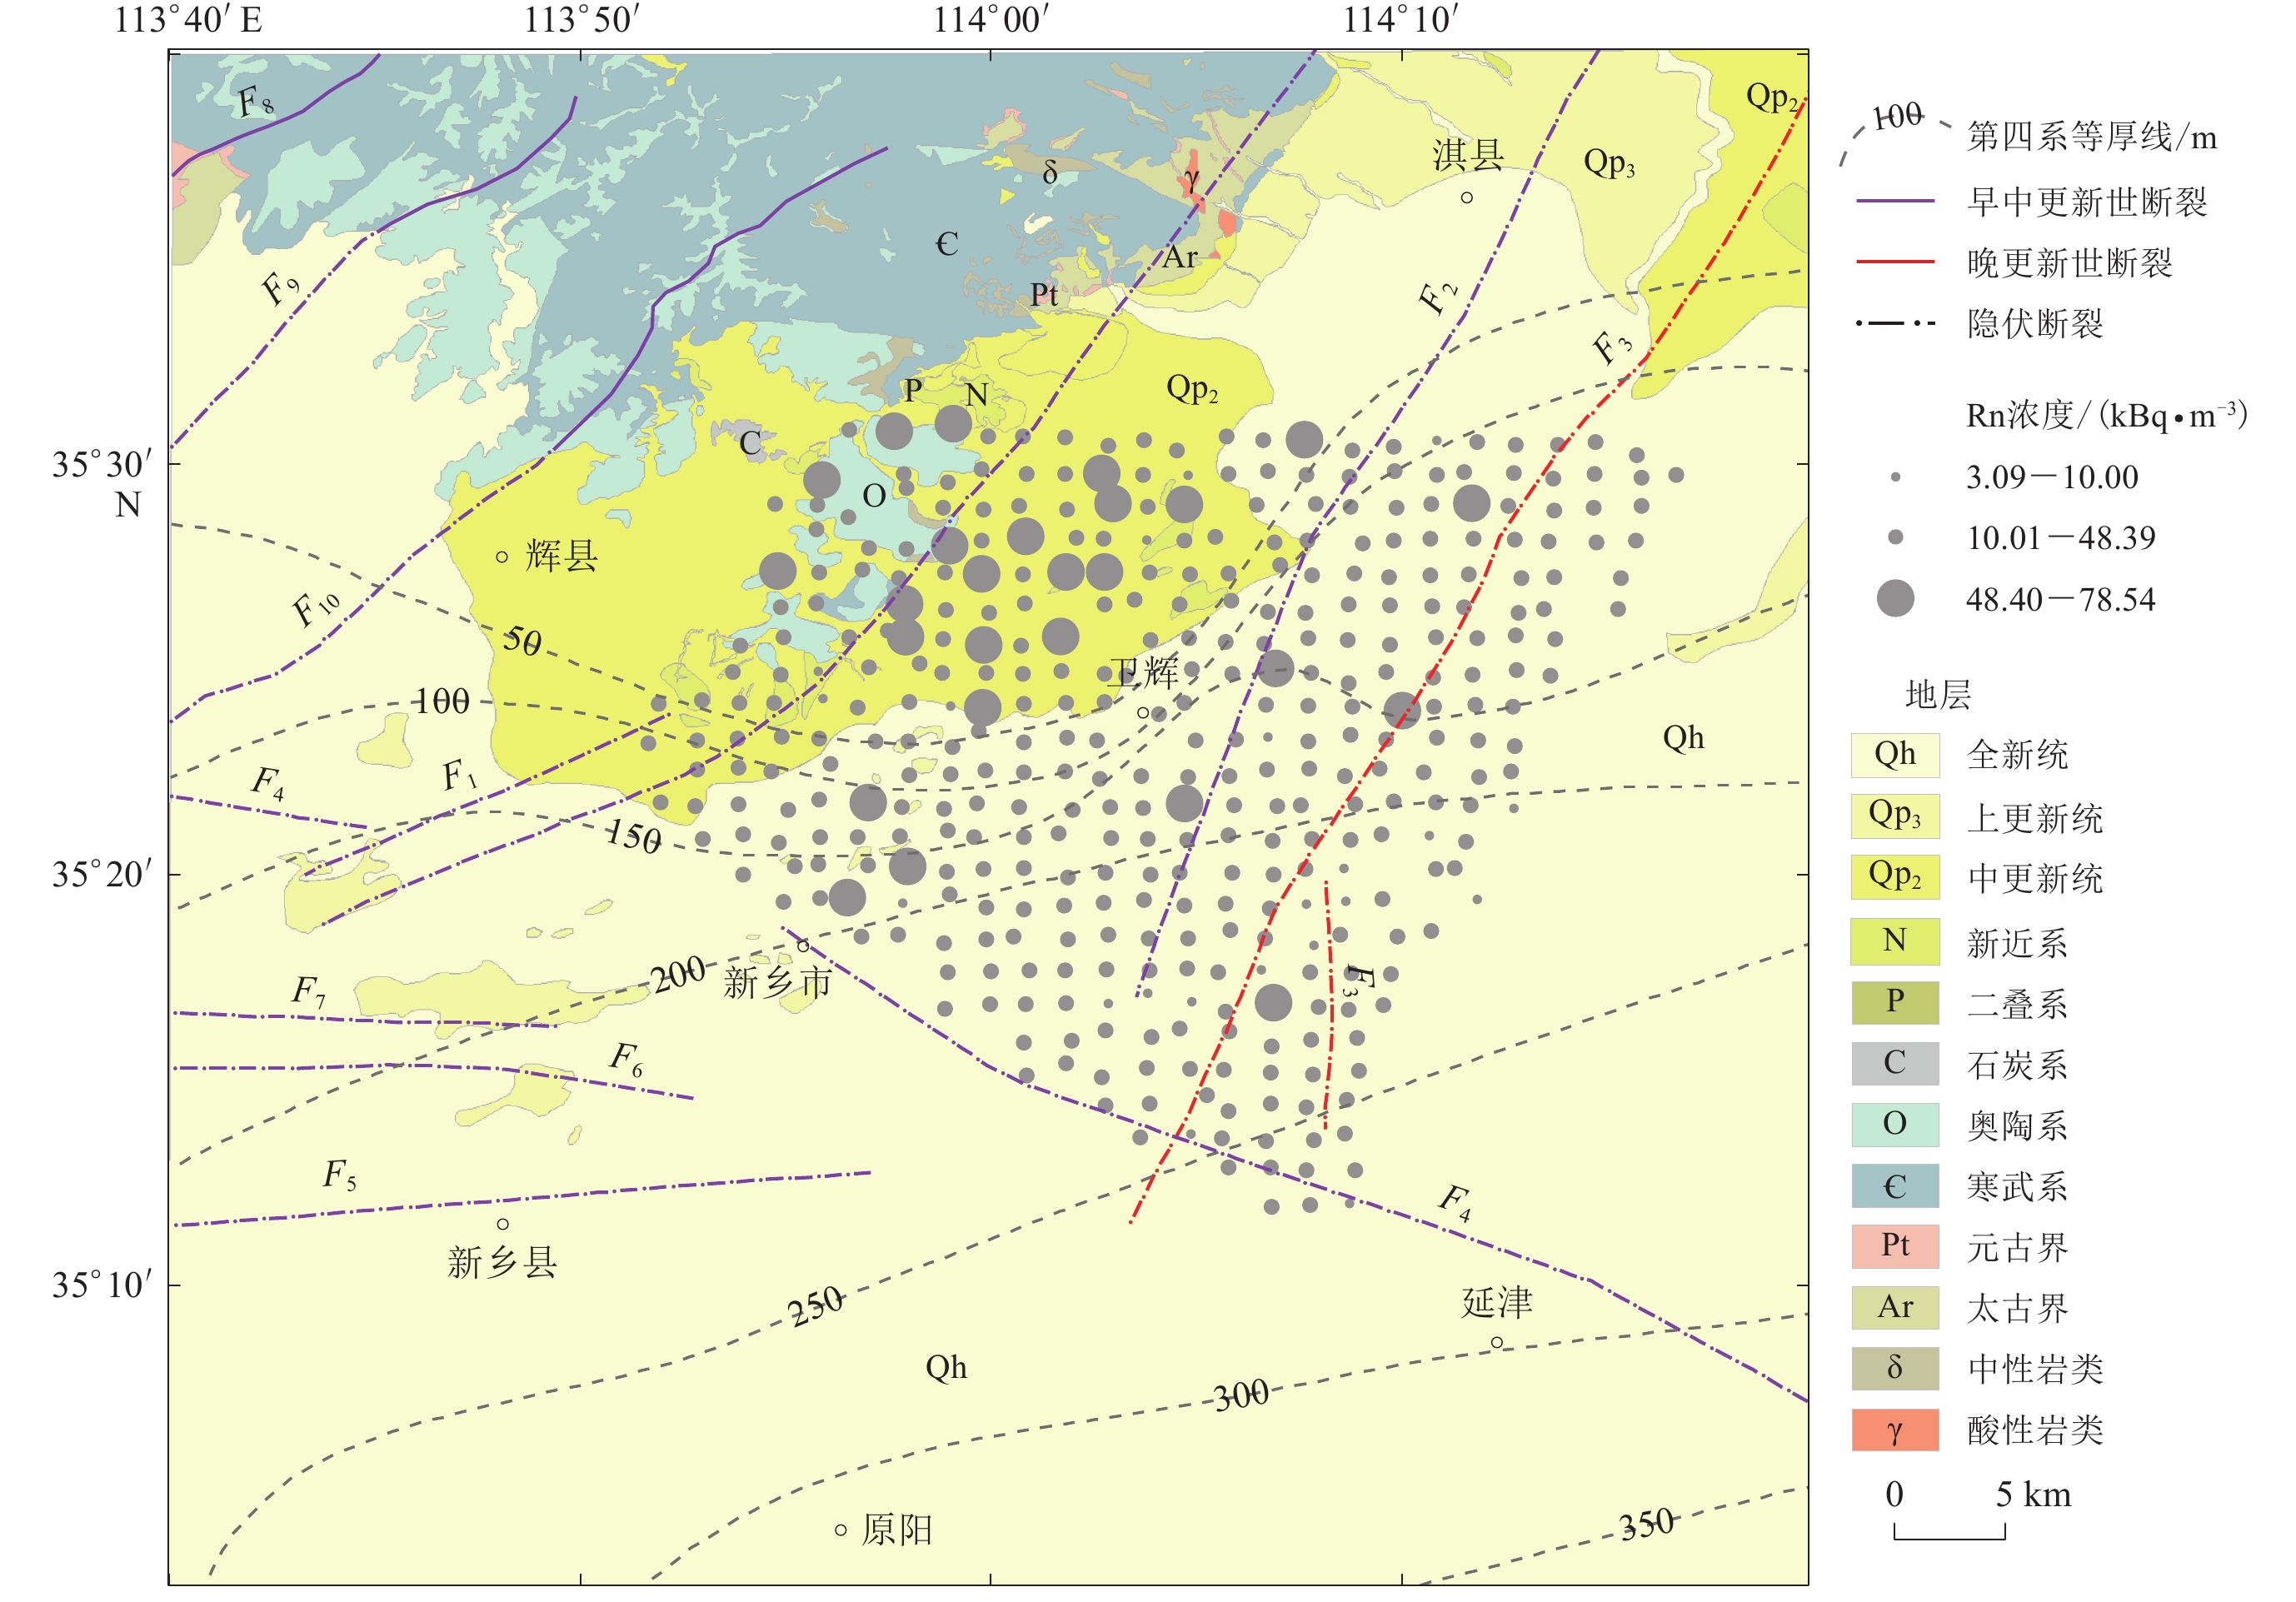
摘要: 为分析汤阴地堑南部土壤Rn空间分布特征,揭示其与断裂构造、岩性及沉积层厚度之间的联系,本文采用网格化布点野外流动观测方法测定了该地区380个点的土壤Rn浓度,结果表明:汤阴地堑土壤Rn浓度介于3.09—78.54 kBq/m3,背景均值为27.22 kBq/m3,异常阈值下限为48.40 kBq/m3。在空间分布上,研究区西部(以第四系等厚线50 m为界),受岩石单元和人类石料开采活动的影响,Rn浓度背景值高于东部。在西部高浓度背景影响下,Rn浓度高值异常点除沿汤西断裂带分布外,还沿断裂带外围呈斑块状分布,断裂带对气体释放的控制作用在一定程度上被掩盖。而东部地区,覆盖层较厚,Rn浓度背景值较低,部分高值异常点主要沿汤中和汤东断裂带分布,显示出构造对气体迁移的控制作用;另一部分高值异常点与第四系等厚线近似平行,呈条带分布,推测新乡—卫辉间存在一条规模较大的隐伏断裂。此外,研究区主要断裂带的Rn异常衬度表现为汤东断裂带高于汤西和汤中断裂带。结合研究区地质背景和深部孕震环境认为,该Rn异常衬度表现是汤阴地堑南部构造活动背景的反映。因此,研究区土壤Rn浓度空间分布主要受断裂构造、岩性、沉积层厚度以及人类活动的影响,气体异常衬度主要受汤阴地堑南部构造活动背景的控制。土壤Rn浓度能够有效地用于汤东活动断裂带的构造活动监测,而对位于隆起区与沉降区的过渡地带、断裂局部出露于地表,且受人类活动影响较大的汤西断裂带则需充分考虑环境背景的影响。Abstract: This paper discussed the spatial distribution characteristics of radon in the soil gas and their relationship with faults, geological structures, lithology, and sediment thickness based on the radon concentrations obtained by the field mobile measurement at the gridding layout observation points in the southern Tangyin graben. The measurements showed that the soil radon concentrations in the Tangyin graben varied from 3.09 to 78.54 kBq/m3 with a mean value of 27.22 kBq/m3, and the anomalous threshold was 48.40 kBq/m3. Spatially, the studied area was divided into two parts based on the contour of Quaternary system (50 m thickness), the distribution characteristics of soil gas presented that radon background concentrations were higher in western region than that in eastern evidently because of the difference of lithology units made up the local strata and the influence of human mining activity. Accordingly, the radon concentration anomalies of soil gas in western region were patchily scattered on the periphery of Tangxi fault belt besides of distributed along the fault belt itself. Nevertheless, in eastern region, the most of radon concentration anomalies mainly presented along Tangzhong and Tangdong fault belts. Similarly, the contours map of radon concentrations also indicated the azimuth of concentration anomalous belts were consistent with the strike of Tangzhong and Tangdong faults in east region, which implied the emanation of deep-seated source gas was controlled by fault structures. In addition, the radon concentrations contours map also suggested there was a radon anomalous band of NE strike that was almost parallel to contours of local Quaternary system thickness, by which we speculated there was a buried fault. Furthermore, in this studied area, though the release intensity of soil radon in the western part was significantly higher than that in the middle-eastern part, the radon concentrations anomalous extent showed a trend of increasing from west to east, which revealed that the Tangdong fault was more active than others. The comprehensive analysis indicated that the spatial distribution of soil radon concentrations was mainly controlled by fault structures, lithology formation, thickness of sedimentary layer, and human mining activities, and variations of radon concentrations were mainly dominated by the background tectonic activity of southern Tangyin graben. Our results imply that soil radon is an effective indicator for tectonic activity observation of Tangdong fault. While it is appiled to Tangxi fault which is located in the transition region between the uplift and the subsidence the influence of environmental background needs to be fully considered, because of the impact of bedrock cropping out partially and human mining activities.
-
Keywords:
- soil radon concentrations /
- spatial distribution /
- fault belts /
- tectonic activity /
- Tangyin graben
-
引言
华北地区不仅是我国的政治、经济和文化中心,也是陆内中强地震的易发区(柳畅等,2012;毕金孟,蒋长胜,2019)。近代以来,该区先后发生了1966年邢台MS7.2和1976年唐山MS7.8等破坏性地震,这些事件均造成了大量的人员伤亡和财产损失。因此,若要从根源上降低该地区的地震灾害风险水平,关键是提升地震短临预测预报的能力,而这在很大程度上取决于对地震前兆的识别和捕捉能力。目前,在地震地下水监测研究方面,已有不少学者采用经验、统计和数值等方法对华北地区井水位异常变化的成因进行了深入的研究,其结果显示,在中强地震前的数小时或数天,前兆场中的一些观测井水位会出现短时突跳或高频脉冲等现象(李文英等,1994;张国民等,1995;车用太等,2006)。对于地震预测预报业务而言,此类短时波动异常具有一定的前兆指示价值。然而,需要警惕的是,一些极端天气事件,如风暴(Das et al,2021)、热带气旋(顾申宜等,2012)、飑线或雷暴(董守玉等,1987;张凌空等,2012)等亦能引起类似的异常变化。因此,如何即时地、客观地甄别不同尺度极端天气所导致的单井或群井水位的短时突变,是当前地震地下水观测亟需解决的现实问题。
在各种极端天气中,飑线是一种常见且破坏力很强的中尺度强对流天气(丁一汇等,1982;Meng et al,2013;俞小鼎,郑永光,2020),它是由许多雷暴单体排列成一条线或带状的传播性对流系统,其水平传播速度较快,通常约为数十千米每小时,典型生命史为2—12小时;在水平尺度和短轴结构上,该天气系统长约几十至上百千米,宽约数十千米(庄薇等,2010;沈杭锋等,2019;盛杰等,2020),由飑前低压、雷暴高压和尾流低压等三大部分构成。飑线过境时,地面气象要素会发生瞬时急剧变化,如气压涌升、气温骤降等。此外,还会伴有雷暴、大风、冰雹和龙卷风等。另外,飑的定义特指2 min时段的平均风速不小于8 m/s的大风现象(俞小鼎,郑永光,2020)。
华北地处温带大陆性气候带和温带季风气候带,大陆性、海洋性季风气流交汇于此,故而是我国飑线的高发区(赵亚民,魏文秀,1984;扈忠慈等,1987;李鸿洲等,1999;盛杰等,2020;陈晓欣等,2022)。近年来,已有学者注意到华北地区短时气压骤升所引起的区域性井水位波动现象,例如:张子广等(2010)揭示出河北黄骅、深州、无极、宁晋、永年等五口深井频繁受到气压的瞬时扰动;韩文英等(2017)也发现类似的现象。但遗憾的是,他们并未认识到飑线才是其背后真正的动力源(王宏等,2009;盛杰等,2020)。那么,飑线对华北地区深井水位影响的特征究竟如何?截至目前,尚缺乏富有针对性的典型个例研究。
2017年9月21日18时至23时(北京时间,下同),华北中部爆发了一次强飑线天气过程(杨晓亮,杨敏,2020),区内四口深井水位陆续记录到了较典型的短时扰动变化,这为揭示飑线影响的全貌提供了绝佳的实例。鉴于此,本文拟对此飑线引起的深井水位变化进行系统诊断,以加深对飑线干扰的科学认知,为井-含水层系统对高频带(f >8 cpd,cpd指周期数/天)气压响应的传递函数计算等提供更高信噪比的输入和输出信号(Lai et al,2013;Zhang et al,2016;Sun,Xiang,2020)。
1. 飑线演变和传播过程
卫星云图和多普勒天气雷达等资料(杨晓亮,杨敏,2020)显示,2017年9月21日18时至23时,华北中部地区出现了一次以雷暴大风为主、近北东走向(水平长轴)的飑线天气过程。在从西北向东南移动的过程中,该飑线逐渐发展壮大,并于21时前后达到鼎盛,此时一条相对完整的飑线系统趋于成熟,其水平长度近250 km,宽度达30—40 km,回波强度也超过了50 dBZ;23时之后,飑线强度逐渐减弱(图1)。图1中红色虚线为飑线逐小时的大体位置(杨晓亮,杨敏,2020),该飑线主体的平均传播速度约为60 km/h,并伴有八级以上瞬时地面大风(风速多为18—20 m/s),先后影响了华北中部多个地区,同时还造成了石家庄、保定、衡水等地的人员伤亡和财产受损。
![]() 图 1 2017年9月21日飑线主体的演变过程(杨晓亮,杨敏,2020)以及华北地区深井和气象站的分布Figure 1. The passage of the squall line on 21 September 2017 (Yang,Yang,2020) and distribution of deep wells (black triangles) and meteorological stations (green triangles) in North China
图 1 2017年9月21日飑线主体的演变过程(杨晓亮,杨敏,2020)以及华北地区深井和气象站的分布Figure 1. The passage of the squall line on 21 September 2017 (Yang,Yang,2020) and distribution of deep wells (black triangles) and meteorological stations (green triangles) in North China总体来看,此次飑线具有能量强、移速快、影响范围广和致灾性强等特征,其生成的天气形势和动力学背景详见杨晓亮和杨敏(2020)的研究。
2. 观测井及仪器概况
考虑到飑线影响的范围和深井水位记录的完整性等因素,本文最终选取出河北地区的四口深井,即无极、辛集、永清和宁晋井,作为研究对象。另外,为了表征深井所在地或周边当日降雨量的大小,本研究也通过中央气象数据网(http://data.cma.cn)获取了与观测井较近的三个气象站,即石家庄站、霸州站和南宫站,的降雨数据。
四口井的深度、套管直径、承压性和含水层岩性等基础信息详见表1,从表中可见:这四口井的深度均超过了
1000 m,其中宁晋井深达2 984.50 m;滤管埋深也较深,均不浅于1070 m,且观测含水层基本不受降雨或地表水直接入渗的影响;含水层类型主要以岩溶承压水或岩溶裂隙承压水为主,含水层岩性则以白云岩为主;整体而言,各井具有承压性好、封闭性高和深度深等特征(张子广等,2005,2010);各井安装的水位仪为ZKGD-3000NL型号,气压仪和气温仪为RTP-Ⅱ型号,这些仪器的采样间隔均为1 min,其分辨率依次优于1 mm、0.1 hPa和0.01℃。由于2017年9月21日的飑线为“干对流”型,所以各气象站记录到的降雨量均未超过1.2 mm。表 1 四口深井及其周邻气象站概况Table 1. General information for the four deep wells and three neighboring meteorological stations井名 套管
直径
/cm地下水类型 井深/m 井孔与含水层
连通深度
/m含水层岩性 水位仪、气压仪
和气温仪的型号相邻
气象站与气象
站间距
/km2017年9月
21日降雨量
/mm无极 不详 岩溶裂隙承压水 2984.50 2333 —2984 灰岩,白云岩 ZKGD-3000NL,
RTP-Ⅱ石家庄 53 1.2 辛集 24.45 岩溶裂隙承压水 2052.37 1539 —2052 白云岩 石家庄 67 1.2 永清 21.60 岩溶承压水 1274.11 1070 —1274 灰岩,白云岩 霸州 12 0.0 宁晋 30.00 岩溶裂隙承压水 2003.78 1899—1919 砂质灰岩 南宫 7 0.0 3. 飑线对深井水位影响的宏观特征与机制
在此次飑线演变及传播过程中,上述四口深井的静水位、户外气压和气温等测项均较好地记录了该极端天气系统的扰动形态。为了真实地呈现扰动的原始形貌,本文特意选取2017年9月21—22日的分钟级测值,各测项的变化曲线如图2所示。从图中大致能概观出以下特征:① 当飑线途经各深井时,气压和气温相应出现了快速涌升和大幅陡降的鲜明变化,毫无疑问,这与飑线过境时地面气象要素场的典型特征十分吻合;② 静水位与气压同步出现了脉冲状波动。
![]() 图 2 飑线过境时各井记录到的静水位、气压和气温的原始变化(a) 无极井;(b) 辛集井;(c) 永清井;(d) 宁晋井Figure 2. The original changes of groundwater levels (black traces),barometric pressures (green traces),and air temperatures (red traces) in response to the passage of the squall line (denoted by blue stripe) for the four wells(a) Wuji well;(b) Xinji well;(c) Yongqing well;(d) Ningjin well
图 2 飑线过境时各井记录到的静水位、气压和气温的原始变化(a) 无极井;(b) 辛集井;(c) 永清井;(d) 宁晋井Figure 2. The original changes of groundwater levels (black traces),barometric pressures (green traces),and air temperatures (red traces) in response to the passage of the squall line (denoted by blue stripe) for the four wells(a) Wuji well;(b) Xinji well;(c) Yongqing well;(d) Ningjin well考虑到图2所绘曲线的时段较长,而飑线的影响过程又相对较短,所以图2还不足以充分展示飑线扰动中的细节变化。为此,本研究特截取9月21日18时至24时的观测曲线;此外,为了更真实地展现和统计静水位和气压的瞬时变化,采用4阶巴特沃斯(Butterworth)高通滤波器(f>6 cpd)对静水位和气压进行了无相移滤波,此步骤旨在消除潮汐及大气潮效应。需要指出的是,在对飑线影响的起始和结束时刻进行界定时,主要是以气压、气温和井水位三者协同响应的时刻为标度。经上述预处理后,即可对飑线干扰的量级和形态等进行初步诊断,结果如图3和表2所示。
![]() 图 3 2017年9月21日18—24时各测项对飑线过境时响应的细节特征蓝色垂直虚线表示飑线影响的起始和结束时刻;①,②和③依次表示飑前低压、雷暴高压和尾流低压时段。 (a) 无极井;(b) 辛集井;(c) 永清井;(d) 宁晋井Figure 3. The detailed variations of groundwater levels (black traces),barometric pressures (green traces),and air temperatures (red traces) in response to the passage of the squall line from 18:00 to 24:00 on 21 September 2017 for the four wellsThe blue vertical dashed lines represent the start (left) and end (right) times of the passage of squall line,respectively. The green short thick-lines with signs of ①,②,and ③ indicate the pre-squall mesolow,a squall mesohigh,and a wake low,respectively. (a) Wuji well;(b) Xinji well;(c) Yongqing well;(d) Ningjin well表 2 四口深井的水位、气压和气温对飑线过程的响应变化Table 2. Temporal variations of groundwater levels,barometric pressures,and air temperatures in response to the passage of the squall line for the four deep wells
图 3 2017年9月21日18—24时各测项对飑线过境时响应的细节特征蓝色垂直虚线表示飑线影响的起始和结束时刻;①,②和③依次表示飑前低压、雷暴高压和尾流低压时段。 (a) 无极井;(b) 辛集井;(c) 永清井;(d) 宁晋井Figure 3. The detailed variations of groundwater levels (black traces),barometric pressures (green traces),and air temperatures (red traces) in response to the passage of the squall line from 18:00 to 24:00 on 21 September 2017 for the four wellsThe blue vertical dashed lines represent the start (left) and end (right) times of the passage of squall line,respectively. The green short thick-lines with signs of ①,②,and ③ indicate the pre-squall mesolow,a squall mesohigh,and a wake low,respectively. (a) Wuji well;(b) Xinji well;(c) Yongqing well;(d) Ningjin well表 2 四口深井的水位、气压和气温对飑线过程的响应变化Table 2. Temporal variations of groundwater levels,barometric pressures,and air temperatures in response to the passage of the squall line for the four deep wells井名 观测
物理量飑线演变的主过程 变化形态 最大变幅 开始时刻
h:min峰值时刻
h:min结束时刻
h:min历时/min 无极 静水位 19:09 20:00 20:42 93 脉冲状 10 mm 气压 20:13 涌升 1.3 hPa 气温 20:39 骤降 8.5 ℃ 辛集 静水位 19:48 20:40 21:27 99 脉冲状 18 mm 气压 20:40 涌升 2.3 hPa 气温 21:27 骤降 7.0 ℃ 永清 静水位 20:10 21:17 22:17 127 脉冲状 13 mm 气压 21:16 涌升 1.5 hPa 气温 22:17 骤降 5.4 ℃ 宁晋 静水位 19:54 20:59 21:36 102 脉冲状 12 mm 气压 20:49 涌升 2.6 hPa 气温 21:36 骤降 7.2 ℃ 3.1 飑线对气压、气温和深井水位影响的特征分析
从图3可以清楚地看到,四口井同一测项的扰动形态极具共性。首先以气压为例,在飑线经过时,不同深井的气压扰动主要包含了三个子过程:即降压—升压—降压(图3中①,②和③所注时段),在直观上“勾勒”出了飑线短轴水平气压场的特点;而各子过程的生成机制,则是飑前低压、雷暴高压和尾流低压等相继作用。就宏观形态来讲,气压起伏基本上是遵循了“雷暴鼻”或“高压泡”的演变历程(赵虹等,2020)。相比之下,气温变化就颇为单调,均以大幅骤降为主。再细观静水位,便能清晰地发现深井水位(图3中灰色曲线)会随气压(图3中绿色曲线)的剧烈起伏而大幅波动,二者的相位却截然相反。
在定性地刻画飑线的扰动形态后,表2又进一步给出了地面气象要素和深井水位扰动的量值。基于此,本文对其大小及差异等进行初步剖析,具体如下:
1) 气温。四个深井所在场地的气温陡降量主要集中在5.4—8.5℃,其中无极井最大,永清井最小。
2) 气压。在飑线的主体或高能阶段,即雷暴高压区(图3中的②阶段),各深井处的气压涌升速率和增幅均尤为显著,其中宁晋井在26 min内便上升了大约2.6 hPa,相比之下,无极井和永清井的增压略小,分别约为1.3 hPa和1.5 hPa。造成这两地气压涌升量偏小的原因可能如下:① 在20时左右,飑线仍处于发展壮大阶段(图1),雷暴高压区的强度相应偏弱,所以在过境无极井时,尚不足以造成大幅的气压涌升;② 永清井位于飑线主体结构的外围(图1),故遭受干扰的程度小一些。有趣的是,除宁晋井外,其余三井气压涌升的峰值时刻与飑线过境的时刻大致吻合(对照图1和表2),足见飑线在演变过程中会造成气压场大范围出现“迁移”性波动。再仔细观察22时飑线的位置和宁晋井气压涌升的峰值时刻(20:49)(见图1和图3d),可以看出二者相差近70 min,这其中一个重要的原因,可能是在飑线过境之前,当地已有个别雷暴单体被触发或新生。
3) 静水位。各深井水位波动的幅度(峰、谷值之差)较大,均不小于10 mm,其中辛集井高达约18 mm,其余次之。
4) 干扰持时。通过标度地面气象要素和各深井水位响应的启动和停歇时刻,大致能度量出飑线对单口深井干扰的持时,从现有的统计样本来看,这个扰动过程能持续93—127 min(表2)。持时的长短主要取决于飑线演进过程中的水平尺度、空间强度和移动速度等因素。
基于以上定性分析和量化统计的结果,飑线对各地气压、气温和深井水位等干扰的特征已较为明显。另外,各深井响应的时间、空间和强度等特征也在一定程度上表征了此次飑线系统演变中的强度变化等。就响应机理而言,导致深井水位呈脉冲状波动的物理主因是什么,这无疑是一个值得探究的问题,本文将作进一步的解析。
3.2 飑线对深井水位影响的机制分析
如前所述,飑线在传播和过境时,会引起地面气压和气温的短时骤变。从表2的统计结果来看,气温的降幅固然较大,但首先可以将该影响因素排除;在数小时的时间尺度内,气温波动的穿透或热传导深度十分有限(尹凤玲等,2015),所以无法在上千米深的含水层内产生热应力。
接下来,再对滤波后的气压和静水位变化(图3中的绿色和灰色曲线)进行对比,可以清楚地看到,二者在时域内具有十分显著的负相关关系,其内在的物理机制,已有大量而深入的成因诊断(张昭栋等,1989a;张子广等,2010;顾申宜等,2012)。这些诊断结果表明,二者之所以能构成负相关关系(对于承压井而言),主要是因为气压波作用于井-含水层系统时,井孔与含水层之间产生压力差。当气压上升时,井孔内的水头压力随之增大,井孔内水头压力大于含水层中的水头压力,这使得井孔内水体向含水层的渗入量大于含水层向井孔内的渗入量,这样井水位测值就出现下降;同理,当气压下降时,井孔内的水头压力会下降,那么由含水层向井孔内的入渗量便会增加,井孔水头也就升高了。
综上分析可知,飑线过程中的瞬时气压突变是导致深井水位短时波动的主因。
4. 高频段深井水位的气压效应诊断
在正常天气背景下,高频气压波的能量通常比较微弱,相应地,井-含水层系统的响应量也十分有限,因此,如何提升高频气压响应的可靠性一直都是地震地下流体研究中的一大难点。
单从图3所示的气压高通滤波(f >6 cpd)的初步结果来看,在飑线干扰期间,高频气压脉冲或周期波动的振幅会显著“涌升”,该现象也意味着短周期气压激励的强度在大幅提升,由此可见,借助飑线来揭示深井水位的高频气压响应,不失为一种良策。那么,飑线过境时的短周期气压波动,究竟会造成无极、辛集、永清和宁晋井怎样的水力响应(气压系数和相位差)呢?
为解答该问题,本文首先采用时频方法来提取高频气压波的主频段,结果如图4所示。可见:在频域内,各井的振幅谱稍显差异,但共性特征却十分鲜明,即优势频段主要集中在15—25 cpd (对应周期为57.6—96.0 min)。为考察此频段内深井水位和气压的变化特征,进一步采用四阶巴特沃斯滤波器对二者进行无相移的带通滤波(图5)。需要说明的是,图5仅绘制了9月21日12时至22日6时的滤波结果,其目的主要是为了更清楚地展示井水位和气压的波动特征。对比各井曲线的形态和相位可以发现两者波形甚为相似,均呈高度负相关。为了定量地刻画其关联度,利用互相关函数计算气压与井水位间的相关系数和滞后时间,其中井水位滞后或超前气压的时长主要依据相关系数的最小值而定,各井结果如图6和表3所示。
![]() 图 4 飑线过境时各井气压高频振荡的时频图(a) 无极井;(b) 辛集井;(c) 永清井;(d) 宁晋井Figure 4. Spectrograms of the high-frequency fluctuations of barometric pressures caused by the squall line(a) Wuji well;(b) Xinji well;(c) Yongqing well;(d) Ningjin well
图 4 飑线过境时各井气压高频振荡的时频图(a) 无极井;(b) 辛集井;(c) 永清井;(d) 宁晋井Figure 4. Spectrograms of the high-frequency fluctuations of barometric pressures caused by the squall line(a) Wuji well;(b) Xinji well;(c) Yongqing well;(d) Ningjin well![]() 图 5 在15—25 cpd频段内各深井的水位和气压波曲线对比(a) 无极井;(b) 辛集井;(c) 永清井;(d) 宁晋井Figure 5. Detailed comparison of the fluctuations of groundwater levels (red lines) with barometric pressure changes (green lines) as a squall line passed the four deep wells(a) Wuji well;(b) Xinji well;(c) Yongqing well;(d) Ningjin well
图 5 在15—25 cpd频段内各深井的水位和气压波曲线对比(a) 无极井;(b) 辛集井;(c) 永清井;(d) 宁晋井Figure 5. Detailed comparison of the fluctuations of groundwater levels (red lines) with barometric pressure changes (green lines) as a squall line passed the four deep wells(a) Wuji well;(b) Xinji well;(c) Yongqing well;(d) Ningjin well![]() 图 6 15—25 cpd频段内各深井的水位与气压的互相关系数滞后时间为正,表示水位滞后气压,反之为超前Figure 6. The cross-correlation coefficients between the band-pass filtered (15−25 cpd) groundwater levels and barometric pressures for the deep wellsThe negative lag time means that groundwater level advances the barometric pressure,while the positive lag time means the groundwater level lags behind the barometric pressure表 3 各深井水位与气压在15—25 cpd频段内的相关系数及时滞Table 3. The cross-correlation coefficients between the 15−25 cpd band-passed groundwater levels and barometric pressures for the four deep wells as well as corresponding time delays
图 6 15—25 cpd频段内各深井的水位与气压的互相关系数滞后时间为正,表示水位滞后气压,反之为超前Figure 6. The cross-correlation coefficients between the band-pass filtered (15−25 cpd) groundwater levels and barometric pressures for the deep wellsThe negative lag time means that groundwater level advances the barometric pressure,while the positive lag time means the groundwater level lags behind the barometric pressure表 3 各深井水位与气压在15—25 cpd频段内的相关系数及时滞Table 3. The cross-correlation coefficients between the 15−25 cpd band-passed groundwater levels and barometric pressures for the four deep wells as well as corresponding time delays井名 相关系数 井水位滞后气压的时间/min 井名 相关系数 井水位滞后气压的时间/min 无极 −0.956 01 −10 永清 −0.992 13 1 辛集 −0.994 12 −1 宁晋 −0.992 14 10 对比相关系数的大小,可见无极井稍低一点,为−0.956 01,其余三井则近乎完全负相关;对于时滞(即井水位与气压的相位差)而言,辛集井和永清井的很小,几乎为即时响应,说明这两口井含水层的导水系数可能较大(张昭栋等,1989a),而无极井和宁晋井则分别超前和滞后10 min。一般而言,含水层的导水系数越小,相位滞后也就越大,无极井为何会出现明显的相位超前现象呢?究其原因,可能是该井存在垂向渗流过程,即在高频气压的负荷下,含水层孔隙压力扩散进而导致水体向潜水层垂向流动(Roeloffs,1996;杨小林,危自根,2018)。
在确定各井的水位对气压响应的时滞后,将二者的相位进行校准,该步骤主要是为了在之后的一元线性回归分析中消除截距的影响。此外,考虑到飑线干扰期间内气压、井水位的信噪比更高,本文仅对图5中21日18时至24时的曲线进行回归拟合,得到一元线性方程。
这四口深井的水位与气压之间的回归方程如图7所示,可以看到:无极、辛集、永清这三口井的气压系数较高,依次为:−6.922 8 mm/hPa,−6.445 mm/hPa和−6.708 5 mm/hPa,这可能是由其含水层以下主要特质所致:① 导水系数较大;② 固体骨架体积压缩系数较小;③ 孔隙度较大;④ 含水层厚度大(张昭栋等,1989a,b,1993)。相比之下,宁晋井的气压系数偏小,为−4.926 4 mm/hPa,而这是否与其含水层厚度较薄有关(见表1),尚待更为系统的研究。
![]() 图 7 消除时滞效应后井水位与气压的一元线性回归方程(15—25 cpd频段内)(a) 无极井;(b) 辛集井;(c) 永清井;(d) 宁晋井Figure 7. The simple linear regression relationships between groundwater levels and barometric pressures after eliminating time delays in the 15−25 cpd frequency band(a) Wuji well;(b) Xinji well;(c) Yongqing well;(d) Ningjin well
图 7 消除时滞效应后井水位与气压的一元线性回归方程(15—25 cpd频段内)(a) 无极井;(b) 辛集井;(c) 永清井;(d) 宁晋井Figure 7. The simple linear regression relationships between groundwater levels and barometric pressures after eliminating time delays in the 15−25 cpd frequency band(a) Wuji well;(b) Xinji well;(c) Yongqing well;(d) Ningjin well总体来讲,在15—25 cpd频段内,这几口深井普遍存在较显著的气压效应。
5. 讨论与结论
以2017年9月21日发生在华北地区的飑线天气为实例,系统地诊断了该中尺度极端天气对无极、辛集、永清和宁晋等四口深井水位的干扰模式,初步揭示了各深井水位响应的共性和个性特征,得到的主要认识如下:
1) 此次飑线在其演进过程中对华北地区大范围的气压场产生了剧烈扰动,并由此导致了群体性的深井水位波动。各深井水位均能即时响应气压扰动,二者在形态、幅度和持续时间上均高度相关,具有确定的因果关系。
2) 在宏观上,气压和深井水位的变化特征以脉冲状为主,两者最大的变幅分别可达2.6 hPa和18 mm,而飑线干扰的持续时间亦长达127 min。
3) 在15—25 cpd频段内,各深井水位与气压高度负相关,相关系数均在−0.95以下,前者对后者响应的滞后时间在±10 min以内。此外,气压系数主要集中在−4.9—−6.9 mm/hPa之间。
飑线对华北地区深井水位的干扰是普遍而显著的,但本研究仅是对个例进行了尝试性的初探,相关认识尚浅且难以普适。因此,深入和系统地诊断华北乃至全国范围内飑线干扰的全貌和机理,是本研究后续将要重点开展的工作。就深井水位对短周期气压响应的相位滞后或超前问题,本文也仅从经验上进行了解释;若要揭示其内在机理,尚需对其含水层的渗透系数、孔隙度和固体骨架体积压缩系数等展开定量研究。此外,还有一个不可忽视的观测系统问题,即井水位仪与气压仪之间的钟差,而这也是导致井水位与气压波动出现大幅相位差的一大潜在因素。因此,后续还需分别对无极井和宁晋井的钟差大小进行核查。
最后还需要强调的是,由于飑线天气过程中高频气压波的能量较高,其导致的深井水位波动也更为明显,因此,通过飑线这种极端天气来揭示井-含水层系统的高频气压响应模态,无疑是极具应用前景的。这种“自然又经济”的新手段将会为地下含水层系统的水力结构“成像”带来新视角。
三位评审专家提出了诸多建设性意见,对本文质量的提升帮助很大,作者在此谨致谢忱。
-
![]()
图 1 汤阴地堑地质构造及监测点分布图
F1:汤西断裂;F2:汤中断裂;F3:汤东断裂;F4:新商断裂;F5:盘古寺断裂;F6:凤凰岭断裂;F7:朱营断裂;F8:薄壁断裂;F9:九里山断裂;F10:百泉断裂,下同。底图引自中国地震局地球物理勘探中心(2016)
Figure 1. Geological map and sampled points plot of Tangyin graben
F1:Tangxi fault;F2:Tangzhong fault;F3:Tangdong fault;F4:Xinshang fault;F5:Pangusi fault;F6:Fenghuangling fault; F7:Zhuying fault;F8:Bobi fault;F9:Jiulishan fault;F10:Baiquan fault,the same below. Modified after Geophysical Exploration Center,China Earthquake Administration (2016)
![]()
图 2 汤阴地堑南部的土壤Rn分布Q-Q图
Figure 2. The Q-Q plots of soil radon concentration in southern Tangyin graben
![]()
图 3 汤阴地堑土壤Rn浓度空间分布
Figure 3. The spatial distribution plot of soil radon concentration in Tangyin graben
![]()
图 4 汤阴地堑南部土壤Rn空间等值线及结果解释
Figure 4. The contours map of soil Rn concentration and geophysical interpretation for southern Tangyin graben
![]()
图 5 浅层人工地震剖面Ⅱ(a)和Ⅲ(b)解释断点
Figure 5. Interpretation of faults located on shallow artificial seismic profiles Ⅱ (a) and Ⅲ (b)
表 1 汤阴地堑南部土壤Rn浓度分布特征
Table 1 The soil radon concentration statistical characteristics of southern Tangyin graben
测点数 最大值
/(kBq·m−3)最小值
/(kBq·m−3)平均值
/(kBq·m−3)中值
/(kBq·m−3)下四分位
/(kBq·m−3)上四分位
/(kBq·m−3)标准差
/(kBq·m−3)背景值
/(kBq·m−3)异常阈值
/(kBq·m−3)异常
衬度全部测点 380 78.54 3.09 28.27 27.15 19.10 35.56 12.96 27.22 48.40 2.13 西部测点 111 67.61 3.09 34.11 33.76 24.16 43.55 14.41 33.36 58.51 1.92 东部测点 269 78.54 4.88 25.86 25.18 18.20 32.69 11.50 25.40 44.59 2.11 汤西断裂 36 58.58 7.19 32.85 31.88 25.75 41.85 12.02 32.96 54.80 1.72 汤中断裂 43 51.91 7.88 26.43 24.93 19.78 30.41 11.13 26.59 46.87 1.89 汤东断裂 68 71.40 7.16 23.28 22.58 14.34 29.19 11.80 22.38 38.64 2.38  下载: 导出CSV
-
胡宁,马志敏,娄露玲,张宝山,王宇,王明亮,王文净,郭德科. 2019. 汤东活动断裂带气体地球化学特征[J]. 地震学报,41(4):524–535. doi: 10.11939/jass.20180131 Hu N,Ma Z M,Lou L L,Zhang B S,Wang Y,Wang M L,Wang W J,Guo D K. 2019. Geochemical characteristics of soil gas in Tangdong active fault zone[J]. Acta Seismologica Sinica,41(4):524–535 (in Chinese).
李营,杜建国,王富宽,周晓成,盘晓东,魏汝庆. 2009. 延怀盆地土壤气体地球化学特征[J]. 地震学报,31(1):82–91. doi: 10.3321/j.issn:0253-3782.2009.01.009 Li Y,Du J G,Wang F K,Zhou X C,Pan X D,Wei R Q. 2009. Geochemical characteristics of soil gas in Yanqing-Huailai basin,North China[J]. Acta Seismologica Sinica,31(1):82–91 (in Chinese).
刘保金,何宏林,石金虎,冉永康,袁洪克,谭雅丽,左莹,何银娟. 2012. 太行山东缘汤阴地堑地壳结构和活动断裂探测[J]. 地球物理学报,55(10):3266–3276. doi: 10.6038/j.issn.0001-5733.2012.10.009 Liu B J,He H L,Shi J H,Ran Y K,Yuan H K,Tan Y L,Zuo Y,He Y J. 2012. Crustal structure and active faults of the Tangyin graben in the eastern margin of Taihang mountain[J]. Chinese Journal of Geophysics,55(10):3266–3276 (in Chinese).
王明亮,胡宁,郭德科,夏修军,王宇,李源. 2019. 安阳南断裂带土壤H2、Rn地球化学特征[J]. 大地测量与地球动力学,39(11):1198–1201. Wang M L,Hu N,Guo D K,Xia X J,Wang Y,Li Y. 2019. Geochemical characteristics of radon and hydrogen in soil gas of south Anyang fault belts[J]. Journal of Geodesy and Geodynamics,39(11):1198–1201 (in Chinese).
中国地震局地球物理勘探中心. 2016. 新乡市活断层探测与地震危险性评价[R]. 郑州: 中国地震局地球物理勘探中心: 163–295. Geophysical Exploration Center, China Earthquake Administration. 2016. Active Fault Detection And Seismic Risk Assessment in Xinxiang City[R]. Zhengzhou: Geophysical Exploration Center, China Earthquake Administration: 163–295 (in Chinese).
Barkat A,Ali A,Hayat U,Crowley Q G,Rehman K,Siddique N,Haidar T,Iqbal T. 2018. Time series analysis of soil radon in northern Pakistan:Implications for earthquake forecasting[J]. Appl Geochem,97:197–208. doi: 10.1016/j.apgeochem.2018.08.016
Barnet I,Pacherová P,Poňavič M. 2018. Detection of faults using the profile measurements of radon concentration and gamma dose rate (Bohemian Massif,Czech Republic)[J]. Environ Earth Sci,77(9):330. doi: 10.1007/s12665-018-7513-4
Burton M,Neri M,Condarelli D. 2004. High spatial resolution radon measurements reveal hidden active faults on Mt.Etna[J]. Geophys Res Lett,31(7):L07618.
Choubey V M,Bist K S,Saini N K,Ramola R C. 1999. Relation between soil-gas radon variation and different lithotectonic units,Garhwal Himalaya,India[J]. Appl Radiat Isot,51(5):587–592. doi: 10.1016/S0969-8043(98)00149-3
Choubey V M,Mukherjee P K,Bajwa B S,Walia V. 2007. Geological and tectonic influence on water–soil–radon relationship in Mandi-Manali area,Himachal Himalaya[J]. Environ Geol,52(6):1163–1171. doi: 10.1007/s00254-006-0553-1
Chowdhury S,Barman C,Deb A,Raha S,Ghose D. 2019. Study of variation of soil radon exhalation rate with meteorological parameters in Bakreswar-Tantloi geothermal region of west Bengal and Jharkhand,India[J]. J Radioanal Nucl Chem,319(1):23–32. doi: 10.1007/s10967-018-6286-2
Ciotoli G,Lombardi S,Annunziatellis A. 2007. Geostatistical analysis of soil gas data in a high seismic intermontane basin:Fucino Plain,central Italy[J]. J Geophys Res:Solid Earth,112(B5):B05407.
Fu C C,Yang T F,Walia V,Chen C H. 2005. Reconnaissance of soil gas composition over the buried fault and fracture zone in southern Taiwan[J]. Geochem J,39(5):427–439. doi: 10.2343/geochemj.39.427
Fu C C,Yang T F,Du J,Walia V,Chen Y G,Liu T K,Chen C H. 2008. Variations of helium and radon concentrations in soil gases from an active fault zone in southern Taiwan[J]. Radiat Meas,43:S348–S352. doi: 10.1016/j.radmeas.2008.03.035
Fu C C,Yang T F,Chen C H,Lee L C,Wu Y M,Liu T K,Walia V,Kumar A,Lai T H. 2017. Spatial and temporal anomalies of soil gas in northern Taiwan and its tectonic and seismic implications[J]. J Asian Earth Sci,149:64–77. doi: 10.1016/j.jseaes.2017.02.032
Giustini F,Ciotoli G,Rinaldini A,Ruggiero L,Voltaggio M. 2019. Mapping the geogenic radon potential and radon risk by using Empirical Bayesian Kriging regression:A case study from a volcanic area of central Italy[J]. Sci Total Environ,661:449–464. doi: 10.1016/j.scitotenv.2019.01.146
Jaishi H P,Singh S,Tiwari R P,Tiwari R C. 2014. Correlation of radon anomalies with seismic events along Mat fault in Serchhip District,Mizoram,India[J]. Appl Radiat Isot,86:79–84. doi: 10.1016/j.apradiso.2013.12.040
Kandari T,Prasad M,Pant P,Semwal P,Bourai A A,Ramola R C. 2018. Study of radon flux and natural radionuclides (226Ra,232Th and 40K) in the main boundary thrust region of Garhwal Himalaya[J]. Acta Geophys,66(5):1243–1248. doi: 10.1007/s11600-018-0158-6
Kumar G,Kumari P,Kumar A,Prasher S,Kumar M. 2017. A study of radon and thoron concentration in the soils along the active fault of NW Himalayas in India[J]. Ann Geophys,60(3):S0329.
Li C H,Zhang H,Su H J,Zhou H L. 2019. Analysis of anomaly characteristics of the soil gas radon from the crossing fault in the mid-east area of Qilian mountain before the 2016 Menyuan MS6.4 earthquake[J]. J Radioanal Nucl Chem,322(2):763–769. doi: 10.1007/s10967-019-06694-4
Li Y,Du J G,Wang X,Zhou X C,Xie C,Cui Y J. 2013. Spatial variations of soil gas geochemistry in the Tangshan area of northern China[J]. Terr Atmos Ocean Sci,24(3):323–332. doi: 10.3319/TAO.2012.11.26.01(TT)
Lombardi S,Voltattorni N. 2010. Rn,He and CO2 soil gas geochemistry for the study of active and inactive faults[J]. Appl Geochem,25(8):1206–1220. doi: 10.1016/j.apgeochem.2010.05.006
Mollo S,Tuccimei P,Heap M J,Vinciguerra S,Soligo M,Castelluccio M,Scarlato P,Dingwell D B. 2011. Increase in radon emission due to rock failure:An experimental study[J]. Geophys Res Lett,38(14):L14304.
Nazaroff W W. 1992. Radon transport from soil to air[J]. Rev Geophys,30(2):137–160. doi: 10.1029/92RG00055
Neri M,Ferrera E,Giammanco S,Currenti G,Cirrincione R,Patanè G,Zanon V. 2016. Soil radon measurements as a potential tracer of tectonic and volcanic activity[J]. Sci Rep,6:24581. doi: 10.1038/srep24581
Papachristodoulou C,Stamoulis K,Ioannides K. 2020. Temporal variation of soil gas radon associated with seismic activity:A case study in NW Greece[J]. Pure Appl Geophys,177(2):821–836. doi: 10.1007/s00024-019-02339-5
Perrier F,Richon P,Byrdina S,France-Lanord C,Rajaure S,Koirala B P,Lal Shrestha P,Gautam U P,Tiwari D R,Revil A,Bollinger L,Contraires S,Bureau S,Sapkota S N. 2009. A direct evidence for high carbon dioxide and radon-222 discharge in central Nepal[J]. Earth Planet Sci Lett,278(3/4):198–207.
Ramola R C,Choubey V M,Prasad Y,Prasad G,Bartarya S K. 2006. Variation in radon concentration and terrestrial gamma radiation dose rates in relation to the lithology in southern part of Kumaon Himalaya,India[J]. Radiat Meas,41(6):714–720. doi: 10.1016/j.radmeas.2006.03.009
Sciarra A,Cantucci B,Coltorti M. 2017. Learning from soil gas change and isotopic signatures during 2012 Emilia seismic sequence[J]. Sci Rep,7(1):14187. doi: 10.1038/s41598-017-14500-y
Sciarra A,Mazzini A,Inguaggiato S,Vita F,Lupi M,Hadi S. 2018. Radon and carbon gas anomalies along the Watukosek fault system and Lusi mud eruption,Indonesia[J]. Mar Petrol Geol,90:77–90. doi: 10.1016/j.marpetgeo.2017.09.031
Sun X L,Yang P T,Xiang Y,Si X Y,Liu D Y. 2018. Across-fault distributions of radon concentrations in soil gas for different tectonic environments[J]. Geosci J,22(2):227–239. doi: 10.1007/s12303-017-0028-2
Tareen A D K,Asim K M,Kearfott K J,Rafique M,Nadeem M S A,Iqbal T,Rahman S U. 2019. Automated anomalous behaviour detection in soil radon gas prior to earthquakes using computational intelligence techniques[J]. J Environ Radioact,203:48–54. doi: 10.1016/j.jenvrad.2019.03.003
Tuccimei P,Mollo S,Vinciguerra S,Castelluccio M,Soligo M. 2010. Radon and thoron emission from lithophysae-rich tuff under increasing deformation:An experimental study[J]. Geophys Res Lett,37(5):L05305.
Walia V,Mahajan S,Kumar A,Singh S,Bajwa B S,Dhar S,Yang T F. 2008. Fault delineation study using soil gas method in the Dharamsala area,NW Himalayas,India[J]. Radiat Meas,43(S1):S337–S342.
Weinlich F H,Faber E,Boušková A,Horálek J,Teschner M,Poggenburg J. 2006. Seismically induced variations in Mariánské Lázně fault gas composition in the NW Bohemian swarm quake region,Czech Republic:A continuous gas monitoring[J]. Tectonophysics,421(1/2):89–110.
Yang Y,Li Y,Guan Z,Chen Z,Zhang L,Lü C,Sun F. 2018. Correlations between the radon concentrations in soil gas and the activity of the Anninghe and the Zemuhe faults in Sichuan,southwestern of China[J]. Appl Geochem,89:23–33. doi: 10.1016/j.apgeochem.2017.11.006
Yuce G,Fu C C,D’Alessandro W,Gulbay A H,Lai C W,Bellomo S,Yang T F,Italiano F,Walia V. 2017. Geochemical characteristics of soil radon and carbon dioxide within the Dead Sea fault and Karasu fault in the Amik basin (Hatay),Turkey[J]. Chem Geol,469:129–146. doi: 10.1016/j.chemgeo.2017.01.003


计量
- 文章访问数: 250
- HTML全文浏览量: 164
- PDF下载量: 46
