

Anomalous characteristics of geomagnetic vertical strength polarization before the 2017 Milin MS6.9 earthquake in Tibet
-
摘要: 基于中国大陆65 个地磁台站秒采样观测资料,利用地磁垂直强度极化方法提取了2017年西藏米林MS6.9 地震震中及附近区域超低频电磁异常信号并分析其时空演化特征。结果显示:米林MS6.9 地震前在青藏高原出现了大范围的地磁垂直强度极化高值异常,异常过程共持续9天;高值异常开始于2017 年10 月30 日,高值持续3 天之后出现短时间下降,随即转折上升,再次出现高值异常并持续了4 天,在此过程中各高值台站的时序曲线呈现出单峰或双峰的形态。空间分布图显示高值异常在中国大陆西部区域反复出现,尤其是在青藏高原巴颜喀拉地块与羌塘地块的交界处。异常呈“出现—扩大—收缩—消失—扩大—消失”的演化过程,10月31日异常面积达到最大值。异常过程结束后10天发生了西藏米林MS6.9地震,震中距离10 月31 日异常阈值线5 km。综合分析认为,此次异常与米林地震具有较强的时空相关性,是可靠的地震电磁前兆异常。
-
关键词:
- 地震磁扰动异常 /
- 西藏米林MS6.9地震 /
- 电磁辐射信号 /
- 地磁垂直强度极化方法
Abstract: Based on the second sampling data from 65 geomagnetic stations in Chinese mainland, we extracted the ultra-low frequency electromagnetic anomaly signals from the epicenter of the 2017 Milin MS6.9 earthquake in Tibet and its vicinity using geomagnetic vertical strength polarization method, and analyzed their spatio-temporal evolution characteristics. The results show that a large range of geomagnetic vertical strength polarization high value anomalies appeared in the Qinghai-Xizang (Tibetan) Plateau before the MS6.9 earthquake, and the abnormal process lasted for nine days. The high value anomaly began on October 30, 2017. The high value lasted for three days, followed by a short period of decline, a turning point and an increase. Afterwards the high value anomaly appeared again and lasted for four days. In this process, the time-series curves of each high-value station show single peak or double peak. The spatial distribution map shows that high value anomalies occur repeatedly in the western part of Chinese mainland, especially at the junction of Bayankhara and Qiangtang blocks on the Tibetan Plateau. The anomaly appeared, expanded, contracted, disappeared, expanded and disappeared, and the abnormal area reached its maximum value on October 31. Ten days after the end of the abnormal process, the Milin MS6.9 earthquake occurred, with its epicenter 5 km from the anomaly threshold line of October 31. Comprehensive analysis indicates that this anomaly has strong temporal and spatial correlation with the Millin earthquake and can be regarded as reliable seismic electromagnetic precursor. -
引言
全面禁止核试验条约组织(Comprehensive Nuclear-Test-Ban Treaty Organization,简写为CTBTO)为了核查世界各签约国遵守条约的情况,建立了以地震、次声、水声和放射性核素为主要监测手段的国际监测系统(International Monitoring System,简写为IMS),并在奥地利维也纳建立了接收、存储和处理监测系统实时监测数据的国际数据中心(International Data Center,简写为IDC)。其中地震监测作为地下核试验的一种有效远区监测技术手段,一直倍受CTBTO重视。截至2017年7月,已经完成了由50个主要台站和120个辅助地震台站所组成的庞大地震监测系统89%的核准与95%的建设(CTBTO,2017)。IMS的地震监测系统具有对全球1 kt以上当量的地下核试验的监测能力。由于国际监测系统的地震台站分布不均匀,对部分地区的实际监测阈值可能已经低于1 kt。地震台站的信号检测能力是地震台网事件监测能力的一个重要基础指标。地震台网的事件监测能力事实上主要是由组成地震台网的单个地震台站的信号检测能力所决定的,因此准确评估地震台站对重点地区地震事件,特别是地下爆炸地震信号的检测能力,对于进一步优化台网布局、提高对敏感地区可能地下核试验的监测能力以及快速响应能力具有重要的指导意义。
朝鲜是自IMS投入运行后,多次进行地下核试验的国家,因此IMS对该地区的信号监测能力也备受国内外核监测地震学家的关注。朝鲜第一次地下核试验后不久,Kværna等(2007)运用阈值监测法得到IMS台网在相应时段内对朝鲜地下核试验场地震信号的实时动态检测阈值及事件监测阈值。他们在计算检测阈值时以朝鲜第一次地下核试验作为校准事件,以4倍信号信噪比作为信号检测条件,以3个以上IMS地震台站上的信号信噪比同时达到4倍信号信噪比以上作为形成事件监测能力的条件。评估结果表明,在2006年朝鲜进行第一次地下核试验期间,IMS对朝鲜地下核试验场的实时信号检测能力大约为mb3.0,而相应的地震事件监测能力大约为mb3.8。不过Kværna在开展IMS监测系统对朝鲜地下核试验场的地震监测能力评估工作时,属于IMS的位于韩国原州的地震台阵KSRS并未向IDC实时传送数据,同时,位于俄罗斯乌苏里斯克的地震台阵USRK也并未建成。Kværna等利用长度约为3 min的KSRS台阵的监测数据进行分析后,认为增加KSRS台阵后,IMS系统对朝鲜核试验场的信号检测能力还可以下降0.5级,达到2.5级,而相应的事件监测能力基本上没有变化。Kværna等的研究结果还表明,如果将中国牡丹江的地震台站MDJ的记录数据与IMS的监测数据一起处理,则IMS对朝鲜核试验场地下爆炸的地震信号的检测能力平均可以达到2.0级,而事件的检测能力则可以达到3.5级(Kværna et al,2007 )。因此可以判断,KSRS向IDC实时传输数据,特别是USRK台阵建成后,IMS地震台网对朝鲜地下核试验场的地震信号检测能力将会有很大的提高。Kværna等在进行阈值监测能力评估时,只在低于4 Hz的较低频带进行计算,而决定地震台站信号检测能力的台站本底噪声在高频段的强度要远低于低频段,同时地下爆炸相对于同震级的天然地震,震源源频谱的拐角频率较高,导致高频地震波激发更强。因此在区域震震中距范围内,地震台站在中高频段的信号检测能力可能要强于低频段(Bahavar,North,2002)。阈值监测方法作为一种地震台网实时监测能力的评估方法,被广泛地应用于地震台站(网)的监测能力实时计算中(王燕等,2011)。然而,利用阈值监测方法虽然可以得到监测系统在运行过程中的瞬时监测能力,但其计算结果受当前地震台站的非平稳噪声和非目标区域地震信号的干扰较大。因此,阈值监测方法只能确定监测目标区域是否发生震级大于当前阈值的地震事件,其较短时间内的评估结果并不能反映地震台站的真实信号检测能力以及地震台网的事件监测能力。此外,基于地震观测报告和区域地震目录,应用“震级-序号”,“最大曲率”及“完整性震级范围”等方法分析区域台网的目录最小完整性也是评估地震台网监测能力的常用方法(李志海等,2011;冯建刚等,2012)。相比较而言,概率模型法是在对每个地震台站的本底噪声进行统计、建立噪声水平分布概率模型的基础上,对地震台站的信号检测能力进行评估,因此其评估结果更能反映单个地震台站的信号检测能力。
为研究当前全面禁止核试验条约组织对朝鲜核试验场的监测能力,本文将以地下爆炸的源强度比例修正模型为基础,应用概率模型法评估属于国际监测系统的USRK和KSRS台阵对朝鲜地下核试验场地下爆炸地震信号的检测能力。
1. 方法原理
地震台站的信号检测能力主要取决于台站处的背景噪声水平、传播路径的衰减及地震设备的性能指标(何少林,2003)。
根据Gerlach等(1966)的研究,台站噪声幅值的对数值符合正态分布,即
$\lg {A_{\rm{n}}} {\text{~}} N(\mu{\text{,}}{\gamma ^2}){\text{,}}$

(1) 式中,An为噪声的速度幅值,μ为噪声幅值的期望,γ为该分布的标准差。对于幅值为As的信号,其在地震台站上的信噪比大于K的概率Pd可以表示为
${P_{\mathop{\rm d}\nolimits} } \text{=} P(K{A_{\rm n}} \text{<} {A_{\rm s}}) \text{=} P\left({\rm lg}\frac{{K{A_{\rm n}}}}{{{A_{\rm s}}}} \text{<} 0\right){\text{,}}$

(2) 式中P表示概率运算。因此,在给定信号信噪比的条件下,地震台站能检测到信号的概率就是随机变量X=lg(KAn/As)<0的概率。如果将信号幅值As看作一个确定值,由式(1)可知,X的分布形式为
$X {\text{~}} N({\rm lg}K \text{+} \mu \text{-} {\rm lg}{A_{\rm s}}{\text{,}}{\gamma ^2}){\text{,}}$

(3) 求X<0的概率并将其转换为标准正态分布形式,即可得到对不同信号幅值的检测概率
$P(X \text{<} 0) \text{=} \varPhi \left(\frac{{\lg {A_{\rm s}} \text{-} \mu \text{-} \lg K}}{\gamma }{\rm{ }}\right){\text{,}}$

(4) 式中Φ为标准正态分布概率。通过查阅标准正态分布表,可以得到不同信号幅值所对应的检测概率,也可反推一定检测概率对应的阈值。对于特定台站对特定场地的监测,可以利用台站记录到的历史地震事件的信号幅值得到信号的幅值-震级关系,从而利用信号幅值反算震级。朝鲜历次核试验的震级集中在mb4.0—5.0,根据地下核试验的震源频谱模型,在拐角频率fc以下,地震台站记录到的不同核试验的信号幅值对数差与试验之间的震级差相同,因此对于拐角频率以下的信号可以利用已知震级核试验的实测信号幅值,根据比例关系折算得到不同震级地下核试验的信号幅值;但当信号的频率大于拐角频率时,震级差与信号的幅值对数差之间不再满足比例关系,则不能直接利用已知震级核试验的高频实测信号幅值折算更小震级核试验的高频信号幅值。为此,本文运用地下爆炸的源频谱模型,利用已知较大震级核试验实测的高频信号得到较小震级地下核试验的高频信号幅值,从而实现地震台站高频信号检测能力的评估。
对于球对称地下爆炸源,假设作用在弹性边界上的应力时间函数为阶跃函数,则距离弹性边界r处的远场径向位移的频谱可以近似表示为
$u_r {\text{≈}} \frac{{{{\varPhi }_\infty }}}{{r\left[ \text{-} {{\left(\displaystyle\frac{\omega}{\omega _{\rm{e}}}\right)}^2} \text{+} {{2\eta }{\displaystyle\frac{\omega} {\omega _{\rm{e}}}{\rm i}} \text{+} 1} \right]}}{\text{,}}$

(5) 式中:ωe为源本征频率,ωe=2β/re=2π fc;re为弹性半径;η=β/α为源区附近介质的阻尼系数;β和α分别为介质的S波和P波速度;Φ∞为爆炸源的折合位移势的稳态值。根据Denny和Johnson (1991)的结果,在固定埋深的情况下,稳态折合位移势正比于爆炸当量W,即
${{\varPhi }_\infty } \propto W{\text{,}}$

(6) 同时式(5)中的源本征频率与爆炸当量之间存在比例关系
${\omega _{\rm{e}}} \propto {W^{ - {{1/ 3}}}}{\text{.}}$

(7) 当距离r大于爆炸的弹性边界且满足远场条件时,可以将式(5)所表示的频谱称为爆炸的源时间函数S(ω)。假如从r处到台站的地震波传播可以用传播函数T(ω)表示,则台站记录到的位移频谱可以表示为
$A\left( \omega \right) \text{=} S\left( \omega \right)T\left( \omega \right){\text{.}}$

(8) 当两次爆炸的爆心位置的差异非常小时,可以认为从r处到台站的地震波传播函数T(ω)相同,并且假设两次爆炸源区附近的介质完全相同,这时两次爆炸在同一地震台站上记录到的地震信号之间的谱比值为
$\frac{{{A_1}\left( \omega \right)}}{{{A_2}\left( \omega \right)}} \text{=} \frac{{{S\!_1}\left( \omega \right)}}{{{S\!_2}\left( \omega \right)}} \text{=} \frac{{{W\!_1}}}{{{W\!_2}}} \frac{{{{\left({{{{\displaystyle\frac{\omega }{{{\omega _{{\rm e}2}}}}}}}}\right)}^2} \text{-} 2\eta {{{{\displaystyle\frac{\omega }{{{\omega _{{\rm e}2}}}}}}}}{\mathop{\rm i}\nolimits} \text{-} 1}}{{{{\left( {{{{{\displaystyle\frac{\omega }{{{\omega _{{\rm e}1}}}}}}}}} \right)}^2} \text{-} 2\eta {{{{\displaystyle\frac{\omega }{{{\omega _{{\rm e}1}}}}}}}}{\mathop{\rm i}\nolimits} \text{-} 1}}{\text{,}}$

(9) 式中,W1和W2为两次爆炸的当量,ωe1和ωe2分别为两次爆炸的源本征频率。因此,当已知某次当量为W1的地下爆炸的源本征频率为ωe1,其相应的mb震级为mb 1 ,其在某台站上的地震信号频谱为A1(ω)。根据式(9)可以得到当量为W2的地下爆炸在该台站上的地震信号频谱A2(ω)。同时在固定埋深的情况下,当量为W2时地下爆炸的震级mb 2可由
${{m}}{_{\rm{b}}^2} \text{=} {{m}}{_{\rm{b}}^1} \text{-} \lg \frac{{{W_1}}}{{{W_2}}}.$

(10) 计算得到。通过以上比例折算,我们可以根据当量为W1,震级为mb 1的爆炸在频率ω1处的信号幅值,得到震级为mb 2的爆炸在相应频率处的信号幅值As。
2. 台站检测能力评估
2.1 台阵基本情况
本文所研究的USRK和KSRS台阵分别位于俄罗斯的乌苏里斯克和韩国原州,是目前IMS系统中距离朝鲜地下核试验场最近的两个台阵。KSRS台阵距朝鲜丰溪里核试验场约430 km,由28个子台构成,由于数据连续性问题,本文实际上仅使用中心区域的16个台站参与聚束。USRK台阵相距朝鲜地下核试验场约400 km,由10个子台构成孔径约为3.6 km的3层同心圆小孔径台阵。
2.2 台站本底噪声水平建模
概率模型法是通过统计建立噪声幅值样本的概率模型来确定对不同震级事件的检测概率。噪声统计过程中要避免地震事件信号及信号尾波的干扰。本文选取IDC公报中2014年至2016年全球范围内mb≥4.5地震共计约3 500次,截取每个事件中P波震相到时前15 s至前5 s的波形作为噪声波形。事件选取同时考虑不同季节、一天内不同时段可能存在的噪声强弱差异。为验证所选噪声信号样本在时间上是均匀分布的,分别统计一年和24小时的噪声样本数,其分布如图1所示。从统计结果可以看出,噪声样本在一天内不同时刻基本平均分布,按月份分布未表现出明显的季节差异性,该噪声样本可以反映地震台站的平均本底噪声水平,可用于后续计算。
![]() 图 1 一年内(a)和一天内(b)的噪声样本分布Figure 1. The distribution of noise samples in a year (a) and a day (b)
图 1 一年内(a)和一天内(b)的噪声样本分布Figure 1. The distribution of noise samples in a year (a) and a day (b)对噪声样本数据按以下流程进行处理:首先,对台阵各子台记录到的波形数据进行质量控制,去除毛刺、记录为零或靠摆的数据段,再对质量合格的波形进行聚束和去仪器响应得到地面的振动速度波形(单位:μm/s)。由于存在连续波形缺失、数据质量不合格、数据间断等问题,最终两个台阵分别形成了大约3 200个有效噪声样本数据;其次,测量不同频带内的噪声幅值。为避免滤波产生的边界效应,以事件信号到时为中心前后各取100 s波形数据进行滤波。滤波频带分别为0.75—1.5 Hz,1.0—2.0 Hz,2.0—4.0 Hz,3.0—6.0 Hz,4.0—8.0 Hz,6.0—9.0 Hz,共计6个频带。为避免走时计算不准确导致事件信号本底进入噪声幅值测量时间窗,截取滤波后事件信号理论到时前15 s至前5 s共计10 s的波形作为噪声波形,测量每段噪声波形的最大峰-峰值作为其噪声幅值;最后,统计噪声峰-峰幅值对数的均值和方差。
得到噪声峰-峰幅值对数的均值和方差后,即可利用正态分布模型对不同频带内的噪声水平概率分布进行拟合。图2给出了不同频带内USRK台阵和KSRS台阵的本底噪声幅值对数的累积概率分布。可以看出,USRK台阵各频带的噪声幅值对数的均值随着频率的升高逐渐降低,而KSRS台阵噪声幅值对数的均值从0.75—1.5 Hz至2.0—4.0 Hz逐渐降低,但随后又升高。这可能是由于KSRS台阵的仪器响应校正曲线在高频段不准而引起。两个台阵噪声幅值对数的标准差在各频带无明显变化。
![]() 图 2 USRK台阵(a)和KSRS台阵(b)在各频带的累积概率分布曲线Figure 2. Cumulative probability distribution curves of the KSRS array (a) and the KSRS array (b) in the multi-band
图 2 USRK台阵(a)和KSRS台阵(b)在各频带的累积概率分布曲线Figure 2. Cumulative probability distribution curves of the KSRS array (a) and the KSRS array (b) in the multi-band2.3 多频带信号幅值折算
根据式(9)和(10),只要利用一次已知当量地下核试验在地震台站上的实际观测信号幅值,即可预测出该爆心附近其它当量地下核试验在该台站上的信号幅值。朝鲜核试验之后,国内外有大量研究人员均尝试对其试验当量进行估算(Rougieret al,2011 ;Zhao et al,2012 )。其中Rougier等(2011)以地表未出现明显破坏作用为边界条件,采用流体动力学数值模拟的方法对核试验的比例埋深进行约束,给出了2009年5月25日朝鲜第二次地下核试验的当量为5.7 kt,埋深为375 m。根据Denny和Johnson (1991),当量为Y,埋深为h的地下核试验的拐角频率可以表示为
${f_{\rm c}} \text{=} \frac{{0.64{{\left( {\rho {\rm g}h} \right)}^{0.5522}}{{10}^{0.0025P_{\rm G}}}}}{{\pi \; {\rho ^{0.7245}}{\beta ^{0.0642}}{Y^{0.3333}}}}{\text{,}}$

(11) 式中,ρ为源区介质密度,h为试验装置的埋深,PG为介质的干燥孔隙率。根据Rougier等(2011),取密度为2 680 kg/m3,P波速度为5 495 m/s,S波速度为3 269 m/s;干燥花岗岩介质的孔隙率大约为0.5% (Koper et al,2008 )。根据2009年5月25日朝鲜地下核试验的当量和埋深,可以估算其拐角频率为2.1 Hz。为了提高拐角频率估算的准确性,本文在1.1—3.1 Hz范围内对最优拐角频率进行搜索,即通过
$\min \left( {\sum\limits_{k = 1}^K {d_k^2} } \right)$

(12) 来搜索一个最优拐角频率fcopt。式中dk为地震台站上记录到的Pn波的位移谱与理论位移谱之间的残差,表示为
${d_k} \text{=} A_{{\rm{o}}}^{{\rm{Pn}}}\left( {{f_k}} \right) \text{-} A_{{\rm{t}}}^{{\rm{Pn}}}\left( {{f_k},{f_{\rm c}}} \right){\text{,}}$

(13) 式中Ao Pn(fk)和At Pn(fk)分别为Pn波在第k个频点fk上的观测位移谱和理论位移谱。根据Sereno等(1988),台站上记录到的Pn波位移理论振幅谱可以表示为
$A_{{\rm{t}}}^{{\rm{Pn}}}\left( {f{\text{,}}\!\!\!{f_{\rm c}}} \right) \text{=} S\!\left({f{\text{,}}{f_{\rm c}}} \right)G\left( {\varDelta{\text{,}}f} \right)\exp \left( { \text{-} \frac{{{\rm{\pi }}f\tau }}{{Q\left( f \right)}}} \right){\text{,}}$

(14) 式中,S( f,fc)为源频谱,G(Δ,f )为Pn波从爆心到地震台站的几何扩散因子,Δ为爆心到台站的距离,Q( f )为传播路径的平均非弹性衰减,τ为Pn波的传播走时。根据Yang等(2007)对Pn波几何扩散因子的研究结果,G(Δ,f )可以表示为
$G\left( {{\rm{\varDelta }}{\text{,}}f} \right) \text{=} \frac{{{{10}^{{n_3}\left( f \right)}}}}{{{{\rm{\varDelta }}_0}}}{\left( {\frac{{{{\rm{\varDelta }}_0}}}{{\rm{\varDelta }}}} \right)^{{n_1}\left( f \right)\lg (\frac{{{{\rm{\varDelta }}_0}}}{{\rm{\varDelta }}}) \text{+} {n_2}\left( f \right)}}{\text{,}}$

(15) ${n_i}\left( f \right) \text{=} {n_{i1}}{\left[ {\lg^2 \left( {\frac{f}{{{f_0}}}} \right)} \right]} \text{+} {n_{i2}}\lg \left( {\frac{f}{{{f_0}}}} \right) \text{+} {n_{i3}}{\text{,}}\quad i \text{=} 1{\text{,}}2{\text{,}}3{\text{,}}$

(16) 式中Δ0和f0分别为参考距离和参考频率。利用朝鲜3次地下核试验激发的Pn波在297个宽频带地震台站上的记录信号,Zhao等(2015)对适用于朝鲜半岛及我国东北地区的Pn波几何扩散因子系数进行了搜索反演,同时给出了朝鲜半岛和我国东北地区的Pn波视衰减Q值为237,视衰减Q值的频率指数为0.361。根据Denny和Johnson (1991),当量为Y,埋深为h的地下核爆炸的稳态折合位移势可以表示为
${\varPhi _\infty } \text{=} \frac{{3.4 \text{×} {{10}^9}Y}}{{{\beta ^{1.1544}}{{\left( {\rho {\rm g}h} \right)}^{0.4385}}{{10}^{0.0344P_{\rm G}}}}}.$

(17) 利用式(17)和式(5),可以计算出1 km距离处的位移谱,将其作为式(14)中的S(f,fc),再利用几何扩散因子和视非弹性衰减系数即可对最优源拐角频率进行搜索。由于本文研究的两个地震台站只有USRK台站装有宽频带地震计,因此我们只使用USRK台站宽频带仪器记录到的2009年5月25日朝鲜地下核试验的Pn波位移谱对最优拐角频率进行搜索。图3给出了最优频率的搜索结果,可以看出,当源频谱拐角频率为2.7 Hz时,位移谱拟合残差取得最小值。图4给出了取最优拐角频率时理论Pn波位移谱对观测Pn波位移谱的拟合结果,可以看出,理论Pn波位移谱与实际观测谱基本吻合,表明2009年5月25日朝鲜地下核试验的源频谱拐角频率应该在2.7 Hz附近。
![]() 图 3 Pn波位移谱残差随源频谱拐角频率fc的变化曲线Figure 3. Residual variation of displacement spectral of Pn wave with corner frequency fc of source frequency spectrum
图 3 Pn波位移谱残差随源频谱拐角频率fc的变化曲线Figure 3. Residual variation of displacement spectral of Pn wave with corner frequency fc of source frequency spectrum![]() 图 4 理论Pn波频谱与实际观测频谱的比较Figure 4. The comparison of spectrum between theoretical Pn waveform and observed waveform
图 4 理论Pn波频谱与实际观测频谱的比较Figure 4. The comparison of spectrum between theoretical Pn waveform and observed waveform本文以2009年5月25日的核试验作为参考爆炸事件,根据其当量、震级以及通过对实际观测数据拟合得到的源频谱拐角频率,利用比例关系得到了其它更小当量试验的震级及其与参考事件之间的源频谱比值。图5给出了部分小当量爆炸对参考事件的稳态强度进行归一化后的源频谱及相应的源频谱比值。
![]() 图 5 部分小当量爆炸的源频谱(a)以及相对于参考事件的谱比值(b)Figure 5. Source spectrum of explosion events (a) and spectral ratio to the reference event (b) with small yield
图 5 部分小当量爆炸的源频谱(a)以及相对于参考事件的谱比值(b)Figure 5. Source spectrum of explosion events (a) and spectral ratio to the reference event (b) with small yield在时间域内折算小震级核试验的信号幅值时,首选利用相应的Pn波慢度对USRK和KSRS台阵各台站记录到的2009年5月25日朝鲜核试验的信号进行聚束并去除仪器响应,然后再利用通带分别为0.75—1.5 Hz,1.0—2.0 Hz,2.0—4.0 Hz,3.0—6.0 Hz,4.0—8.0 Hz,6.0—9.0 Hz的3阶巴特沃斯带通滤波器进行滤波。图6给出了经过上述处理后的观测波形。
![]() 图 6 USRK (左)和KSRS (右)台阵的多频带波形数据Figure 6. Waveforms in the multi-band for the USRK (left) and KSRS (right) arrays
图 6 USRK (左)和KSRS (右)台阵的多频带波形数据Figure 6. Waveforms in the multi-band for the USRK (left) and KSRS (right) arrays从Pn波到时前0.5 s起,在宽为5.5 s的时间窗内测量信号的峰−峰幅值。表1给出了2009年5月25日朝鲜核试验在上述两个台阵上的实测Pn波幅值。不同震级地下核试验在上述两个地震台站上的Pn波预测幅值A2可以由
${A^2} \text{=} {A^1} {\mathop{\rm mean}\nolimits} \left[ {\frac{{{S_2}\left( {{f_1}:{f_2}} \right)}}{{{S_1}\left( {{f_1}:{f_2}} \right)}}} \right] \text{=} {A^1} {R_{21}}\left( {{f_1}:{f_2}} \right)$

(18) This page contains the following errors:
error on line 1 at column 1: Start tag expected, '<' not foundBelow is a rendering of the page up to the first error.
表 1 不同震级朝鲜地下核试验在USRK和KSRS台阵上不同频带Pn波信号的实测和预测幅值Table 1. Observed and predicted amplitudes of Pn waves with different frequencies at USRK and KSRS arrays generated by North Korea nuclear test with different magnitudesmb 台阵 信号幅值/(μm·s–1) 0.75—1.5 Hz 1.0—2.0 Hz 2.0—4.0 Hz 3.0—6.0 Hz 4.0—8.0 Hz 6.0—9.0 Hz 4.5 USRK 1.37 2.68 6.66 4.41 2.59 2.25 KSRS 1.05 1.86 5.16 4.24 8.42 27.64 4.0 USRK 0.43 0.84 2.79 2.57 1.72 1.56 KSRS 0.34 0.56 2.13 2.45 5.33 19.16 3.0 USRK 0.04 0.08 0.28 0.35 0.35 0.49 KSRS 0.03 0.05 0.22 0.33 1.09 5.99 2.0 USRK 0.004 0.008 0.03 0.03 0.04 0.05 KSRS 0.003 0.005 0.02 0.03 0.11 0.65 2.4 台站多频带信号检测概率计算
利用USRK和KSRS台阵的本底噪声幅值对数均值和方差,将不同震级对应的各频带幅值带入式(4)并取信噪比K为3.0,可以计算得到这两个台阵对朝鲜核试验场不同震级地下核试验的3倍信噪比的信号检测概率,结果如图7所示。
![]() 图 7 USRK台阵(a)和KSRK台阵(b)各频带检测概率Figure 7. Detection probability of the USRK array (a) and the KSRS array (b) in the multi-band
图 7 USRK台阵(a)和KSRK台阵(b)各频带检测概率Figure 7. Detection probability of the USRK array (a) and the KSRS array (b) in the multi-band从图7中分别读取0.9,0.5,0.3的检测概率所对应的震级,所得到的值即为对应的检测阈值,结果如图8所示。可以看出,UKSK和KSRS台阵的检测阈值随频率的升高逐渐下降,0.9的检测概率条件下,在0.75—1.5 Hz频带内,两台阵的检测阈值分别约为mb3.5和mb3.4;在6.0—9.0 Hz频带内,两台阵的检测阈值分别为mb1.5和mb2.2。
![]() 图 8 不同震级事件USRK(a)和KSRS(b)台阵的检测阈值Figure 8. Detection threshold with different magnitudes for USRK array (a) and KSRS array (b)
图 8 不同震级事件USRK(a)和KSRS(b)台阵的检测阈值Figure 8. Detection threshold with different magnitudes for USRK array (a) and KSRS array (b)3. 讨论与结论
北京时间2010年5月12日8时8分45.067秒在朝鲜核试验场附近发生了一次震级约为mb(1.44±0.13)的事件(Zhang,Wen,2015)。根据本文的评估结果,USRK台阵在6.0—9.0 Hz频带可能记录到了该次小事件的信号。截取该时刻的波形,进行聚束处理,并按上文频带进行滤波,结果如图9所示。可以看出,在4.0—8.0 Hz和6.0—9.0 Hz频段内均可以清晰地看到该次事件的Pn震相,其信噪比分别约为3.4和2.5。f-k分析的结果表明,该信号的方位角和水平慢度与来自朝鲜核试验场附近的地震信号的方位角和水平慢度相一致,表明图9中4.0—8.0 Hz和6.0—9.0 Hz的微弱地震信号来自于2010年5月12日朝鲜核试验场附近的小震级地震。由此可以验证USRK台阵对朝鲜核试验场附近的地震事件的信号检测能力可以达到mb(Lg)1.44。考虑到2010年5月12日朝鲜核试验场地震事件的震级测量不确定范围及mb(Lg)震级与mb震级之间的等效性,这一观测结果与本文得到的USRK台阵对朝鲜核试验场具有mb1.5的信号检测能力的结果相吻合。同时,KSRS台阵在上述频带并未检测到该次小地震的信号,说明KSRS台阵的检测阈值要大于mb1.44。
![]() 图 9 2010年5月12日朝鲜核试验场小震事件的波形图中时间轴零点处为Pn波信号到时位置Figure 9. Waveforms of the small earthquake on May 12,2010 from the North Korea nuclear test siteThe zero position of the time axis is the arrival time of Pn wave
图 9 2010年5月12日朝鲜核试验场小震事件的波形图中时间轴零点处为Pn波信号到时位置Figure 9. Waveforms of the small earthquake on May 12,2010 from the North Korea nuclear test siteThe zero position of the time axis is the arrival time of Pn wave此外,从评估结果可以看出,在0.75—1.5 Hz和2.0—4.0 Hz频带内,KSRS的信号检测阈值比USRK分别弱0.1和0.2个震级单位,这与KSRS台阵距离朝鲜核试验场更远有关。但在6.0—9.0 Hz频带内,KSRS的检测能力要比USRK弱0.7个震级单位。从表1和图2b可以看出,在该频带内,KSRS台阵的信号幅值要比USRK强13倍,同时本底噪声水平也高50倍。通过分析这两个台阵的仪器响应特性,我们认为可能是由于IDC提供的KSRS台阵仪器响应曲线在6.0—9.0 Hz频带内存在过校正使得两个台阵之间的信号幅值和噪声水平有较大差异。不过由于过校正同时作用于信号和噪声,因此并不会影响信号检测能力的评估结果。KSRS台阵的卫星影像图表明,该台阵距离居民区和河流的距离较近,这可能是导致其高频本底噪声水平偏高、高频信号检测能力下降的主要原因。
本文通过台站本底噪声建模及多频带信号幅值折算,计算得到USRK台阵和KSRS台阵对朝鲜核试验场不同震级地下核试验的Pn波信号检测概率,进而得到不同信号检测概率对应的震级阈值。在0.9的检测概率条件下,USRK台阵和KSRS台阵在0.75—1.5 Hz,2.0—4.0 Hz,6.0—9.0 Hz频带对朝鲜核试验场地下核试验的检测阈值分别为mb3.5,mb2.3,mb1.5和mb3.4,mb2.5,mb2.2。结果表明:震中距为400 km左右的两台阵均随着频率的升高,检测阈值逐渐降低,即信号检测能力增强;在高频段,USRK的监测能力强于KSRS。
-
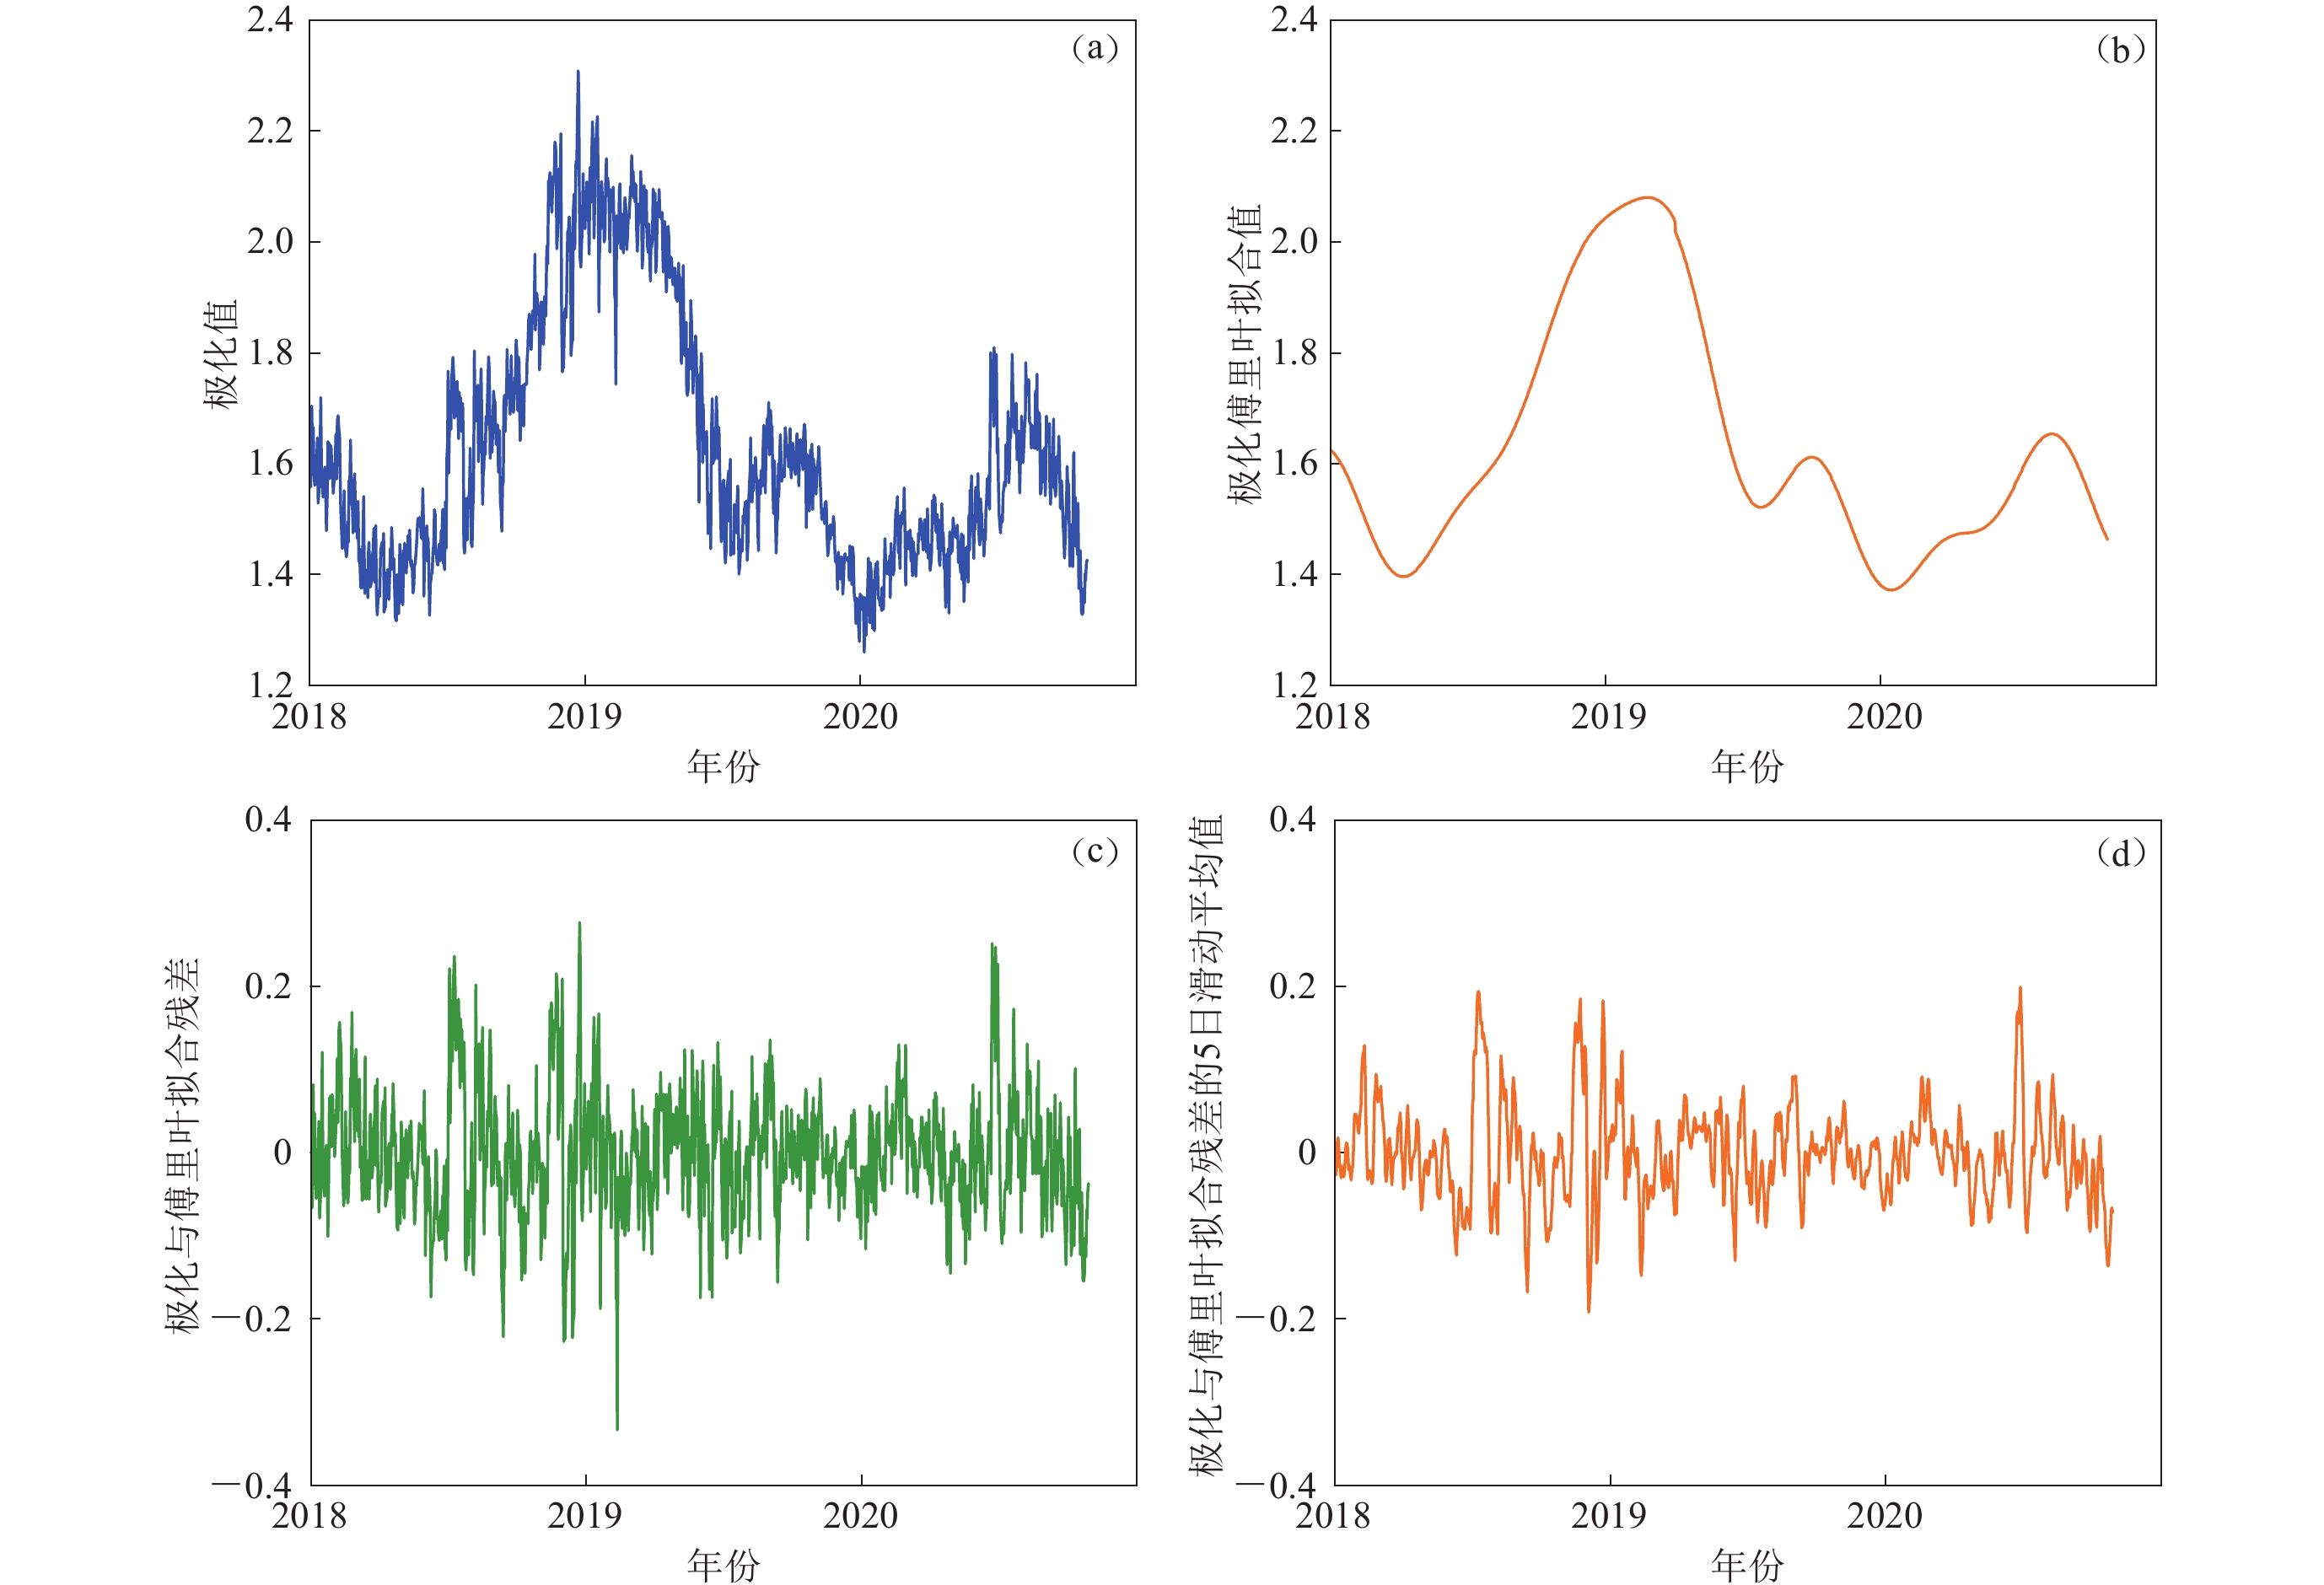
![]()
图 2 地磁垂直强度极化方法计算过程(以青海都兰台为例)
(a) 极化值;(b) 极化值的傅里叶拟合;(c) 极化值与其傅里叶拟合的残差值;(d) 残差的5日滑动平均值
Figure 2. The calculation process of geomagnetic vertical intensity polarization method (Data from Dulan observation station)
(a) Original polarization values;(b) Fourier fitting results of Fig. (a);(c) The difference between Fig. (a) and Fig. (b);(d) Five-day moving average of Fig. (c)
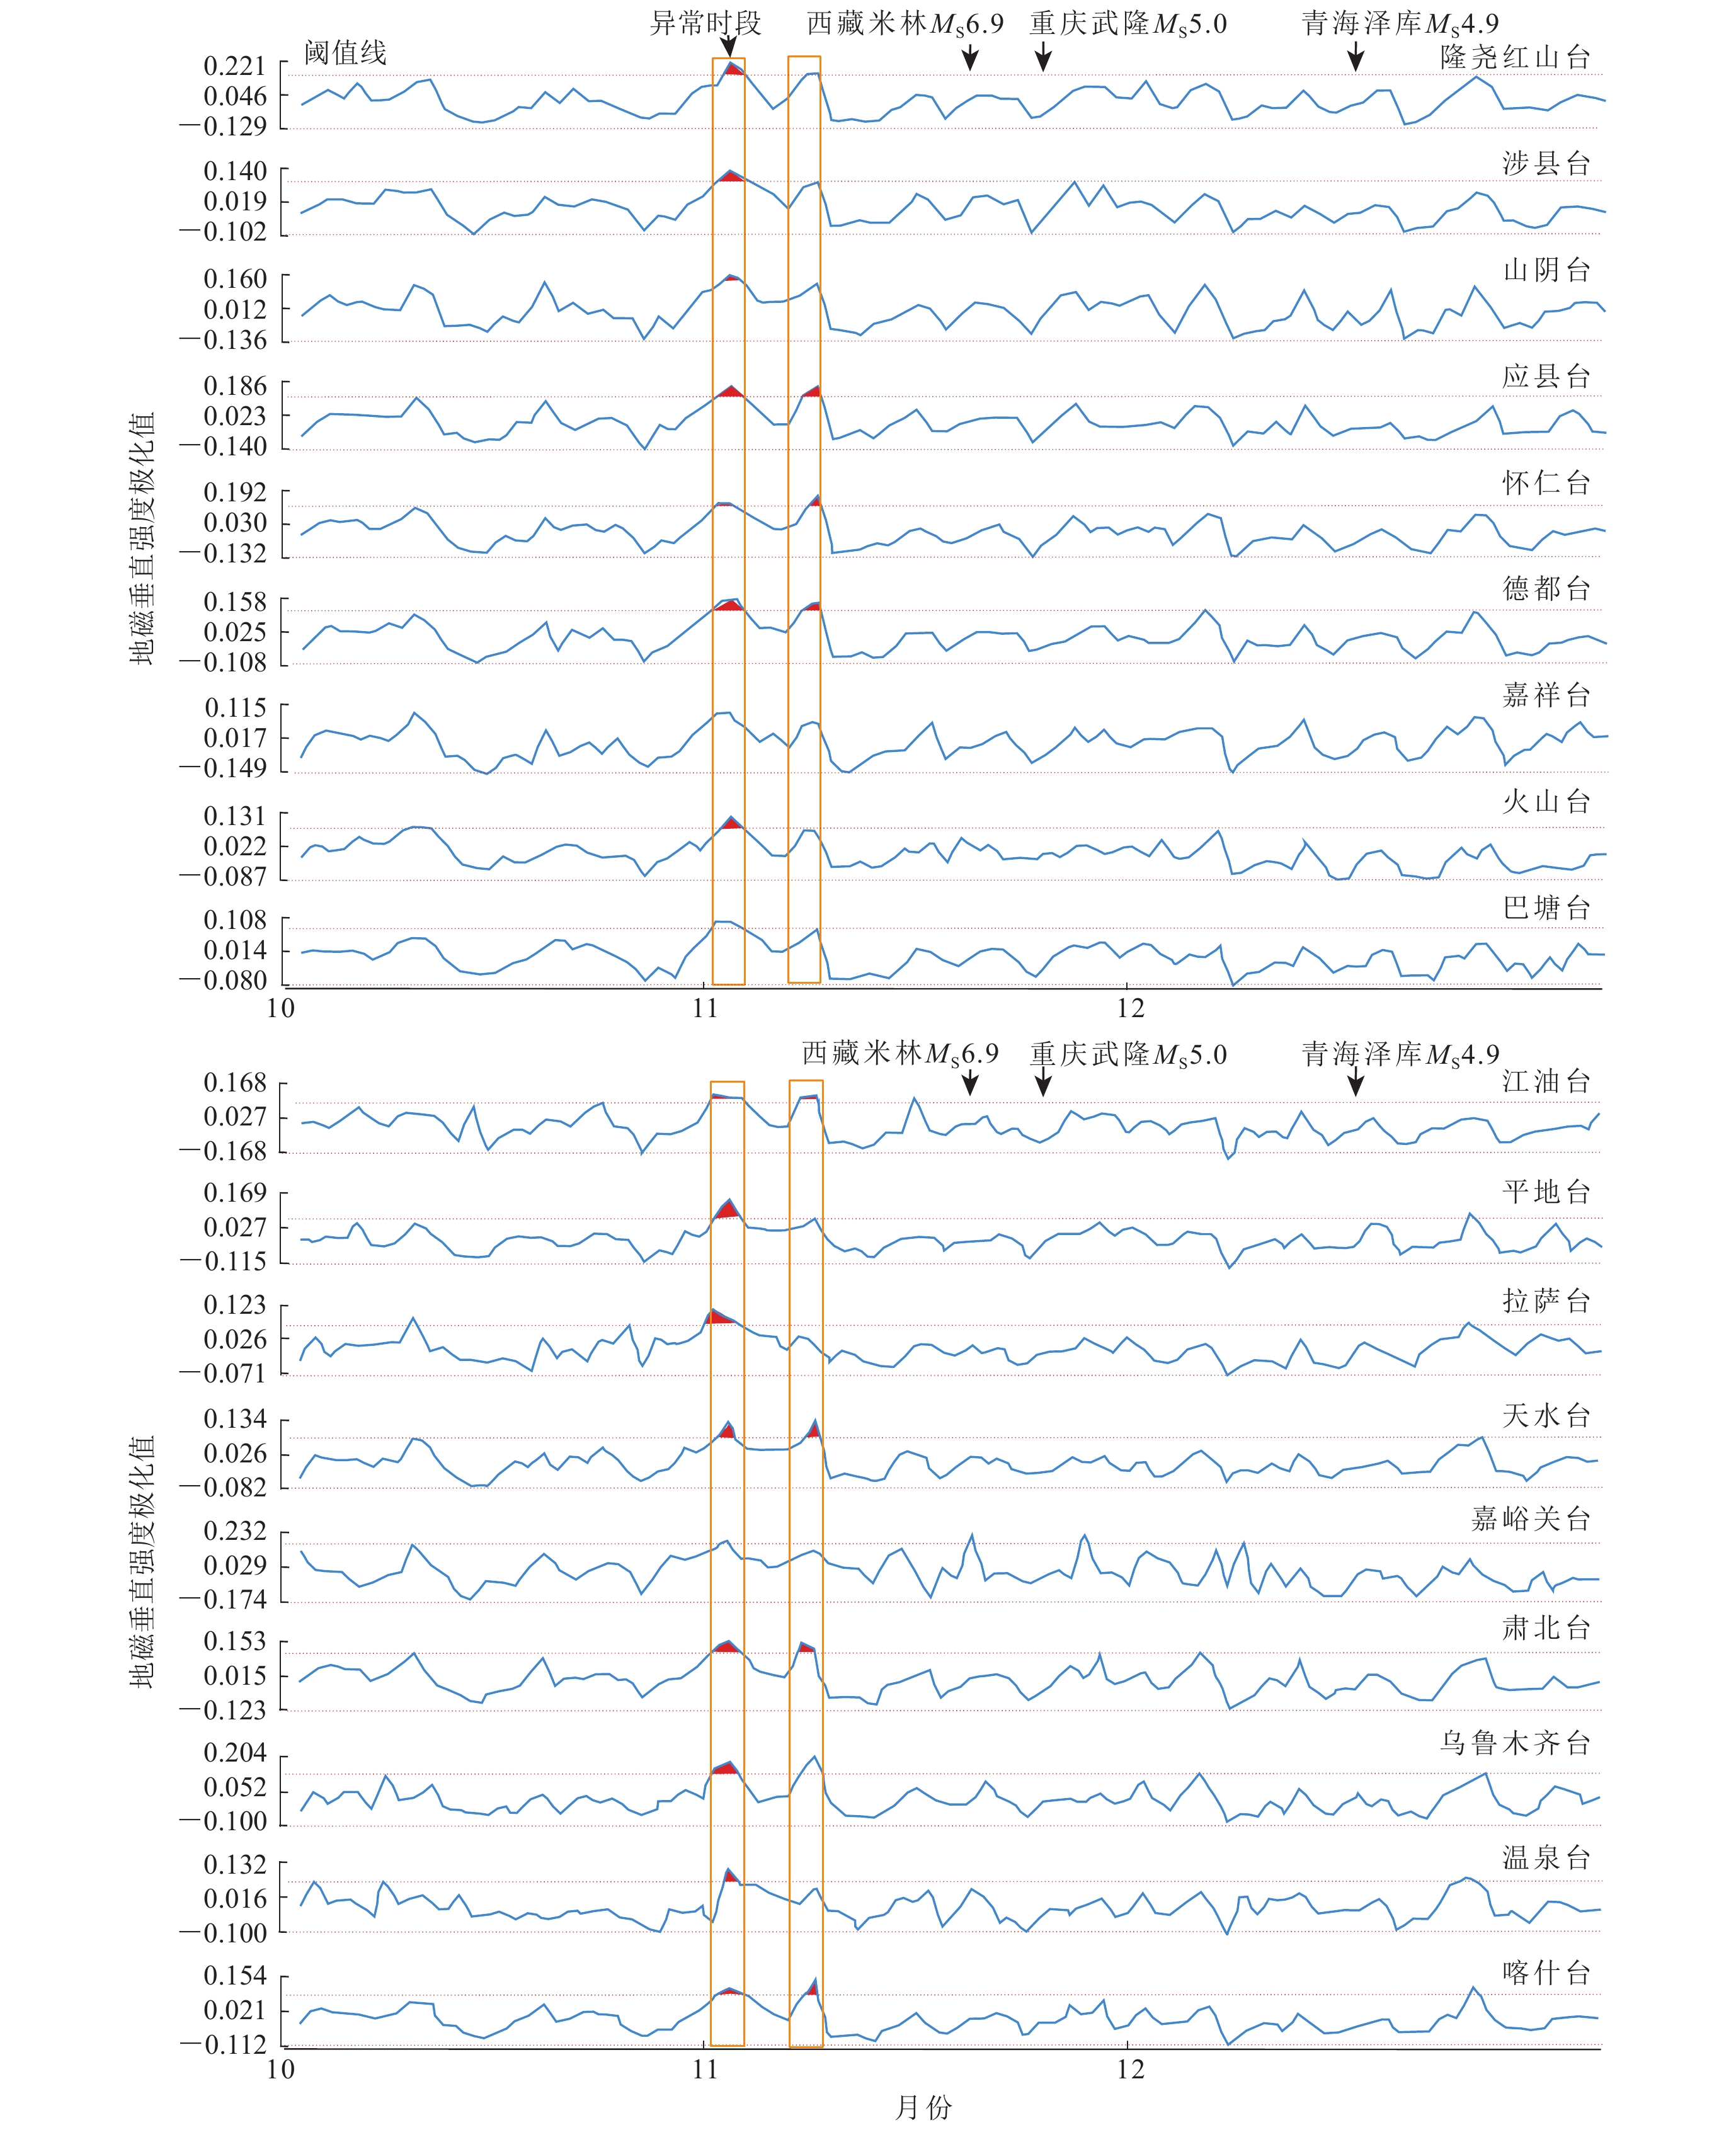
![]()
图 3 2017年10—12月部分地磁垂直强度极化异常台站时序曲线
Figure 3. Time series of some stations with geomagnetic vertical strength polarization anomaly from October 1,2017 to December 31,2017
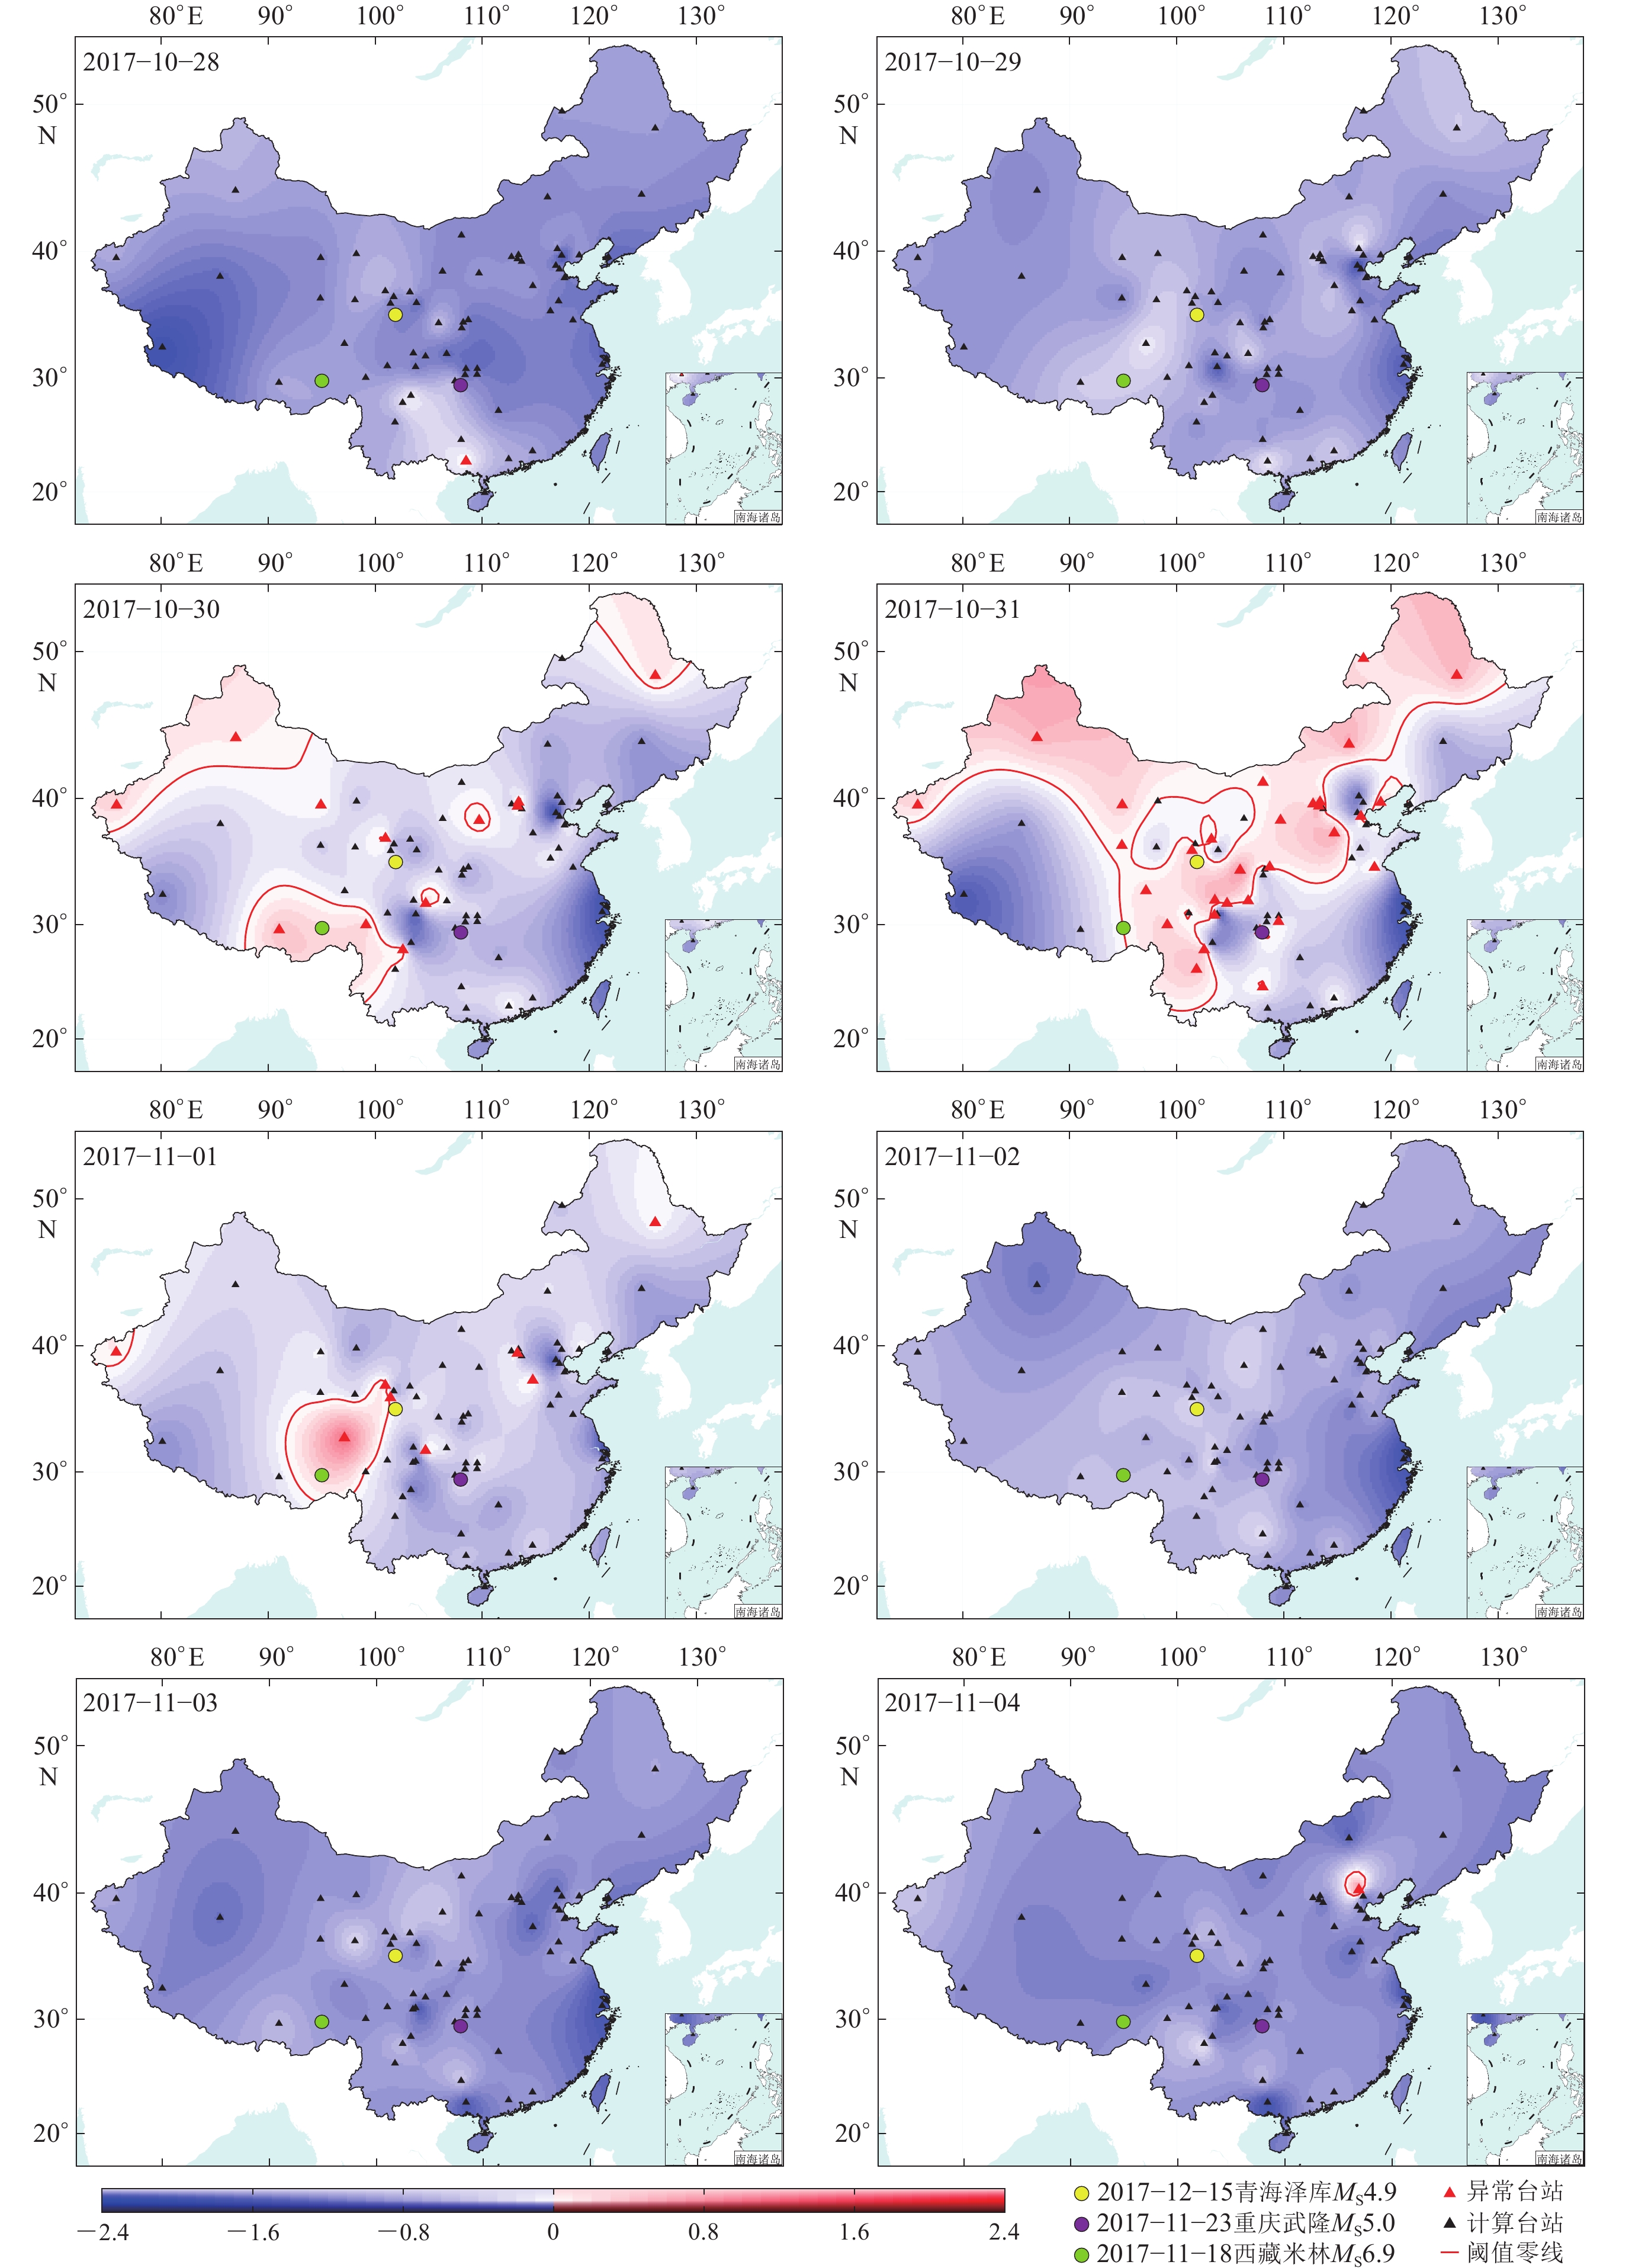
![]()
图 4 2017年10月28日至11月8日全国地磁垂直强度极化异常空间演化过程
Figure 4. Spatial evolution process of geomagnetic vertical intensity polarization anomaly from October 28 to November 8,2017
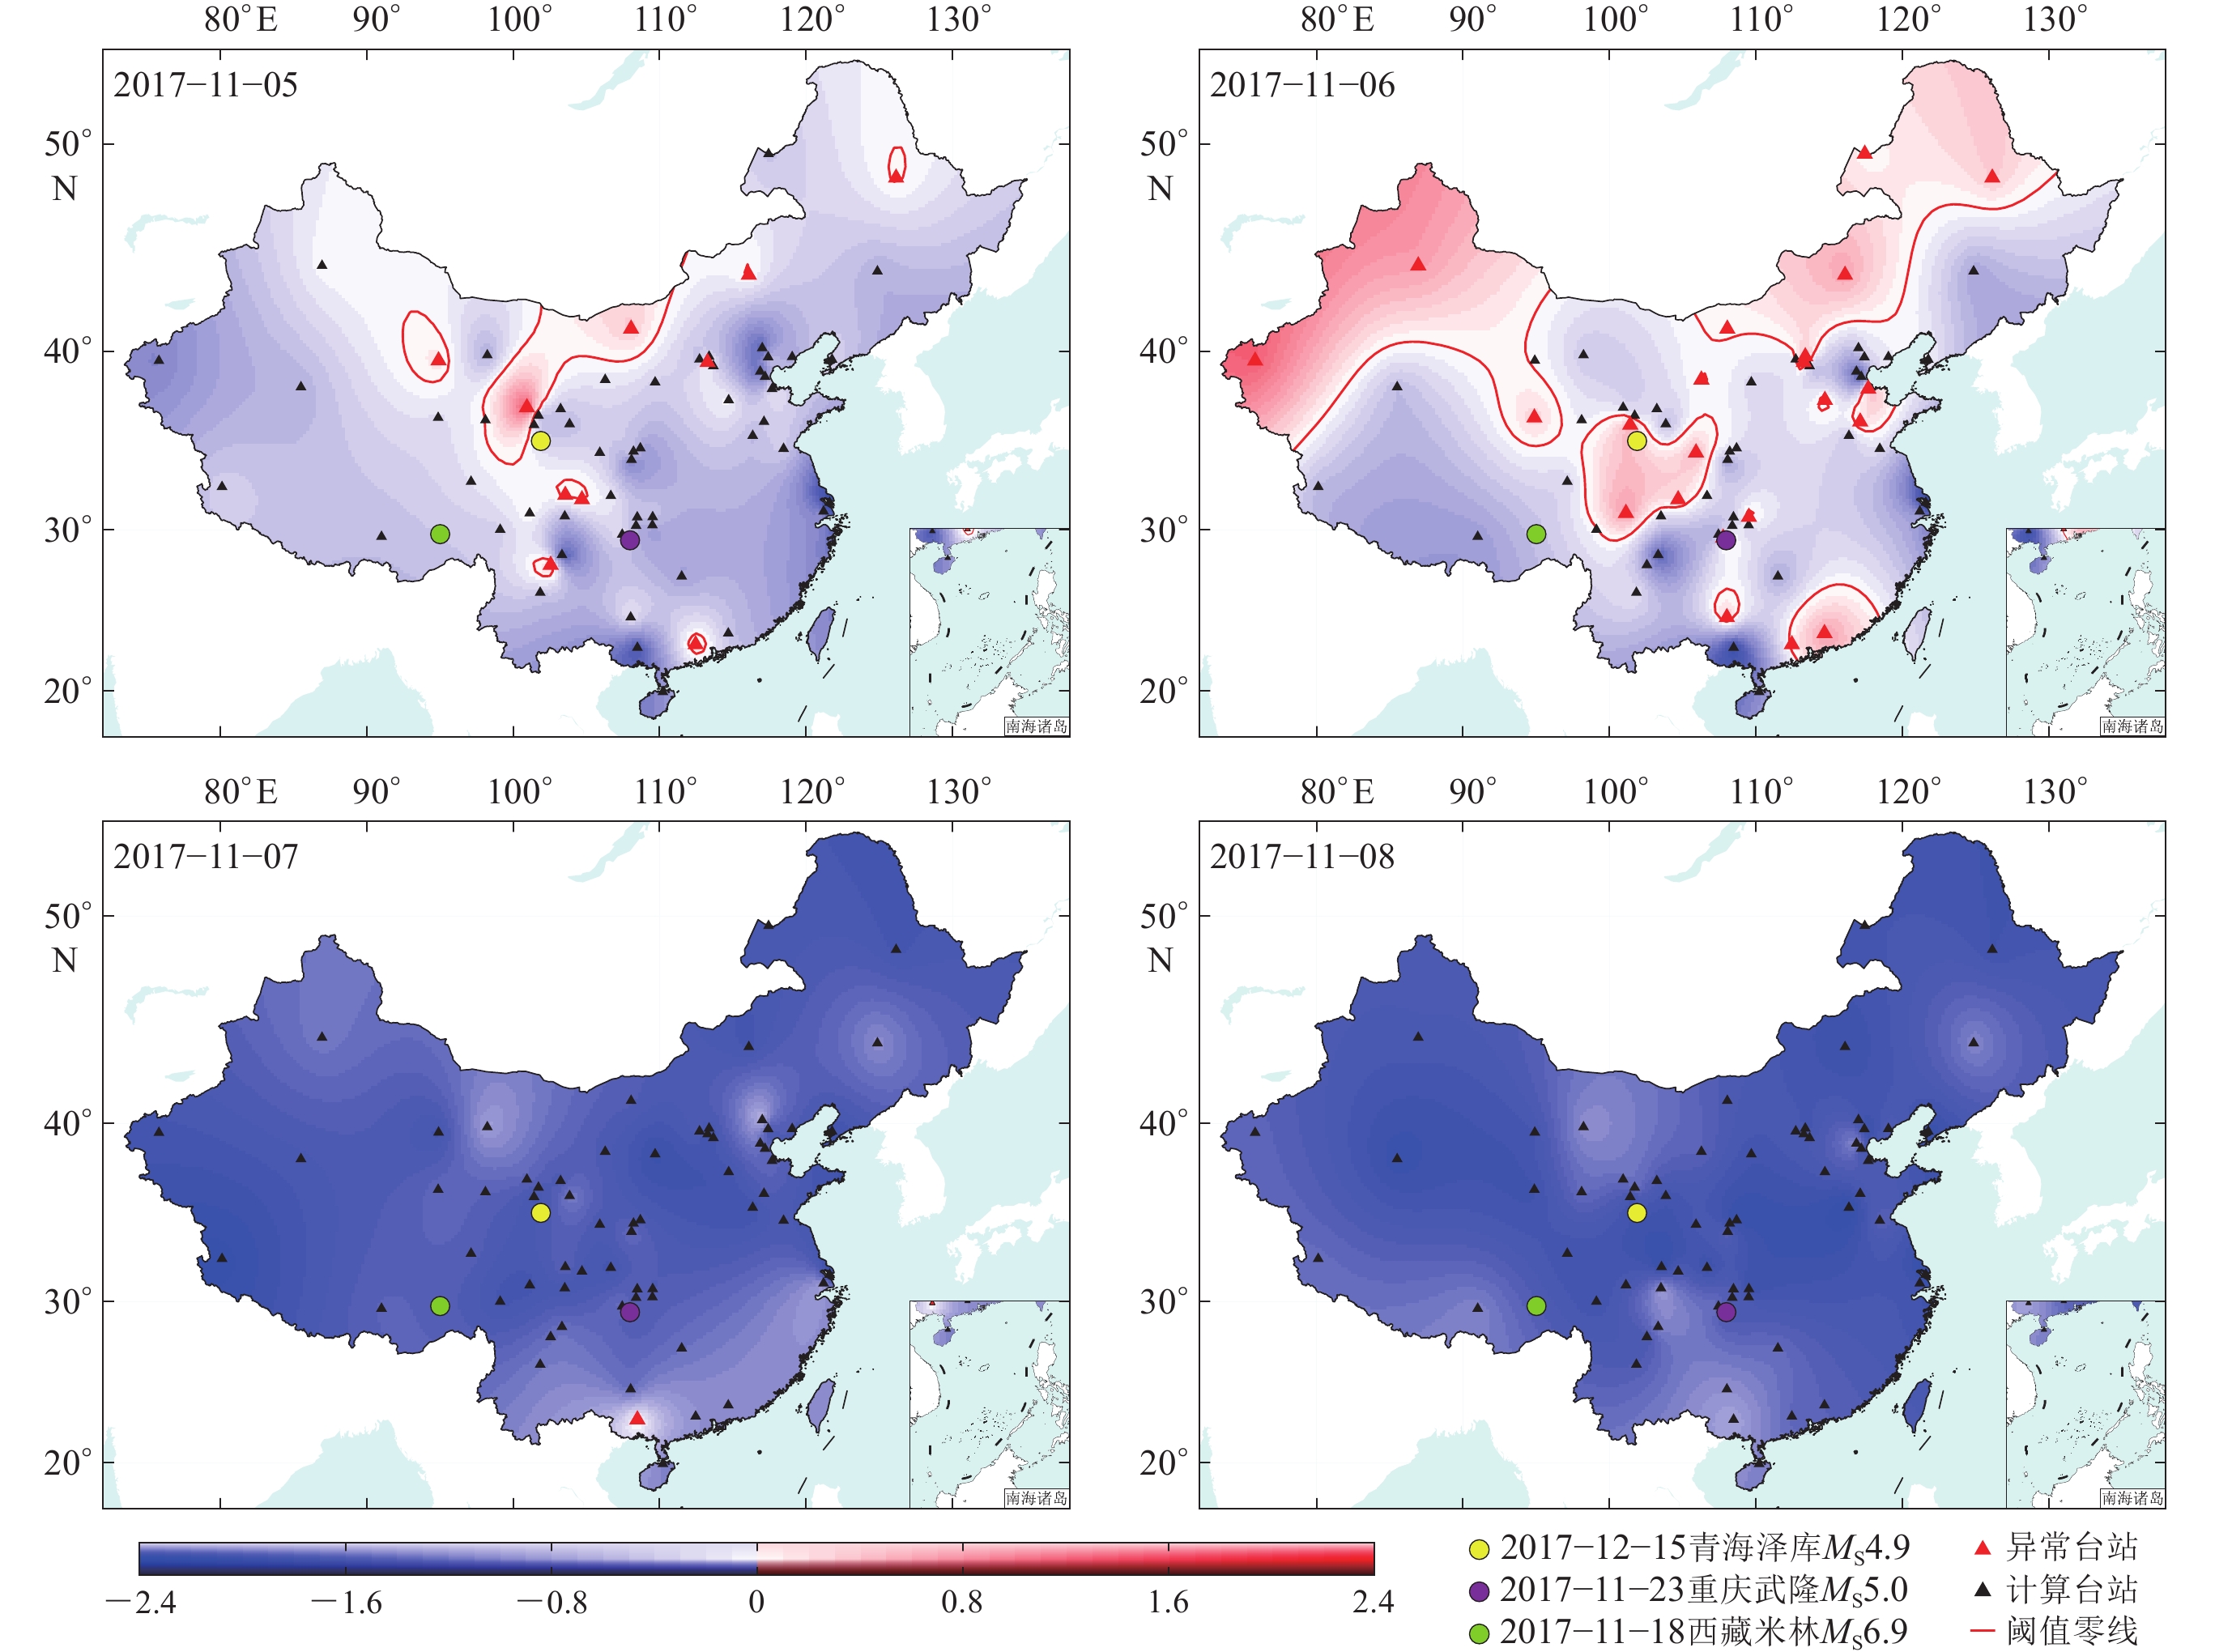
![]()
图 4 2017年10月28日至11月8日全国地磁垂直强度极化异常空间演化过程
Figure 4. Spatial evolution process of geomagnetic vertical intensity polarization anomaly from October 28 to November 8,2017
![]()
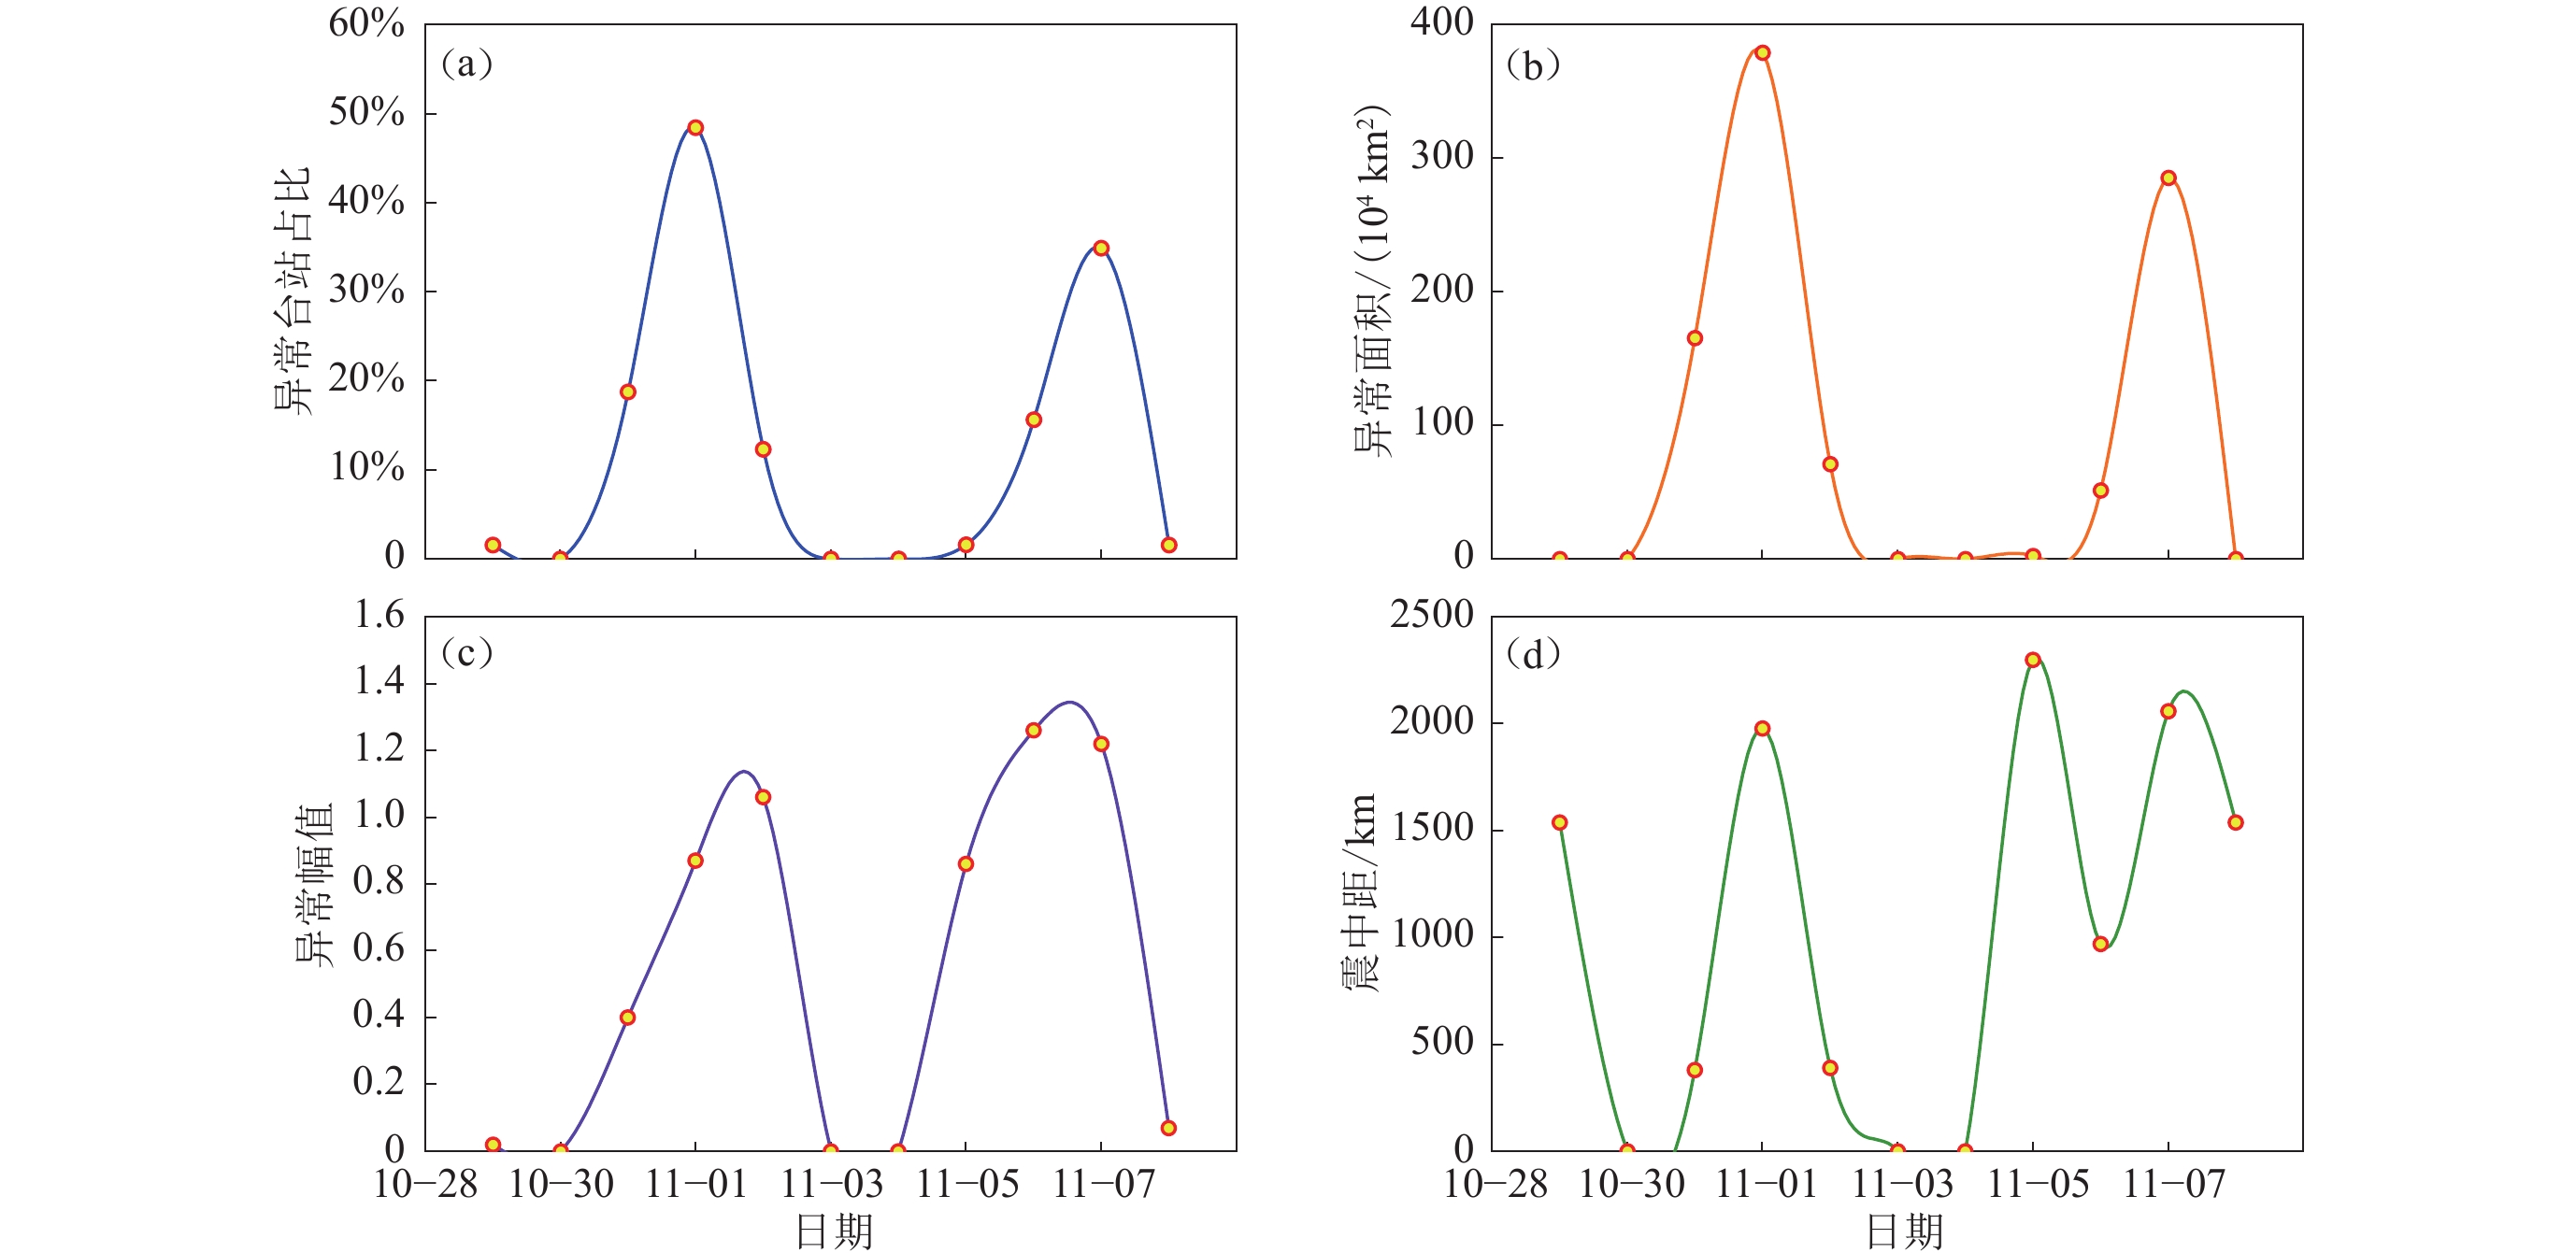
图 5 异常参数统计
(a) 异常台站占比;(b) 异常面积;(c) 异常幅值最大值;(d) 震中距
Figure 5. Statistical graph of abnormal parameters
(a) The proportion of abnormal stations;(b) Anomalous area;(c) Maximum anomalous amplitude;(d) The epicentral distance
![]()
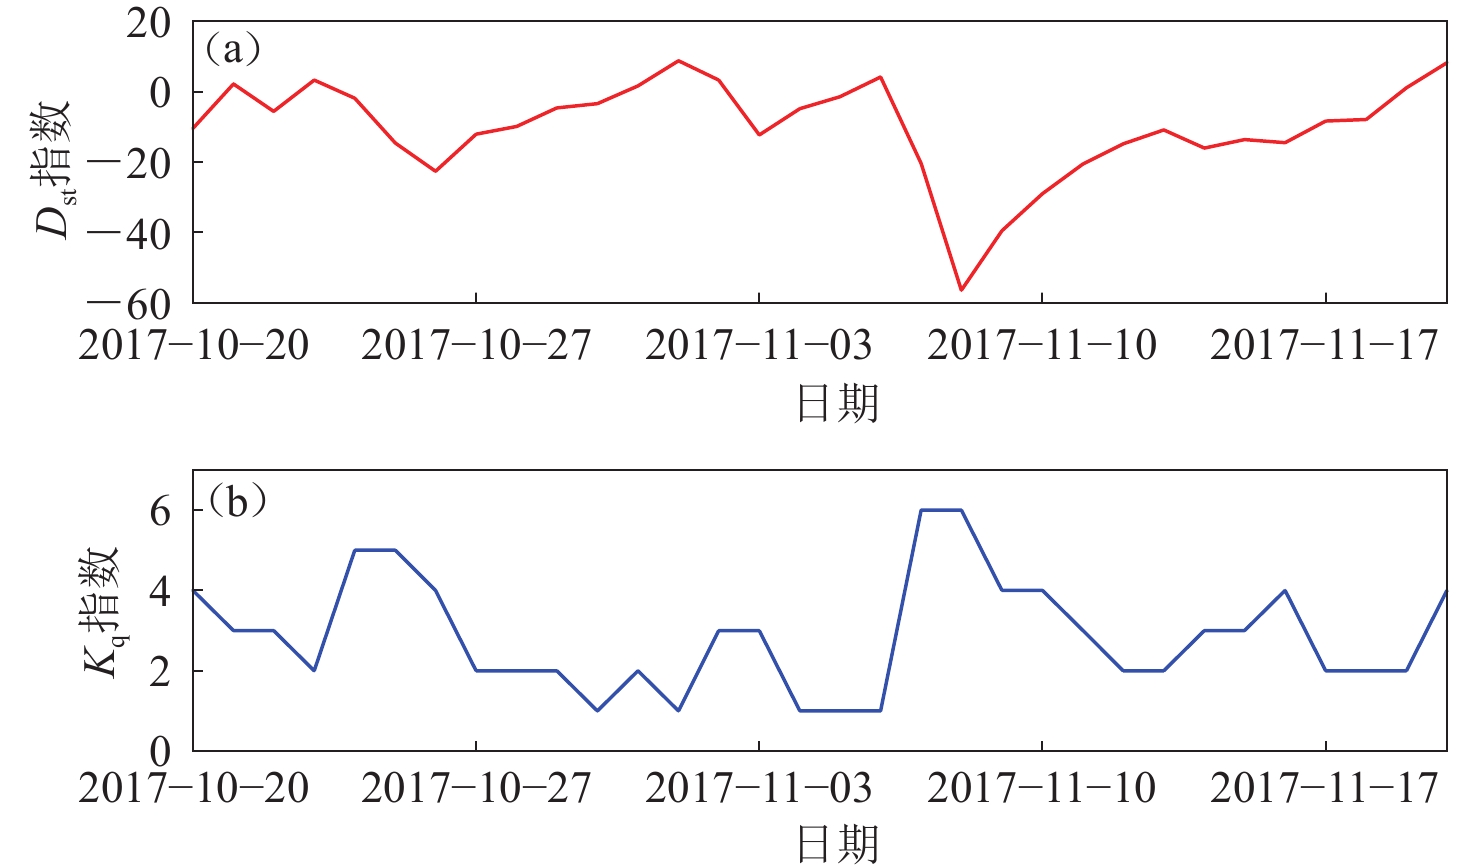
图 6 极化高值异常期间Dst指数(a)和Kp指数(b)的变化情况
Figure 6. Variation of Dst and Kp indices during polarization high value abnormal period
表 1 异常参数统计表
Table 1 Statistical table of abnormal parameters
异常
日期异常面积
/(104 km2)异常台
个数计算台
个数异常
占比异常最大
幅值震中距
/km10月28日 0 1 64 1.56% 0.02 1540 10月29日 0 0 64 0 - - 10月30日 165.2 12 64 18.75% 0.40 380 10月31日 378.9 31 64 48.44% 0.87 1980 11月1日 70.9 8 65 12.31% 1.06 390 11月2日 0 0 65 0 - - 11月3日 0 0 65 0 - - 11月4日 2.3 1 63 1.59% 0.86 2300 11月5日 51.1 10 64 15.63% 1.26 970 11月6日 285.3 22 63 34.92% 1.22 2060 11月7日 0 1 64 1.56% 0.07 1540  下载: 导出CSV
-
杜爱民,周志坚,徐文耀,杨少峰. 2004. 新疆和田ML7.1地震前ULF电磁辐射的激发机理[J]. 地球物理学报,47(5):832–837. doi: 10.3321/j.issn:0001-5733.2004.05.014 Du A M,Zhou Z J,Xu W Y,Yang S F. 2004. Generation mechanisms of ULF electromagnetic emissions before the ML=7.1 earthquake at Hotan of Xinjiang[J]. Chinese Journal of Geophysics,47(5):832–837 (in Chinese).
冯志生,李琪,卢军,李鸿宇,居海华,孙海军,杨福喜,张翼. 2010. 基于磁通门秒值数据的地震ULF磁场可靠信息提取研究[J]. 华南地震,30(2):1–7. doi: 10.3969/j.issn.1001-8662.2010.02.001 Feng Z S,Li Q,Lu J,Li H Y,Ju H H,Sun H J,Yang F X,Zhang Y. 2010. The seismic ULF geomagnetic reliable information exaction based on fluxgate magnetometer data of second value[J]. South China Journal of Seismology,30(2):1–7 (in Chinese).
冯丽丽,冯志生,樊文杰,管贻亮,贺曼秋,李霞,何畅,廖晓峰,艾萨·伊斯马伊力,袁文秀,李莎. 2021. 中国大陆西部强震前超低频磁场时空变化特征[J]. 地震学报,43(3):359–375. Feng L L,Feng Z S,Fan W J,Guan Y L, He M Q,Li X, He C,Liao X F,Aisa Y,Yuan W X,Li S. 2021. Spatio-temporal variation characteristic of the ultra-low frequency magnetic field prior to strong earthquakes of western Chinese mainland[J]. Acta Seismologica Sinica,43(3):359–375.
郝锦绮,钱书清,高金田,周建国,朱涛. 2003. 岩石破裂过程中的超低频电磁异常[J]. 地震学报,25(1):102–111. doi: 10.3321/j.issn:0253-3782.2003.01.013 Hao J Q,Qian S Q,Gao J T,Zhou J G,Zhu T. 2003. ULF electric and magnetic anomalies accompanying the cracking of rock sample[J]. Acta Seismologica Sinica,25(1):102–111 (in Chinese).
何畅,冯志生. 2017. 极化方法在成都地磁台的应用研究[J]. 地震学报,39(4):558–564. doi: 10.11939/jass.2017.04.010 He C,Feng Z S. 2017. Application of polarization method to geomagnetic data from the station Chengdu[J]. Acta Seismologica Sinica,39(4):558–564 (in Chinese).
贺曼秋,冯丽丽,樊文杰,张贵霞. 2019. 九寨沟7.0、精河6.6级地震前地磁垂直强度极化值特征[J]. 国际地震动态,(8):71–72. doi: 10.3969/j.issn.0253-4975.2019.08.059 He M Q,Feng L L,Fan W J,Zhang G X. 2019. The polarization characteristics of geomagnetic vertical intensity before earthquakes of Jiuzhaigou 7.0 and Jinghe 6.6[J]. Recent Developments in World Seismology,(8):71–72 (in Chinese).
李琪,杨星,蔡绍平. 2015. 极化方法应用于地磁台阵的震例分析[J]. 震灾防御技术,10(2):412–417. doi: 10.11899/zzfy20150222 Li Q,Yang X,Cai S P. 2015. Case study of applying polarization method to geomagnetic array data[J]. Technology for Earthquake Disaster Prevention,10(2):412–417 (in Chinese).
廖晓峰,冯丽丽,祁玉萍,李霞. 2019. 地磁极化方法在阿拉善5.0级地震中的应用研究[J]. 地震,39(4):127–135. Liao X F,Feng L L,Qi Y P,Li X. 2019. Application of geomagnetic polarization method in the Alashan M5.0 earthquake[J]. Earthquake,39(4):127–135 (in Chinese).
苏维刚,王培玲,冯丽丽,马震,赵玉红. 2020. 2016年门源MS6.4地震前兆异常演化特征[J]. 地震学报,42(1):24–33. doi: 10.11939/jass.20190108 Su W G,Wang P L,Feng L L,Ma Z,Zhao Y H. 2020. Evolution characteristics of precursory anomalies before the MS6.4 Menyuan,Qinghai,earthquake in 2016[J]. Acta Seismologica Sinica,42(1):24–33 (in Chinese).
解滔,刘杰,卢军,李美,姚丽,王亚丽,于晨. 2018. 2008年汶川MS8.0地震前定点观测电磁异常回溯性分析[J]. 地球物理学报,61(5):1922–1937. doi: 10.6038/cjg2018M0147 Xie T,Liu J,Lu J,Li M,Yao L,Wang Y L,Yu C. 2018. Retrospective analysis on electromagnetic anomalies observed by ground fixed station before the 2008 Wenchuan MS8.0 earthquake[J]. Chinese Journal of Geophysics,61(5):1922–1937 (in Chinese).
姚休义,冯志生. 2018. 地震磁扰动分析方法研究进展[J]. 地球物理学进展,33(2):511–520. doi: 10.6038/pg2018BB0063 Yao X Y,Feng Z S. 2018. Review on the recent development of analysis methods on magnetic disturbance associated with earthquakes[J]. Progress in Geophysics,33(2):511–520 (in Chinese).
张建国. 2017. 强震前电磁辐射异常演化特征及其机理探索研究[D]. 合肥: 中国科学技术大学: 13–15. Zhang J G. 2017. Research on Anomaly Characteristics of Electromagnetic Radiation Signal and Mechanism before Strong Earthquakes[D]. Hefei: University of Science and Technology of China: 13–15 (in Chinese).
中国科学国家空间科学中心空间环境预报中心. 2020. K指数现报[EB/OL]. [2020-06-12]. http://www.sepc.ac.cn/KIndex.php. Space Environment Prediction Center, Center Space Science and Applied Reaserch, Chinese Academy of Sciences. 2020. Station K indices[EB/OL]. [2020-06-12]. http://www.sepc.ac.cn/KIndex.php (in Chinese).
Bernardi A,Fraser-Smith A C,McGill P R,Villard O G. 1991. ULF magnetic field measurements near the epicenter of the MS7.1 Loma Prieta earthquake[J]. Phys Earth Planet Inter,68(1/2):45–63.
Fraser-Smith A C,Bernardi A,McGill P R,Ladd M E,Helliwell R A,Villard O G. 1990. Low-frequency magnetic field measurements near the epicenter of the MS7.1 Loma Prieta earthquake[J]. Geophys Res Lett,17(9):1465–1468. doi: 10.1029/GL017i009p01465
Hattori K. 2004. ULF geomagnetic changes associated with large earthquakes[J]. Terr Atmos Ocean Sci,15(3):329–360. doi: 10.3319/TAO.2004.15.3.329(EP)
Hattori K,Han P,Yoshino C,Febriani F,Yamaguchi H,Chen C H. 2013. Investigation of ULF seismo-magnetic phenomena in Kanto,Japan during 2000−2010:Case studies and statistical studies[J]. Surv Geophys,34(3):293–316. doi: 10.1007/s10712-012-9215-x
Hayakawa M,Kawate R,Molchanov O A,Yumoto K. 1996. Results of ultra-low-frequency magnetic field measurements during the Guam earthquake of 8 August 1993[J]. Geophys Res Lett,23(3):241–244. doi: 10.1029/95GL02863
Hayakawa M,Itoh T,Hattori K,Yumoto K. 2000. ULF electromagnetic precursors for an earthquake at Biak,Indonesia on February 17,1996[J]. Geophys Res Lett,27(10):1531–1534. doi: 10.1029/1999GL005432
Huang Q H. 2002. One possible generation mechanism of co-seismic electric signals[J]. Proc Jpn Acad,Ser B,78(7):173–178. doi: 10.2183/pjab.78.173
Kopytenko Y A,Matiashvili T G,Voronov P M,Kopytenko E A,Molchanov O A. 1993. Detection of ultra-low-frequency emissions connected with the Spitak earthquake and its aftershock activity,based on geomagnetic pulsations data at Dusheti and Vardzia observatories[J]. Phys Earth Planet Inter,77(1/2):85–95.
Molchanov O A,Hayakawa M. 1995. Generation of ULF electromagnetic emissions by microfracturing[J]. Geophys Res Lett,22(22):3091–3094. doi: 10.1029/95GL00781
Molchanov O A,Mazhaeva O A,Protopopov M L,et al. 1992. Electromagnetic VLF radiation of seismic origin observed on the interkosmos-24 satellite[J]. Geomagnetizm I Aeronomiya,32(6):128–137.
Molchanov O,Schekotov A,Fedorov E,Belyaev G,Gordeev E. 2003. Preseismic ULF electromagnetic effect from observation at Kamchatka[J]. Nat Hazards Earth Syst Sci,3(3/4):203–209. doi: 10.5194/nhess-3-203-2003
Prattes G,Schwingenschuh K,Eichelberger H U,Magnes W,Boudjada M,Stachel M,Vellante M,Wesztergom V,Nenovski P. 2008. Multi-point ground-based ULF magnetic field observations in Europe during seismic active periods in 2004 and 2005[J]. Nat Hazards Earth Syst Sci,8(3):501–507. doi: 10.5194/nhess-8-501-2008
Ren H X,Chen X F,Huang Q H. 2012. Numerical simulation of coseismic electromagnetic fields associated with seismic waves due to finite faulting in porous media[J]. Geophys J Int,188(3):925–944. doi: 10.1111/j.1365-246X.2011.05309.x


计量
- 文章访问数: 688
- HTML全文浏览量: 449
- PDF下载量: 76
