

Shallow velocity structure and seismogenic environment in the Zigui section of the Three Gorges Reservoir region of China
-
摘要: 收集了湖北省秭归地区24个流动地震台站2020年6—7月期间的垂直分量连续波形记录,利用背景噪声互相关得到了各台站之间的经验格林函数,提取了0.6—5 s周期范围内的瑞雷波群速度频散曲线,并反演获得了该区域近地表6 km以内的三维S波速度模型。结果显示:秭归盆地及其南部邻区的S波速度明显低于东侧断裂区的S波速度,与研究区不同构造地块的构造演化和沉积特征一致;2014年MS4.2地震发生在研究区垂向高低速交界区;长江区域附近断裂区的S波速度明显降低,表明长江水渗透到断层区,因此秭归地区地震频发与三峡库水荷载和水渗透作用有关。Abstract: After the impoundment of the Three Gorges Reservoir in 2003, shallow earthquakes occurred frequently, which had a great impact on local productions and lives. The study of shallow velocity structure is of great significance for shallow seismic disaster assessment and disaster prevention and reduction in Zigui area. In this paper, based on the vertical component continuous waveform records of 24 mobile seismic stations in Zigui area of Hubei Province from June to July of 2020, the empirical Green’s functions between the stations are obtained by cross-correlation of the ambient seismic noise, the Rayleigh wave group velocity dispersion curves on the period 0.6−5 s are extracted, and the inversion for the three-dimensional S-wave velocity model is obtained within 6 km near the surface of the region. The results show that the S-wave velocity of Zigui basin and its south adjacent area is significantly lower than that of the eastern fault area, which is consistent with the structural evolution and sedimentary characteristics of different structural blocks in the studied area; an earthquake with MS4.2 occurred on the vertical high-velocity and low-velocity junction area of the study area in 2014. The S-wave velocity decreases obviously near the Yangtze River region in the fault zone, indicating that the Yangtze River water penetrates into the fault area. Therefore, the frequent occurrence of earthquakes in Zigui area is related to the water load and water infiltration of the Three Gorges reservoir.
-
-
![]()
图 1 2009—2021年期间地震和本文所用地震台站的分布
地震分布参考郑秀芬等 (2009),盆地和背斜区域划分参考李小勇等(2014)
Figure 1. Distribution of earthquakes in the period of 2009−2021 and seismic stations used in the study
The earthquake distribution refers to Zheng et al (2009),and division between basin and anticline refers to Li et al (2014)
![]()
图 2 不同周期 T下信噪比随截取长度的变化图
实线表示数据有50%的重叠,虚线表示没有重叠
Figure 2. Variation of SNR with different interception lengths under different period T
Solid lines represent 50% overlapping,while dashed lines represent no overlapping
![]()
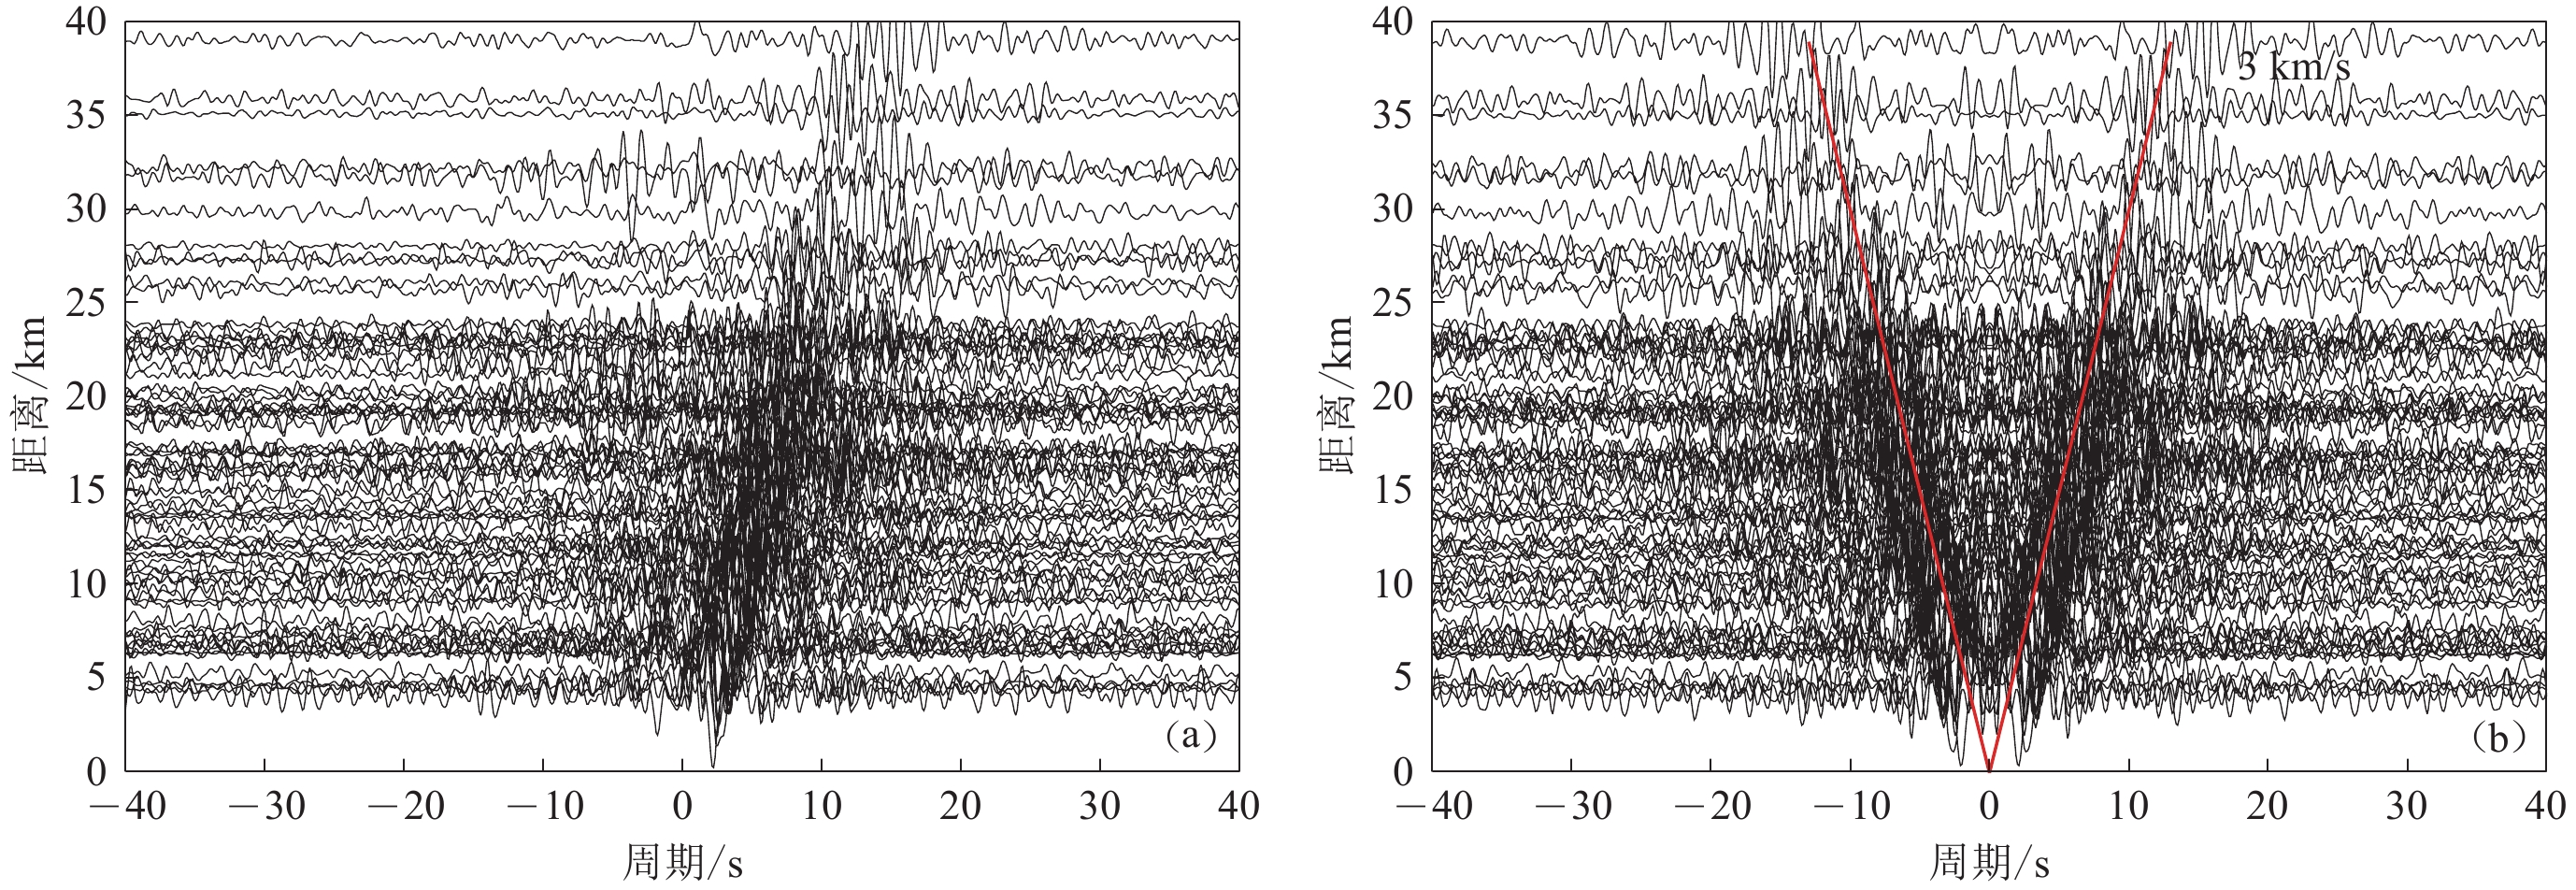
图 3 台站对的背景噪声互相关函数(a)及进行正反向反序求平均后的互相关函数(b)
Figure 3. Cross-correlation functions (NCFs) of ambient noise for all station pairs (a) and NCFs after averaged over positive and negative lag (b)
![]()
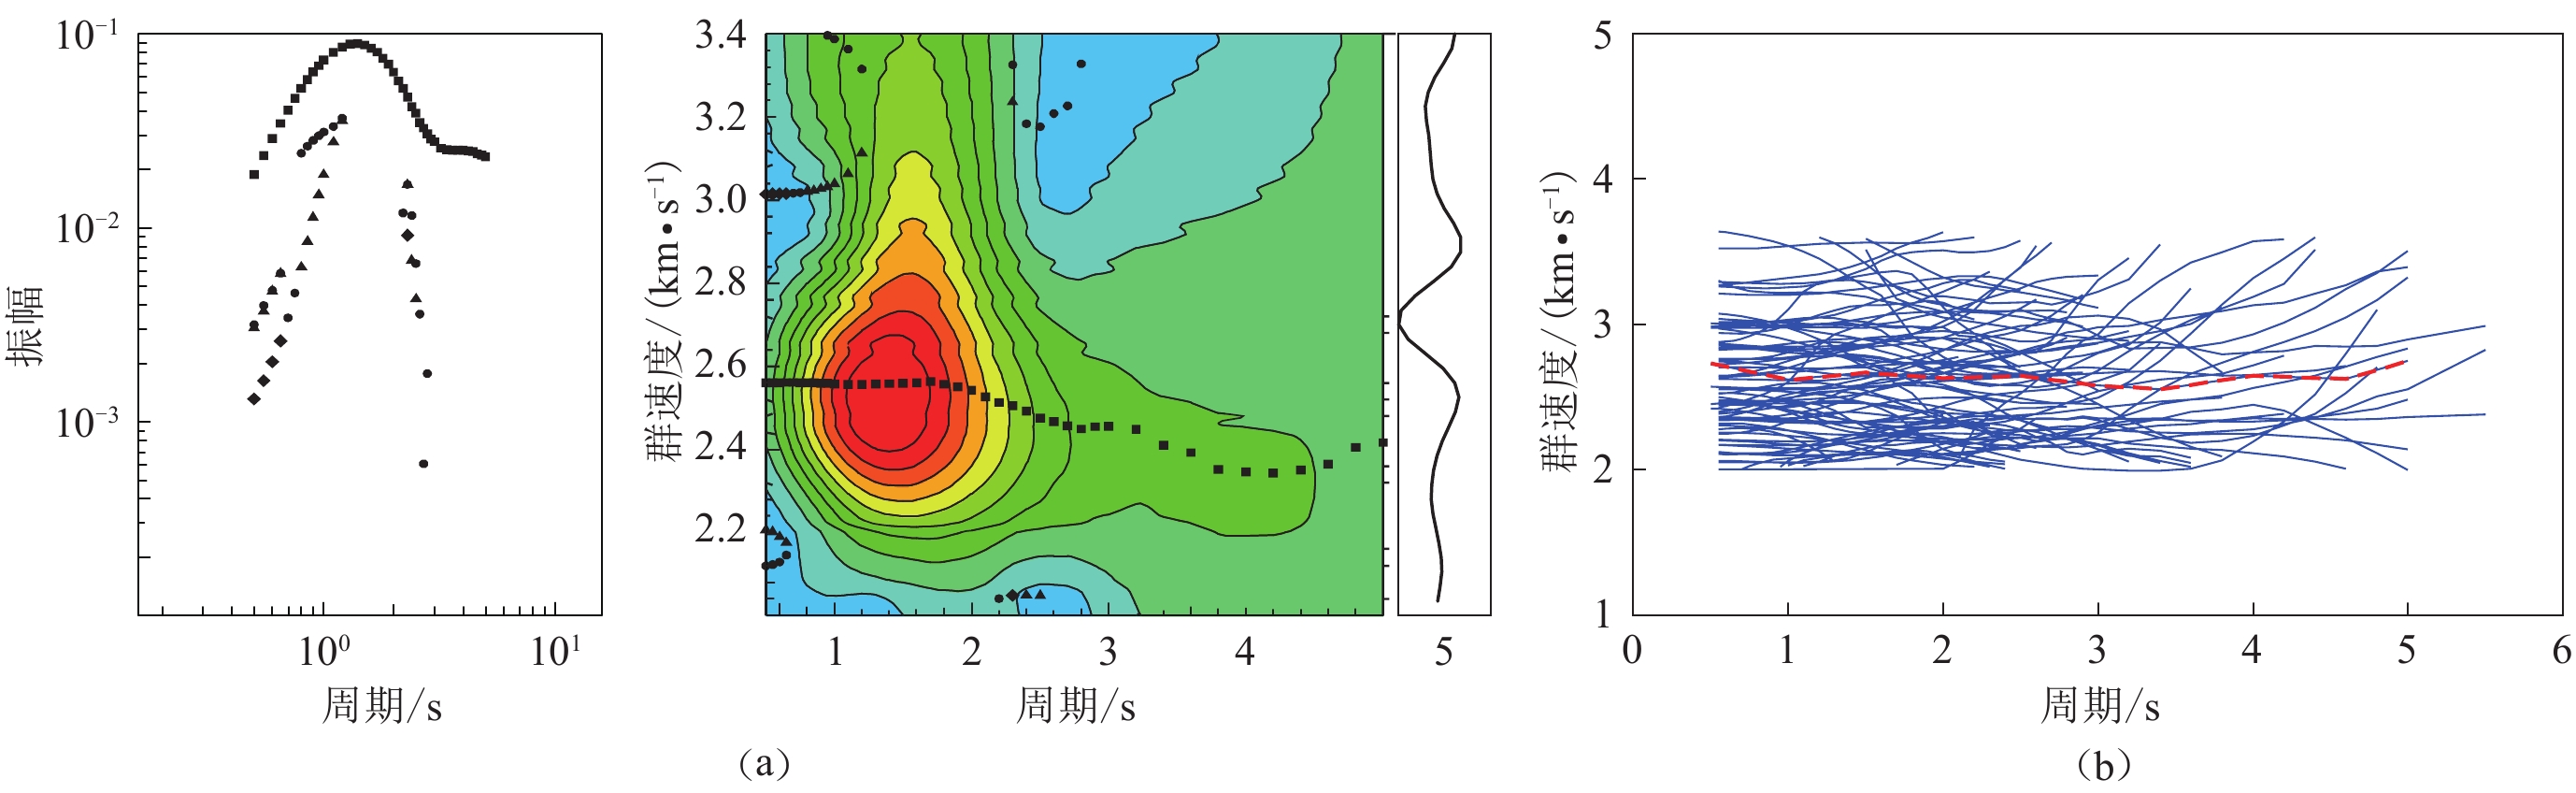
图 4 (a) S04-S21台站对叠加模型预测的瑞雷波群速度模态谱振幅和色散,图中黑色小方块为频散点,红色区域为最大振幅区域;(b)所有台站对的群速度频散曲线,红色虚线表示平均值
Figure 4. (a) Modal spectrum amplitude and dispersion of Rayleigh wave group velocity predicted by the superposition model for the station-pair S04-S21. The small black square is the dispersion point,and the red area is the maximum amplitude area;(b) Group velocity dispersion curves for all station-pairs where the red dotted line represents the mean value
![]()
图 6 不同周期T下检测板测试恢复结果和射线覆盖
Figure 6. Checkerboard test results and ray coverage with different periods T
![]()
图 7 周期为1.2 s时基阶瑞雷波初始残差与反演模型走时残差直方图
Figure 7. Histogram of initial (gray) and inversion (red) travel time residuals of base order Rayleigh wave with period of 1.2 s
![]()
图 8 不同周期T的瑞雷波群速度图像
图中F1代表九畹溪断裂,F2代表仙女山断裂
Figure 8. Rayleigh wave group velocity images of different periods T
F1 stands for Jiuwanxi fault,and F2 for Xiannüshan fault
![]()
图 9 S波反演模型及其频散曲线拟合图
蓝线为初始模型,绿线为最终模型,红线为最终模型正演计算的理论频散,黑色三角为测量频散点(a) 无高低速异常的S波速度结构;(b) 含低速异常S波速度结构;(c) 含高速异常S波速度结构
Figure 9. S-wave inversion model and its dispersion curve fitting diagram
The blue line is the initial model,the green line is the final model,the red line is the theoretical dispersion calculated by the forward modeling of the final model,and the black triangle is the measured dispersion point(a) S-wave velocity structure without low and high velocity anomalies;(b) S-wave velocity structure with low velocity anomalies;(c) S-wave velocity structure with high velocity anomalies
![]()
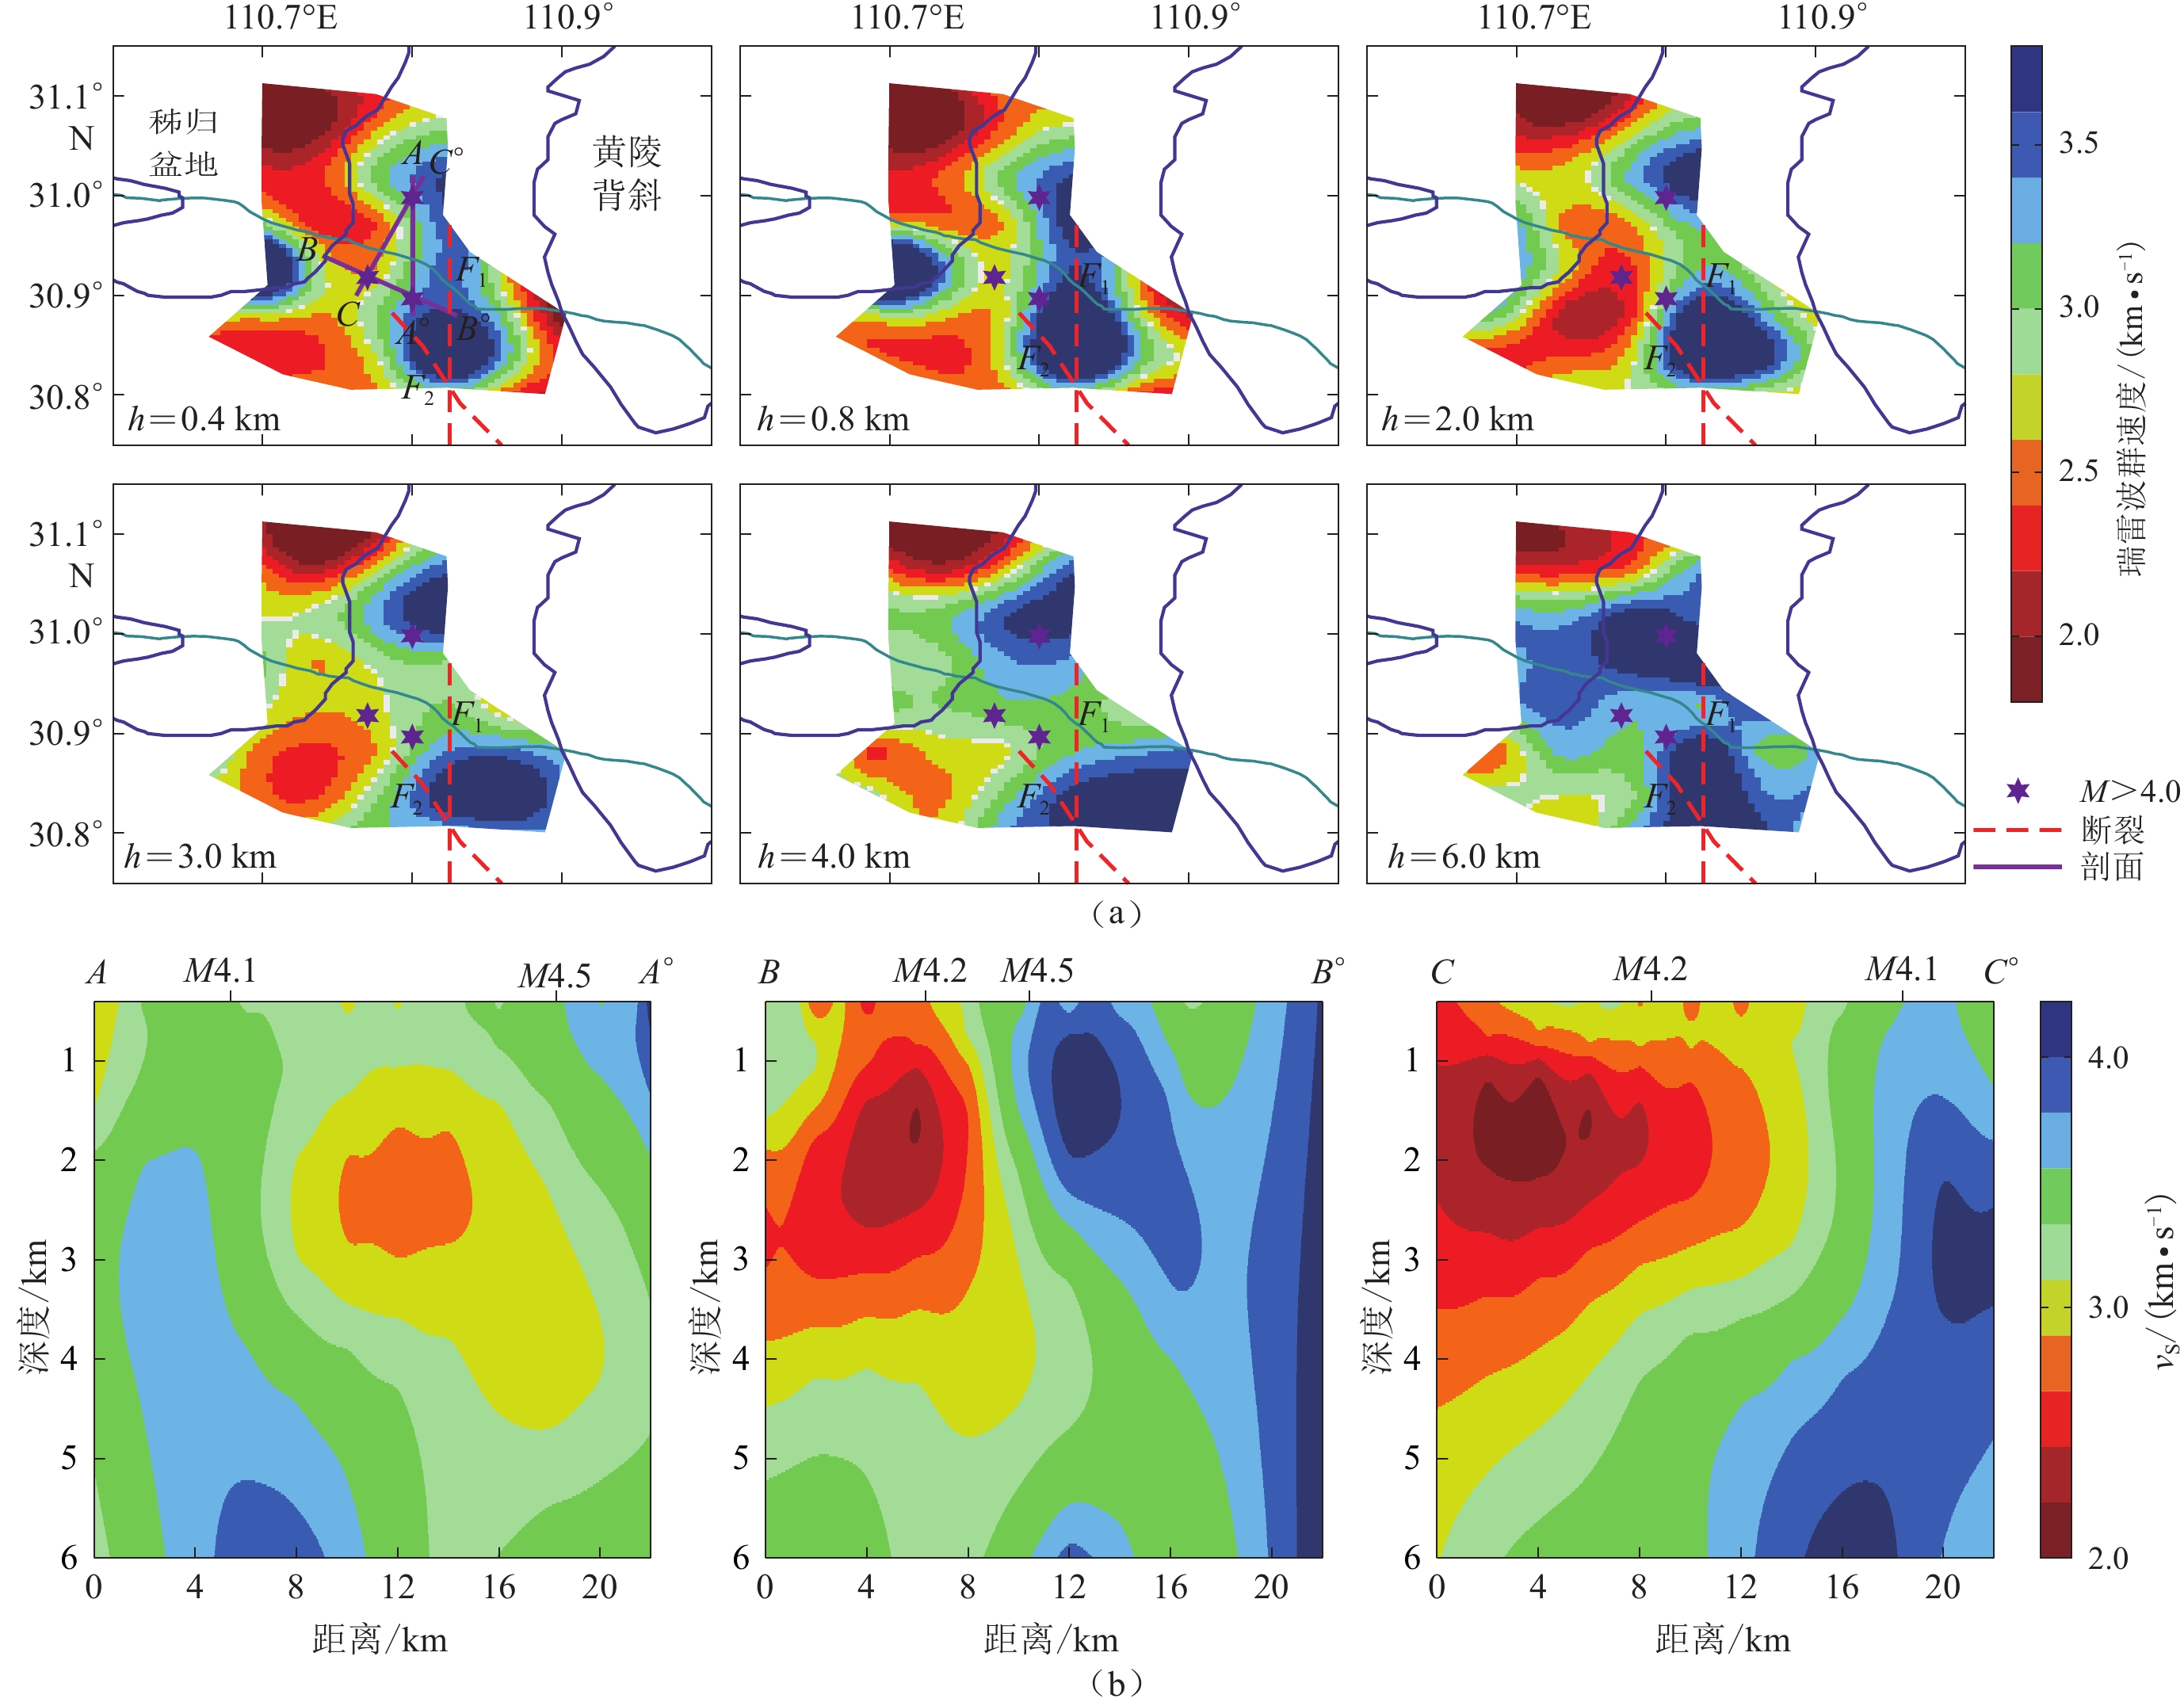
图 10 秭归地区三维S波速度结构
(a) 不同深度h处的S波速度,F1:九畹溪断裂;F2:仙女山断裂;(b) 沿AA′,BB′以及CC′剖面(位置见图10a) 0—6 km深度的S波速度结构
Figure 10. Maps of S-wave velocity structure at different depths in Zigui area
(a) S-wave velocities at different depths h,F1:Jiuwanxi fault;F2:Xiannüshan fault;(b) S-wave velocity structure at the depth of 0−6 km along the sections AA′,BB′ and CC′ (locations are shown in Fig. 10a) respectively
-
车用太,陈俊华,张莉芬,鱼金子,刘成龙,张卫华. 2009. 长江三峡工程库首区胡家坪MS4.1水库诱发地震研究[J]. 地震,29(4):1–13. Che Y T,Chen J H,Zhang L F,Yu J Z,Liu C L,Zhang W H. 2009. Study of the reservoir-induced Hujiaping MS4.1 earthquake in the Three Gorges Dam area[J]. Earthquake,29(4):1–13 (in Chinese).
陈俊华,王秋良,廖武林,李井冈,张丽芬. 2016. 仙女山断裂北端微震群事件震源机制解研究[J]. 大地测量与地球动力学,36(增刊1):109–112. Chen J H,Wang Q L,Liao W L,Li J G,Zhang L F. 2016. Focal mechanism solutions research of microquake swarm in the northern end of the Xiannüshan fault zone[J]. Journal of Geodesy and Geodynamics,36(S1):109–112 (in Chinese).
李安然, 曾心传, 严尊国. 1996. 峡东工程地震[M]. 北京: 地震出版社: 128–135. Li A R, Zeng X C, Yan Z G. 1996. Engineering Earthquakes in the Eastern Yangtze Gorges Area[M]. Beijing: Seismological Press: 128–135 (in Chinese).
李强,赵旭,蔡晋安,刘瑞丰,龙桂华,安艳茹. 2009. 三峡水库坝址及邻区中上地壳P波速度结构[J]. 中国科学:D辑,39(4):427–436. Li Q,Zhao X,Cai J A,Liu R F,Long G H,An Y R. 2009. P wave velocity structure of upper and middle crust beneath the Three Gorges reservoir dam and adjacent region[J]. Science in China:Series D,52(4):567–578. doi: 10.1007/s11430-009-0047-6
李强,赵旭,蔡晋安,刘瑞丰. 2011. 三峡水库坝址及邻区中上地壳S波速度结构[J]. 地震学报,33(1):39–50. doi: 10.3969/j.issn.0253-3782.2011.01.004 Li Q,Zhao X,Cai J A,Liu R F. 2011. S-wave velocity structure of upper and middle crust beneath the Three Gorges reservoir dam and adjacent region[J]. Acta Seismologica Sinica,33(1):39–50 (in Chinese).
李小勇,朱培民,周强,彭松柏,刘江平,刘娇. 2014. 三峡库区上地壳横波速度结构[J]. 地球科学:中国地质大学学报,39(12):1842–1850. Li X Y,Zhu P M,Zhou Q,Peng S B,Liu J P,Liu J. 2014. S-wave velocity structure of upper crust in Three Gorges reservoir region of the Yangtze River[J]. Earth Science:Journal of China University of Geosciences,39(12):1842–1850 (in Chinese). doi: 10.3799/dqkx.2014.167
廖武林,姚运生,丁志峰,张丽芬. 2007. 三峡地区P波速度层析成像研究[J]. 大地测量与地球动力学,27(3):80–84. Liao W L,Yao Y S,Ding Z F,Zhang L F. 2007. Tomographic imagery of P wave velocity structure in Three Gorges region[J]. Journal of Geodesy and Geodynamics,27(3):80–84 (in Chinese).
马文涛,徐长朋,李海鸥,苑京立,徐锡伟,张新东,张兰凤. 2010. 长江三峡水库诱发地震加密观测及地震成因初步分析[J]. 地震地质,32(4):552–563. doi: 10.3969/j.issn.0253-4967.2010.04.003 Ma W T,Xu C P,Li H O,Yuan J L,Xu X W,Zhang X D,Zhang L F. 2010. Intensive observation of reservoir-induced earthquake and preliminary analysis on the causes of earthquakes in Three Gorges reservoir[J]. Seismology and Geology,32(4):552–563 (in Chinese).
孟庆筱. 2012. 设定地震作用下三峡库区黄土坡滑坡稳定性分析[D]. 武汉: 中国地震局地震研究所: 17–18. Meng Q X. 2012. Stability Analysis of Huangtupo Landslide in Three Gorges Reservoir Area Under the Action of Scenario Earthquake[D]. Wuhan: Institute of Seismology, China Earthquake Administration: 17–18 (in Chinese).
宋庆伟,颜丹平,焦守涛,吴钪,董周宾. 2014. 大巴山与雪峰山逆冲构造带J3-K1复合过程的响应:鄂西秭归褶皱带构造样式与形成机制[J]. 地质学报,88(8):1382–1400. Song Q W,Yan D P,Jiao S T,Wu K,Dong Z B. 2014. The response of compounding process of Dabashan and Xuefengshan thrust belt in J3-K1:The structural styles and formation mechanism of the Zigui fold belt,western Hubei[J]. Acta Geologica Sinica,88(8):1382–1400 (in Chinese).
王琼,高原. 2014. 青藏东南缘背景噪声的瑞利波相速度层析成像及强震活动[J]. 中国科学:地球科学,44(11):2440–2450. Wang Q,Gao Y. 2014. Rayleigh wave phase velocity tomography and strong earthquake activity on the southeastern front of the Tibetan Plateau[J]. Science China Earth Sciences,57(10):2532–2542. doi: 10.1007/s11430-014-4908-2
王秋良,张丽芬,廖武林,李井冈,申学林. 2013. 三峡库首区断裂构造与地震活动特征[J]. 大地测量与地球动力学,33(5):29–33. Wang Q L,Zhang L F,Liao W L,Li J G,Shen X L. 2013. Fault tectonics and seismic activity characteristics of Three Gorges reservoir[J]. Journal of Geodesy and Geodynamics,33(5):29–33 (in Chinese).
王秋良,张丽芬,廖武林,李井冈. 2016. 2014年3月湖北省秭归县M4.2、M4.5地震成因分析[J]. 地震地质,38(1):121–130. doi: 10.3969/j.issn.0253-4967.2016.01.009 Wang Q L,Zhang L F,Liao W L,Li J G. 2016. Research on genesis of M4.2 and M4.5 earthquake sequences in March 2014 in Zigui County,Hubei Province[J]. Seismology and Geology,38(1):121–130 (in Chinese).
王泽,吴云龙,张毅,姚运生. 2020. 巴东—秭归地区地壳密度反演及其构造特征[J]. 武汉大学学报(信息科学版),45(11):1763–1770. Wang Z,Wu Y L,Zhang Y,Yao Y S. 2020. Crustal density inversion and its tectonic structure in Badong-Zigui area[J]. Geomatics and Information Science of Wuhan University,45(11):1763–1770 (in Chinese).
吴海波,申学林,杜承宸,陈俊华,王杰. 2015. 2014秭归4.5、4.7级地震前小震活动特征研究[J]. 大地测量与地球动力学,35(5):751–757. Wu H B,Shen X L,Du C C,Chen J H,Wang J. 2015. Study of small earthquakes activity characteristics before the Zigui 4.5,4.7 earthquake in 2004[J]. Journal of Geodesy and Geodynamics,35(5):751–757 (in Chinese).
吴海波,申学林,王杰,赵凌云,陈俊华. 2018. 三峡库区上地壳三维速度结构的双差层析成像研究[J]. 地球物理学报,61(7):2802–2814. doi: 10.6038/cjg2018L0345 Wu H B,Shen X L,Wang J,Zhao L Y,Chen J H. 2018. Three-dimensional velocity structure of upper crust in the Three Gorges reservoir area derived from double-difference tomography[J]. Chinese Journal of Geophysics,61(7):2802–2814 (in Chinese).
夏金梧. 2020. 三峡工程水库诱发地震研究概况[J]. 水利水电快报,41(1):28–35. Xia J W. 2020. Overview of reservoir induced earthquake research on Three Gorges Project[J]. Express Water Resources &Hydropower Information,41(1):28–35 (in Chinese).
谢军. 2016. 背景噪声的验证及应用[D]. 合肥: 中国科学技术大学: 34–50. Xie J. 2016. Verification and Application of Surface Wave From Ambient Noise[D]. Hefei: University of Science and Technology of China: 34–50 (in Chinese).
杨歧焱,吴庆举,盛艳蕊,高家乙,宋键,邸龙. 2018. 张渤地震带及邻区近震体波成像及孕震环境分析[J]. 地球物理学报,61(8):3251–3262. doi: 10.6038/cjg2018L0628 Yang Q Y,Wu Q J,Sheng Y R,Gao J Y,Song J,Di L. 2018. Regional seismic body wave tomography and deep seismogenic environment beneath Zhangbo seismic belt and its adjacent area[J]. Chinese Journal of Geophysics,61(8):3251–3262 (in Chinese).
于品清. 1993. 从水文地质条件探讨未来三峡水库发生构造型水库地震的可能性[J]. 华南地震,13(1):76–83. Yu P Q. 1993. Discussion on the possible tectonic earthquake in Changjiang Three-Gorge Reservoir area in relation to hydrogeologic conditions[J]. South China Journal of Seismology,13(1):76–83 (in Chinese).
张毅,陈超,梁青,王林松,杜劲松,刘圣博. 2012. 三峡地区中上地壳密度结构[J]. 地球科学:中国地质大学学报,37(增刊1):213–222. Zhang Y,Chen C,Liang Q,Wang L S,Du J S,Liu S B. 2012. Density structure of upper and middle crust in Three Gorges reservoir area[J]. Earth Science:Journal of China University of Geosciences,37(S1):213–222 (in Chinese).
赵凌云,邓津,陈俊华,申学林,戴苗,魏贵春. 2010. 基于CAP方法的震源机制研究[J]. 长江科学院院报,27(5):81–84. doi: 10.3969/j.issn.1001-5485.2010.05.018 Zhao L Y,Deng J,Chen J H,Shen X L,Dai M,Wei G C. 2010. Study on source mechanism of MS4.1 and MS3.2 earthquakes in Hubei-Zigui with CAP method[J]. Journal of Yangtze River Scientific Research Institute,27(5):81–84 (in Chinese).
郑秀芬,欧阳飚,张东宁,姚志祥,梁建宏,郑洁. 2009. “国家数字测震台网数据备份中心”技术系统建设及其对汶川大地震研究的数据支撑[J]. 地球物理学报,52(5):1412–1417. doi: 10.3969/j.issn.0001-5733.2009.05.031 Zheng X F,Ouyang B,Zhang D N,Yao Z X,Liang J H,Zheng J. 2009. Technical system construction of Data Backup Centre for China Seismograph Network and the data support to researches on the Wenchuan earthquake[J]. Chinese Journal of Geophysics,52(5):1412–1417 (in Chinese).
Bensen G D,Ritzwoller M H,Barmin M P,Levshin A L,Lin F,Moschetti M P,Shapiro N M,Yang Y. 2007. Processing seismic ambient noise data to obtain reliable broad-band surface wave dispersion measurements[J]. Geophys J Int,169(3):1239–1260. doi: 10.1111/j.1365-246X.2007.03374.x
Hermann R B, Ammon C J. 2002. Computer Programs in Seismology, Version 3.30: Surface Waves, Receiver Functions, and Crustal Structure[M]. St Louis, Missouri: Department of Earth and Atmospheric Sciences, St Louis University: 66–70.
Herrmann R B. 2013. Computer programs in seismology:An evolving tool for instruction and research[J]. Seismol Res Lett,84(6):1081–1088. doi: 10.1785/0220110096
Huang R,Zhu L P,Encarnacion J,Xu Y X,Tang C C,Luo S,Jiang X H. 2018. Seismic and geologic evidence of water-induced earthquakes in the Three Gorges reservoir region of China[J]. Geophys Res Lett,45(12):5929–5936.
Rawlinson N,Sambridge M. 2003. Seismic traveltime tomography of the crust and lithosphere[J]. Adv Geophys,46:81–198.
Yao H J,Gouédard P,Collins J A,McGuire J J,van der Hilst R D. 2011. Structure of young East Pacific Rise lithosphere from ambient noise correlation analysis of fundamental- and higher-mode Scholte-Rayleigh waves[J]. Compt Rend Geosci,343(8/9):571–583.
 下载:
下载:


计量
- 文章访问数: 650
- HTML全文浏览量: 276
- PDF下载量: 193
