

Spatio-temporal relationship between source parameters such as stress drop and significant earthquakes in Changning-Xingwen area
-
摘要: 基于中国地震台网提供的震相观测报告,利用双差方法对长宁—兴文地区2019—2020年1 948个ML≥2.0地震事件进行了重定位,重定位后的1823个ML≥2.0地震事件分布显示长宁—兴文地区北区地震序列沿NW—SE方向背斜展布,而南区地震分布较分散。之后计算了四川长宁—兴文地区2019年6月17日至2020年12月31日208个ML≥3.0地震事件的地震矩和应力降等震源参数,分析了2019年6月17日长宁MS6.0地震后研究区内地震应力降的演化特征,结果显示长宁—兴文地区中强地震发生前ML3.0—3.9地震的应力降显著升高,且ML≥4.0地震多发生在ML3.0—3.9地震的应力降高值区。Abstract: A MS6.0 earthquake with a focal depth of 16 km occurred with the epicenter of (28.34°N, 104.90°E) in Changning county, Yibin city, Sichuan Province on June 17, 2019. There were three strong aftershocks above MS5.0 within five days after the Changning earthquake and another MS5.6 earthquake occurred in Gongxian County on July 4. This paper relocated 1948 ML≥2.0 earthquakes in Changning-Xingwen area during 2019 to 2020 by the double difference method based on the seismic phase observation report provided by China Earthquake Networks Center. The distribution of 1 823 earthquakes above ML2.0 after relocation shows that the aftershock sequence in the northern area of Changning spreads along the NW−SE direction anticline. Moreover, the earthquakes in southern area is more scattered. We calculated source parameters such as seismic moment and stress drop based on 208 earthquakes above ML3.0 in Changning-Xingwen area, Sichuan from 17 June 2019 to 31 December 2020, and analyzed the evolution characteristics of seismic stress drop in the region before and after the Changning MS6.0 earthquake on June 17, 2019. The results show that the stress drop of ML3.0−3.9 earthquakes significantly increased in Changning-Xingwen area before the moderate strong aftershocks, and most of the earthquakes above ML4.0 occurred in the high stress drop area of ML3.0−3.9 earthquakes in the study area.
-
Keywords:
- Changning MS6.0 earthquake /
- relocation /
- stress drop
-
引言
特定构造区(带)因构造活动长期稳定,表现为地震活动重复发生的特点,这种地震的重复性被称作地震的周期性或地震活动的轮回性,其对中长期地震预测有重要的参考意义(梅世蓉,1960;张国民,李丽,1997;马宗晋等,2006)。活动地块是具有构造活动统一性的构造实体(马杏垣,1987),鲁东—黄海地块作为 Ⅱ 级地块,同样具备相对稳定的构造活动特征。已有的研究结果显示鲁东—黄海地块历史地震活动呈现周期性特征,大致经历1585年至1764年、1839年至今两个地震活跃期,目前鲁东—黄海地块可能处于能量释放阶段(陈宇卫等,2005;颜启等,2006;杨云等,2016)。2011年以来鲁东—黄海地块发生5次MS5.0以上地震,包括2021年11月17日江苏大丰海域MS5.0地震和2021年12月14日韩国济州岛附近海域M5.0地震。鲁东—黄海地块MS≥5.0地震丛集现象是否意味着该区域地震活动状态的改变还有待进一步研究,这需要厘清鲁东—黄海地块的历史地震周期特征,以及周边地震对其的影响。已有的针对鲁东—黄海地块历史地震活动周期的研究多以定性或半定量地震活动分析方法为主(陈宇卫等,2005;颜启等,2006;杨云等,2016),近些年发展了Morlet小波变换方法,应用该方法可以定量计算某特定构造区的地震活动周期(杜兴信,1997;尹继尧等,2011;薛艳等,2021)。因此,本文应用Morlet小波变换方法定量计算鲁东—黄海地块(近海)历史地震活动周期。
鲁东—黄海地块作为华北地块的 Ⅱ 级活动地块之一(张培震等,2003),其地震活动周期特征可能受华北地块的地震活动周期影响。华北地块区第Ⅲ、第Ⅳ活跃期大致为1481年至1730年、1815至今(马宗晋等,1982;张国民,傅征祥,1985;顾方琦等,1995;石玉燕等,2007;薛艳等,2020;尹晓菲等,2020)。而鲁东—黄海地块大致经历1585年至1764年、1839年至今两个地震活跃期(陈宇卫等,2005;颜启等,2006),从时间上看两个地区地震活动存在一定的关系,但讨论二者关系的研究较少。鲁东—黄海地块地震活动受东侧的太平洋西带板块俯冲作用的影响方面的成果相对较多,例如:相关性分析及因果关系检验研究结果显示,1974年以来鲁东—黄海地块MS≥4.0地震活动与日本南部M≥5.0地震活动具有相关性和同步性(郑建常,蒋海昆,2007);模糊识别方法计算结果表明,1970年以来日本海沟地区M≥6.8地震和华东MS≥4.8地震有较好的对应关系(章纯等,2000);有限元数值模拟结果反映了太平洋板块对华东沿海地区的作用力是存在的(章纯,2007)。这些边界动力的影响研究多基于1970年以来的地震数据,在地震相关性分析中,使用的地震样本量越多,可能会越接近真实的结果,因此有必要在地震目录完整的前提下,尽可能地增加研究时间,以得到更可靠的规律性特征。鉴于此,在研究鲁东—黄海地块的历史地震活动周期特征基础上,探讨其与华北地块的地震活动关系,及其东侧的太平洋西带的板块俯冲作用的影响。本文拟结合以往地震周期研究成果和近几年MS≥5.0地震活动特征,对鲁东—黄海活动地块地震周期特征和活动状态开展系统研究,以期为鲁东—黄海地块西部地震大形势分析和中长期地震危险性预测提供参考。由于我国与朝鲜半岛及附近的构造差异及历史地震目录(吴戈,2004)记载体系的不同,本文重点讨论鲁东—黄海地块西部历史地震活动特征,同时,运用Morlet小波变换对其周期成分进行定量计算,并分析周边强震活动对其的影响。
1. 研究区及数据
华北 Ⅰ 级活动地块自西向东依次由鄂尔多斯、华北平原和鲁东—黄海三个 Ⅱ 级活动地块构成(邓起东等,2002;张培震等,2003;张国民等,2005)。东侧的鲁东—黄海活动地块最接近太平洋西带俯冲作用的影响区,该活动地块包括江苏大部、鲁东、黄海和朝鲜半岛南部地区。其西边界为郯庐断裂带;东边界为太平洋板块西边界日本岛弧及琉球岛弧带西侧;南边界为秦岭—大别山构造带,该边界也是南北两侧M≥6.0地震活动的分界线;北边界自渤海向东,横穿朝鲜半岛,沿日本海南边界交汇于日本岛弧(张培震等,2003),大致在日本中部地区(37°N左右,图1)。
![]() 图 1 鲁东—黄海地块西部M≥5.0历史地震及东部(125°E以东) 1973年以来M≥5.0地震分布Figure 1. Distribution of M≥5.0 historical earthquakes in the western Ludong-Huanghai block and M≥5.0 earthquakes in the eastern part (east of 125°E) since 1973The earthquakes in the west of 125°E come from the historical earthquakes catalog and the earthquakes rapid report catalog;the earthquakes in the east of 125°E is from the NEIC earthquakes catalog (USGS,2022) since 1973;the boundary of active blocks refers to the research results of Zhang et al (2003)
图 1 鲁东—黄海地块西部M≥5.0历史地震及东部(125°E以东) 1973年以来M≥5.0地震分布Figure 1. Distribution of M≥5.0 historical earthquakes in the western Ludong-Huanghai block and M≥5.0 earthquakes in the eastern part (east of 125°E) since 1973The earthquakes in the west of 125°E come from the historical earthquakes catalog and the earthquakes rapid report catalog;the earthquakes in the east of 125°E is from the NEIC earthquakes catalog (USGS,2022) since 1973;the boundary of active blocks refers to the research results of Zhang et al (2003)鲁东—黄海地块西部为浅源地震(震源深度<60 km),而该地块东边界以东的太平洋板块的俯冲区域中深源地震增多,这是由太平洋板块及菲律宾海板块向欧亚大陆西北方向的俯冲作用所致,这种板块间的俯冲作用自日本南部(近畿)向西北延伸,直至我国吉林汪清深震区。速度结构反演结果显示太平洋板块可能俯冲至东北长白山、渤海地区(姜辉,高祥林,2012)。日本近畿以南以中源、浅源地震为主。全球导航卫星系统(global navigation satellite system,缩写为GNSS)结果显示,太平洋板块以22 mm/a的速度向西北方向运动,菲律宾板块以41 mm/a的速度向西北方向运动,鲁东—黄海地块以6—8 mm/a的速度向东运动(张培震等,2003)。可见鲁东—黄海地块内与其东侧构造环境明显不同,本文着重研究鲁东—黄海地块内部,即鲁东—黄海西部(125°E以西地区)的地震活动特征。
中国历史地震目录(国家地震局震害防御司,1995;中国地震局震害防御司,1999)和中国地震台网中心测定的速报目录中,主要记录我国近海地震,但鲁东—黄海地块内125°E以东区域M5.0以上地震记录较少(3次);美国国家地震信息中心(National Earthquake Information Center,缩写为NEIC)地震目录(1973年以来有记录)(USGS,2022)中,鲁东—黄海地块内125°E以东区域,1981年以来有12次MW≥5.0地震,主要集中于鲁东—黄海地块东北部(图1);MW≥7.0地震主要位于鲁东—黄海地块以东的太平洋板块西带。因此,对于鲁东—黄海地块的地震活动特征,本文拟重点讨论鲁东—黄海地块西部,即125°E以西的历史地震活动特征,并分析鲁东—黄海地块东侧太平洋板块西带交界的MW≥7.0地震和中深源地震对鲁东—黄海地块西部地震活动的影响。
鲁东—黄海地块西部断裂构造较发育,以NE向断裂为主,其中以郯庐断裂带最为突出。该断裂带是新生代以来中国东部大陆大地构造演化中最重要的构造带之一(徐芹芹等,2008),也是鲁东—黄海地块和华北平原地块两个Ⅱ级地块的分界断裂,曾发生东部震级最大的地震,即1668年郯城M8½地震。鲁东—黄海地块西部历史上共发生25次M≥6.0地震,其中73%位于黄海,尤其是黄海南部凹陷集中了鲁东—黄海地区50%的M≥6.0地震(吴戈,2004),该区域地震具有连发的特征,是黄海地区地震强度和频度最高的区域。
鲁东—黄海地块及周边地区1976年以来MW≥5.0地震震源机制解(GCMT,2022)如图2所示。由图可知:鲁东—黄海地块西部以走滑型地震为主,与华北NE向主压应力大体一致;东边界以东的太平洋俯冲带上的地震则以逆冲型为主,该区域还存在部分走滑型或正断型地震。
![]()
地震活动数据使用方面,鲁东—黄海地块西部(125°E以西)及华北地区M≥5.0地震目录均来源于中国历史地震目录(国家地震局震害防御司,1995;中国地震局震害防御司,1999)和中国地震台网中心测定的速报目录。鲁东—黄海地块西部包含苏鲁皖和黄海地区,其中苏鲁皖地区1484年以来M≥4¾地震完备性较好(黄玮琼等,1994;徐伟进,高孟潭,2014);黄海地区1484—1840年只记录到了3次M≥5.0地震,M≥5.0地震目录缺失严重(彭艳菊等,2008),1840年后才有相对密集的M≥5.0地震活动记录,地震目录逐渐完整(图3)。因此,本文将鲁东—黄海地块西部M≥5.0地震活动起始时间定为1840年。
![]() 图 3 鲁东—黄海地块西部M≥5.0地震M-t图Figure 3. M-t diagram of M≥5.0 earthquakes in the western Ludong-Huanghai block
图 3 鲁东—黄海地块西部M≥5.0地震M-t图Figure 3. M-t diagram of M≥5.0 earthquakes in the western Ludong-Huanghai block鲁东—黄海地块东部边界带(125°E以东)地震主要为俯冲带地震,本文重点讨论其对鲁东—黄海地块西部地震活动的影响。采用1900—1999年全球MW7.0以上地震目录(Engdahl,Villasenor,2002),2000年后采用哈佛大学GCMT (2022)目录。该目录1900年以来MW7.0以上地震基本完备(薛艳等,2021),震级为MW标度。但在讨论中深源地震影响时,使用NEIC地震目录(USGS,2022),该目录自1973年以来MW≥5.0地震震源深度数据较完整。
2. 中强地震活动周期特征
在对鲁东—黄海地块西部历史地震活动周期、最大震级、地震频次、能量释放等分析的基础上,使用Morlet小波变换对地震活动周期进行定量计算,研究鲁东—黄海西部地震活动状态及周期特征。
2.1 历史地震活动周期定性分析
华北地区自1815年开始进入第Ⅳ活跃期,经历了1966年至1976年的地震强释放阶段(马宗晋等,1982;张国民,傅征祥,1985;薛艳等,2020)。鲁东—黄海地块为华北地块的次级地块,其历史地震活动与华北地块的整体活动密不可分。鲁东—黄海地块西部1840年以来M≥5.0地震相对较完备,因此本文基于华北第Ⅳ活跃期的大框架研究该地块西部的历史地震活动特征。
1840年以来,鲁东—黄海地块西部M5.0以上地震逐渐衰减,表现在地震强度、频次、能量释放方面(图4b,4c,表1)。在衰减过程中叠加了“活跃—平静”交替活动特征(图4a),活跃时段大致为三个,即1844—1879年、1905—1949年和1974年至今,各时段持续时间、释放地震能量、地震频次等信息详列于表1。由表1可知:活跃时段平均持续时间为40 a左右,M≥5.0地震发生频次平均为17次左右,M≥5.0地震平均释放能量为2.88×10¹⁵ J,并且释放的地震能量、地震强度和地震频次随时间由强逐渐减弱。
![]() 图 4 1840年以来鲁东—黄海地块西部M≥5.0地震M-t图(a),年释放能量(b)和年频次(60个月窗长,1个月滑动步长)(c)Figure 4. M-t diagram (a),annual released energy (b) and annual frequency (60 months window length,1 month sliding) (c) of M≥5.0 earthquakes in the western Ludong-Huanghai block表 1 鲁东—黄海地块西部活跃时段地震活动特征统计表Table 1. Statistics of seismicity characteristics during active period in the western Ludong-Huanghai block
图 4 1840年以来鲁东—黄海地块西部M≥5.0地震M-t图(a),年释放能量(b)和年频次(60个月窗长,1个月滑动步长)(c)Figure 4. M-t diagram (a),annual released energy (b) and annual frequency (60 months window length,1 month sliding) (c) of M≥5.0 earthquakes in the western Ludong-Huanghai block表 1 鲁东—黄海地块西部活跃时段地震活动特征统计表Table 1. Statistics of seismicity characteristics during active period in the western Ludong-Huanghai block活跃时段 起止年份 持续时间/a M≥5.0地震
总能量/(1014J)M≥5.0地震
频次M≥6.0地震
频次最大震级/M M≥5.0地震
平均年频次Ⅰ 1 844—1 879 36 33.3 16 7 7.0 0.44 Ⅱ 1 905—1 949 45 24.3 1 9 6 6.8 0.42 Ⅲ 1 974—2 013 40 4.19 15 4 6.2 0.36 1 974年至今 50.5 4.21 16 4 6.2 0.32 在每个活跃时段又存在着类似的强释放和弱释放两个阶段,在Ⅰ, Ⅱ两个活跃时段前半程以M≥6.0地震强释放为主;后半程则以M≥6.0地震频次降低,M≥5.0地震弱活动为主,弱活动后在活跃时段结束时再次出现相对较强的地震活动。从地震强度、频次、能量释放等方面进行定量分析,以出现10年以上M≥6.0地震平静为分段标志,研究分段活动特征,结果列于表2。由表2可知:在活跃时段中的强释放、弱释放两个阶段,持续时间、地震能量释放、地震频次以及最大震级差都有明显差异,强、弱释放阶段最大震级差约为0.5—0.8,M≥6.0地震主要发生在强释放阶段,弱释放阶段仅发生个别M≥6.0地震,而且M≥5.0地震频次明显低于强释放阶段,大约为强释放阶段的18%—40%,弱释放阶段地震能量释放大约是强释放阶段的5%—13%。
表 2 鲁东—黄海地块西部活跃时段强、弱释放活动特征统计表Table 2. Statistics of characteristics of strong and weak release activities during active period in the western Ludong-Huanghai block活跃时段 起止
年份持续
时间/aM≥5.0地震
总能量/JM≥5.0
地震频次M≥6.0
地震频次最大地震
震级/MM≥5.0地震
平均年频次弱释放时段
与强释放
时段能量
百分比强释放时段
与弱释放时段
最大地震
震级差弱释放期与强
释放期M≥5.0
地震平均年频次
的百分比Ⅰ ① 1 844—1 853 10 2.94×10¹⁵ 11 6 7.0 1.1 13.3% 0.5 18.2% ② 1 854—1 879 26 3.91×10¹⁴ 5 1 6.5 0.2 Ⅱ ① 1 905—1 932 28 2.32×10¹⁵ 15 5 6.8 0.5 4.7% 0.8 40% ② 1 933—1 949 17 1.08×10¹⁴ 4 1 6.0 0.2 Ⅲ ① 1 974—1 996 23 4.09×10¹⁴ 11 4 6.2 0.5 2.4% 0.9 40% ② 1 997—2 013
1997年至今17
27.59.63×1012
1.16×10134
50
05.1
5.10.2
0.22.8% 0.9 40% 注:① 强释放;② 弱释放。 各活跃时段的强、弱释放阶段的地震能量释放、最大震级差、M≥5.0地震年频次特征如图5所示,活跃时段Ⅲ与活跃时段Ⅱ各统计参数数值更相近,并且1900年以来海域M5.0以上地震更完整,所以目前鲁东—黄海地块西部处于活跃时段(1974年以来)的弱释放阶段(1997年以来)。类比前两个活跃时段(Ⅰ , Ⅱ)强弱释放阶段的特征,地震频次和地震震级差可能处于活跃时段,不过M≥5.0地震释放总能量略低,按活跃时段Ⅱ的强弱释放能量的比例关系(4.7%),目前尚有7.8×10¹³ J的地震能量有待释放,若按一次最大能量释放,强度可达MS6.0左右,若按MS5.5地震考虑,大概会发生5—6次地震。2013年以来的MS5.0地震活动表明,目前鲁东—黄海地块西部仍处于活跃时段的弱释放阶段。
![]() 图 5 各活跃时段强、弱释放阶段释放能量、最大震级差、年频次特征(a)及活跃时段Ⅱ,Ⅲ M5.0以上地震频次图,窗长60个月(b)Figure 5. Released energy,maximum magnitude difference,annual frequency characteristics of strong and weak release stages in each active period (a) and frequency diagram of M≥5.0 earthquakes in active period Ⅱ and Ⅲ window length of 60 months (b)
图 5 各活跃时段强、弱释放阶段释放能量、最大震级差、年频次特征(a)及活跃时段Ⅱ,Ⅲ M5.0以上地震频次图,窗长60个月(b)Figure 5. Released energy,maximum magnitude difference,annual frequency characteristics of strong and weak release stages in each active period (a) and frequency diagram of M≥5.0 earthquakes in active period Ⅱ and Ⅲ window length of 60 months (b)综上,1840年以来鲁东—黄海地块西部地区中强地震强度由强到弱,并且呈现分阶段(活跃—平静)活动的特点,现在可能处于活跃时段末期,以M5.0地震活动为主,地震强度明显弱于活跃时段Ⅱ。
此外,南黄海地区在三个活跃时段均为主释放区,每个活跃时段均发生多次M6.0以上地震。前两个活跃时段首发、结束的M5.0以上地震均位于南黄海地区,首发地震分别为1844年12月2日长江口M5.0地震和1905年4月28日黄海M5.3地震,结束地震分别为1879年4月4日黄海M6½地震和1949年1月14日黄海M5.8地震。活跃时段Ⅲ首发地震为1974年4月22日江苏溧阳MS5.5地震,是否遵循开始与结束地点一致,因样本量太少,不具备统计特征。总体而言,黄海地区是鲁东—黄海地块中强地震活跃地区,首发与结束地震多位于该区域。
2.2 地震活动周期的Morlet小波定量计算
运用Morlet小波计算方法(薛艳等,2020)对鲁东—黄海地块西部地震活动的周期性进行定量计算。首先选取1840年以来鲁东—黄海地块西部M≥5.0地震贝尼奥夫(Benioff)年应变释放作为离散信息源,其次用Morlet小波变换方法计算其周期成分。为了检验小波功率谱是否显著,合成两个正弦函数作为随机噪声,对上述小波分析方法进行95%和90%置信区间检验(薛艳等,2020;尹继尧等,2011)。计算结果如图6所示,由图可知,贝尼奥夫应变的周期性较明显,存在两个显著的周期成分,分别为66.1—72.1 a和5.4—6.4 a (通过95%置信度检验)及60.6—78.6 a和5.4—7.0 a (通过90%置信度检验)。图6b为小波总功率谱,即小波功率谱在所有时间的累积平均值。
![]() 图 6 鲁东—黄海地块西部M≥5.0地震贝尼奥夫应变周期(a)与小波总功率谱(b)Figure 6. Benioff strain period (a) and total wavelet power spectrum (b) of M≥5.0 earthquakes in western Ludong-Huanghai block
图 6 鲁东—黄海地块西部M≥5.0地震贝尼奥夫应变周期(a)与小波总功率谱(b)Figure 6. Benioff strain period (a) and total wavelet power spectrum (b) of M≥5.0 earthquakes in western Ludong-Huanghai block结合图4a,周期60.6—78.6 a为活跃时段及其后平静时段的总和,第一个周期(活跃时段Ⅰ 与其后的平静时段)为1844—1904年,约61 a;第二个周期(活跃时段Ⅱ与其后的平静时段)为1905—1973年,约69 a;第三个周期(活跃时段Ⅲ至今的时间)为1974年至今,约50.5 a。因此,前两个周期基本处于最显著的60.6—78.6 a周期,目前处于第三个周期,至少还需十余年才能结束。5.4—7.0 a的显著周期可能反映活跃时段内的M≥5.0地震的显著活动周期,三个地震活跃时段内M≥5.0地震和M≥5.5地震的平均时间间隔分别为2.7 a和3.7 a,与5.4—7.0 a的显著周期不符。在每个活跃时段强、弱释放差异显著,可能短周期反映的是强释放时M≥5.0地震的活跃—平静特征。因此,鲁东—黄海西部M≥5.0地震活动存在66.1—78.6 a的显著长周期活跃—平静特征。
2.3 空间活动特征
鲁东—黄海地块西部活跃时段Ⅰ —Ⅲ中强地震活跃,空间分布特征各异(图7):
![]()
活跃时段Ⅰ(1844—1879年,图7a),鲁东—黄海地块西部发生M≥5.0地震16次,其中M6.0—6.9地震6次,M≥7.0地震1次(1846年8月4日黄海M7.0)。M≥6.0地震均集中于南黄海地区,是南黄海地区有历史地震记录以来地震释放最强的时段。陆地区域最大地震为1859年3月12日山东临沂M5½地震、1868年10月30日安徽定远M5½地震和1872年9月21日江苏太湖M5½地震,活动强度均弱于海域。
活跃时段Ⅱ(1905—1949年,图7b),鲁东—黄海地块西部M≥5.0地震主要位于南黄海至北部胶东半岛,M≥5.0地震共19次,其中M6.0—6.9地震6次,最大为1910年黄海M6¾地震,该地震距离1846年黄海M7.0地震北部约169 km,距离南黄海中强地震集中区约105 km。
活跃时段Ⅲ(1974年至今,图7c),MS≥5.0地震活跃区又返回到南黄海地区,并且陆区也出现了MS6.0地震,这是不同于前两个活跃时段的特征。该时段发生MS≥5.0地震16次,MS≥6.0地震4次,分别为1979年7月9日江苏溧阳MS6.0地震、1984年5月21日黄海MS6.1和MS6.2地震以及1996年11月9日南黄海MS6.1地震。从MS≥6.0地震的频次和强度来看,活跃时段Ⅲ明显弱于前两个活跃时段,但陆地的MS≥6.0地震活动明显强于前两个活跃时段。
3. 周边地震影响分析
3.1 鲁东—黄海地块西部与华北地震活动的呼应关系
鲁东—黄海地块为华北地块内的次级地块,位于华北地块的东侧。从1815年以来鲁东—黄海地块西部和华北地块的地震活动周期特征来看,鲁东—黄海地块西部M≥5.0地震活动与华北地块M≥6.0地震的活跃—平静时段大致同步,呈现三组中强地震起伏活动,分别为1846—1888年、1910—1948年和1966—1998年,每组起伏活动持续时间约为33—43 a (图8)。
![]() 图 8 鲁东—黄海西部M≥5.0地震(a)和华北地块M≥6.0地震(b)的M-t图Figure 8. M-t diagrams of M≥5.0 earthquakes in the western Ludong-Huanghai block (a) and M≥6.0 earthquakes in North China block (b)
图 8 鲁东—黄海西部M≥5.0地震(a)和华北地块M≥6.0地震(b)的M-t图Figure 8. M-t diagrams of M≥5.0 earthquakes in the western Ludong-Huanghai block (a) and M≥6.0 earthquakes in North China block (b)华北地块自1815年开始处于第Ⅳ活跃期,M≥6.0地震平均平静时间为3.8 a,1倍均方差约为9.4 a,从华北地块M≥6.0地震发震间隔来看,M≥6.0地震平静超过12年可视为极其显著现象(超过1倍均方差)。1815年以来达到12年以上的M≥6.0地震平静共出现6次,其中前3次显著平静结束后首发的M≥6.0地震均位于鲁东—黄海地块西部的黄海地区,分别为1846年8月4日黄海M7.0地震、1879年4月4日黄海M6½地震和1910年1月8日黄海M6¾地震,然后逐渐向华北地块的中西部地区活动(图9)。华北地块第4和第5个M6.0地震显著平静后,首发的M≥6.0地震位于华北中西部地区,分别为1966年3月8日河北邢台MS6.8地震和1996年5月3日内蒙古包头MS6.4地震,其后逐渐向东南的鲁东—黄海地块西部活动(图9)。其原因可能是鲁东—黄海地块西部是华北地块的次级块体,1846—1888年和1910—1948年又恰好处于鲁东—黄海地块西部中强地震较强活跃时段(活跃时段 Ⅰ :1844—1879年;活跃时段Ⅱ:1905—1949年),综上所述,鲁东—黄海地块为华北地块内的次级块体,其中强震的活跃—平静变化在华北第Ⅳ活跃期内与华北地块M≥6.0地震存在一定的呼应关系,华北地块M≥6.0地震显著平静后首发的M≥6.0地震是否在鲁东—黄海地块西部,与鲁东—黄海地块西部的中强地震活跃强弱有关。
![]()
3.2 太平洋西带MW7.0以上地震对研究区地震活动的影响
太平洋板块对欧亚板块的俯冲作用是华北地区地震活动的重要动力来源(茂木清夫,1976),位于太平洋板块俯冲带的日本及其周边地区的强震活动对我国华北地区的地震活动具有重要影响(吴佳翼等,1979;孙文斌等,1985;马宏生等,2003;郑建常,蒋海昆,2007),日本海沟地区MW6.8以上地震对华东地区MS4.8以上地震的发生有一定的中期指示意义(章纯等,2000)。本部分主要探讨鲁东—黄海活动地块以东的太平洋板块西带(与鲁东—黄海地块以东交界区域)MW7.0以上地震及中深源地震对鲁东—黄海地块西部MS5.0以上地震的影响。
图10给出了所有纳入本文统计分析的地震震中分布,图11给出了鲁东—黄海地块以东的太平洋板块西带的MW7.0以上地震时序、蠕变曲线(图11中红色曲线)和西部M5.0以上地震蠕变曲线(图11中蓝色曲线)。结果显示,1900—1953年鲁东—黄海地块西部、太平洋板块西带地震活动相对较强,表现为太平洋板块西带MW7.5以上地震、鲁东—黄海地块西部M6.0以上地震同期活跃,同时太平洋板块西带MW7.0以上地震和鲁东—黄海地块西部M5.0以上地震蠕变曲线加速显著;而在1954年后表现为太平洋板块西带地震活动降为MW7.5以下、鲁东—黄海地块西部MS6.0地震活动显著减少且以MS5.0—6.0地震为主,二者相应的地震蠕变曲线均显著减缓。因此,从地震活动趋势来看,二者的地震活动强、弱大致同步。郑建常和蒋海昆(2007)的研究结果也认为鲁东—黄海地块与日本南部地区的地震活动具有一定的相关性和同步性。
![]() 图 10 鲁东—黄海地块以东太平洋西带MW≥7.0地震及鲁东—黄海地块西部M≥5.0地震震中分布Figure 10. Epicenter distribution of MW≥7.0 earthquakes in the western Pacific belt to the east of Ludong-Huanghai block and M≥5.0 earthquakes in the western Ludong-Huanghai block
图 10 鲁东—黄海地块以东太平洋西带MW≥7.0地震及鲁东—黄海地块西部M≥5.0地震震中分布Figure 10. Epicenter distribution of MW≥7.0 earthquakes in the western Pacific belt to the east of Ludong-Huanghai block and M≥5.0 earthquakes in the western Ludong-Huanghai block![]() 图 11 鲁东—黄海地块以东太平洋西带MW≥7.0地震及鲁东—黄海地块西部M≥5.0地震的时序曲线和蠕变曲线Figure 11. Time series and creep curves of MW≥7.0 earthquakes in the western Pacific belt to the east of Ludong-Huanghai block and M≥5.0 earthquakes in the western Ludong-Huanghai block
图 11 鲁东—黄海地块以东太平洋西带MW≥7.0地震及鲁东—黄海地块西部M≥5.0地震的时序曲线和蠕变曲线Figure 11. Time series and creep curves of MW≥7.0 earthquakes in the western Pacific belt to the east of Ludong-Huanghai block and M≥5.0 earthquakes in the western Ludong-Huanghai block采用国家地震局科技监测司(1990)推出的预报效能R值计算方法,检验太平洋板块西带MW≥7.0地震与鲁东—黄海地块西部M≥5.0地震的相关性。滞后时间以10天为间隔,计算相应的效能检验R值和R0值,部分结果列于表3。从表3可看出,太平洋板块西带MW≥7.0地震与鲁东—黄海地块西部M≥5.0地震有一定的统计关系,鲁东—黄海地块西部M≥5.0地震的发生一般滞后于太平洋板块西带M≥7.0地震,优势滞后时间约为670 d (R=0.22,R0=0.15)。换言之,太平洋板块西带MW≥7.0地震的发生,一定程度上有利于鲁东—黄海地块西部M≥5.0地震的发生。
表 3 鲁东—黄海地块以东太平洋西带MW≥7.0地震对鲁东—黄海地块西部中强地震影响的预报效能Table 3. Prediction effect of MW≥7.0 earthquakes in the western Pacific belt to the east of Ludong-Huanghai block on moderate strong earthquakes in the western Ludong-Huanghai block滞后时间/d 效能检验 滞后时间/d 效能检验 R R0 R R0 30 0.02 0.02 350 0.17 0.16 90 0.01 0.08 380 0.15 0.16 180 0.07 0.13 530 0.18 0.16 220 0.15 0.15 560 0.19 0.17 260 0.19 0.15 580 0.17 0.17 300 0.21 0.16 600 0.16 0.17 速度结构层析成像的结果显示,太平洋板块向西俯冲,俯冲深度达600 km左右,最远俯冲至俯冲带以西1 800 km处,俯冲带西边界在华北地区大致沿渤海西侧,经郯庐断裂带以西,沿秦岭大别的北边界向西至河南西部,再转向南,至湖南北部向南延伸,其上的地形、重力异常、地震和矿产等可能与深部构造及动力过程有关(Huang,Zhao,2006)。本文研究区就位于深部俯冲带的上部区域,鲁东—黄海地块西部M≥5.0地震与太平洋板块西带MW≥7.0地震的发生密切相关,可能反映了深部的俯冲构造和动力作用的影响。
太平洋板块的俯冲作用影响欧亚大陆的地震活动,除了考虑鲁东—黄海地块东侧的太平洋板块西带MW≥7.0地震的影响,还考虑了该区MW≥5.0中深源地震活动的增强。从鲁东—黄海地块东侧的太平洋板块西带MW≥5.0中深源地震年频次、MW≥7.0地震与鲁东—黄海地块西部MS≥5.0地震的结果(图12)来看,MW≥5.0中深源地震活动频次高、低分段明显,1974—1992年高于1993年至今。其中太平洋板块西带1974—1992年发生MW≥5.0中深源地震年频次均值为10.1,1倍方差为14.4,1993年以来MS≥5.0中深源地震年频次均值为5.9,1倍方差为8.3。
![]() 图 12 鲁东—黄海以东太平洋西带MW≥7.0地震M-t图和MW≥5.0中深源地震年频次及鲁东—黄海地块西部M≥5.0地震Figure 12. M-t map of MW≥7.0 earthquakes in the western Pacific zone to the east of Ludong-Huanghai block,annual frequency of MW≥5.0 intermediate and deep focus earthquakes and M≥5.0 earthquakes in the western Ludong-Huanghai block
图 12 鲁东—黄海以东太平洋西带MW≥7.0地震M-t图和MW≥5.0中深源地震年频次及鲁东—黄海地块西部M≥5.0地震Figure 12. M-t map of MW≥7.0 earthquakes in the western Pacific zone to the east of Ludong-Huanghai block,annual frequency of MW≥5.0 intermediate and deep focus earthquakes and M≥5.0 earthquakes in the western Ludong-Huanghai block鲁东—黄海西部除1996年南黄海MS6.1地震外,其它MS6.0以上地震均发生在MW≥5.0中深源地震频繁时段(1974—1992年)。整体来看,在太平洋西带MW≥5.0中深源地震高频前后有M≥7.0地震发生,有利于鲁东—黄海地块西部MS≥6.0地震的孕育发生。例外的是,1995年1月16日至1996年10月19日不到两年的时间,太平洋西带共发生4次MW≥7.0地震,最大为1995年1月16日MW7.4地震和1995年10月18日MW7.4地震,太平洋西带MW≥5.0中深源地震频次高值不显著,在这样的背景下发生了1996年11月9日南黄海MS6.1地震。
4. 讨论与结论
本文通过鲁东—黄海地块西部历史地震活动周期定性分析、定量计算、活跃—平静活动特征对比,探讨了鲁东—黄海地块周边大震对其影响分析,系统研究了鲁东—黄海地块西部地震活动特征及活动状态。
华北地区自1815年开始,进入第Ⅳ活跃期,鲁东—黄海地块西部作为华北块体的一部分,自1840年以来处于中强地震活跃期,总体趋势由强逐渐减弱,在衰减过程中叠加了“活跃—平静”周期活动特征。鲁东—黄海地块西部M≥5.0地震存在着两个显著的活动周期,分别为60.6—78.6 a (长周期)和5.4—7.0 a (短周期)。相对而言长周期特征更显著,表现为地震活跃—平静的周期特征,活跃时段的地震强度、能量释放和频次等呈现由强释放到弱释放的特点。短周期可能反映活跃时段内的强释放时的中强地震活动韵律,但由于样本少,未作详细讨论。鉴于活跃时段Ⅱ,Ⅲ在地震强弱释放、频次等方面较为相似,目前可能处于活跃时段Ⅲ的弱释放阶段。三个活跃时段的地震活动主体地区不同,活跃时段 Ⅰ ,Ⅱ以海域为主,海域地震活动强而陆域相对较弱,活跃时段Ⅲ陆域、海域同时活动,但三个活跃时段均未离开南黄海地区,仅是范围大小不同。
影响鲁东—黄海地块西部中强地震活动的因素有华北地块和太平洋西岸俯冲带的地震活动。鲁东—黄海地块西部作为华北地块的次级块体,其地震活动与华北地块强震活动有一定的呼应关系。鲁东—黄海地块西部M≥5.0地震与华北地块M≥6.0地震活跃—平静现象大致同步,1815年以来华北M6.0地震显著平静后,鲁东—黄海地块西部中强地震恰好处于较强活跃时段,华北地块首发M≥6.0地震可能位于鲁东—黄海地块西部,然后向华北中西部活动。太平洋板块西侧俯冲带MW≥5.0中深源地震活跃前后,该区发生了MW≥7.0地震,有利于鲁东—黄海地块西部MS≥6.0地震的孕育与发生;如果太平洋板块西侧俯冲带发生MW≥7.0地震,但该区MW≥5.0中深源地震未出现活跃,则鲁东—黄海地块西部一般会有MS≥5.0地震发生。本文研究区位于太平洋西岸俯冲区上方,太平洋西带MW≥7.0地震和中深源地震对研究区M≥5.0地震活动的影响可能反映太平洋板块深部俯冲构造的动力作用增强对鲁东—黄海地块西部地震活动的影响。
虽然本文研究了鲁东—黄海地块西部中强地震周期活动特征,但数据不足两百年,有待日后不断补充与校验。
中国地震台网中心国家地震科学数据中心(http://data.earthquake.cn)提供了数据支撑,审稿专家为本文提供了建设性的修改意见,本文图件采用GMT软件绘制,作者在此一并表示感谢。
-
![]()
图 1 双差定位中使用的台站、主要活动断层及研究区地震分布
Figure 1. Distribution of the stations used in double difference location,active faults and earthquakes in the studied area
![]()
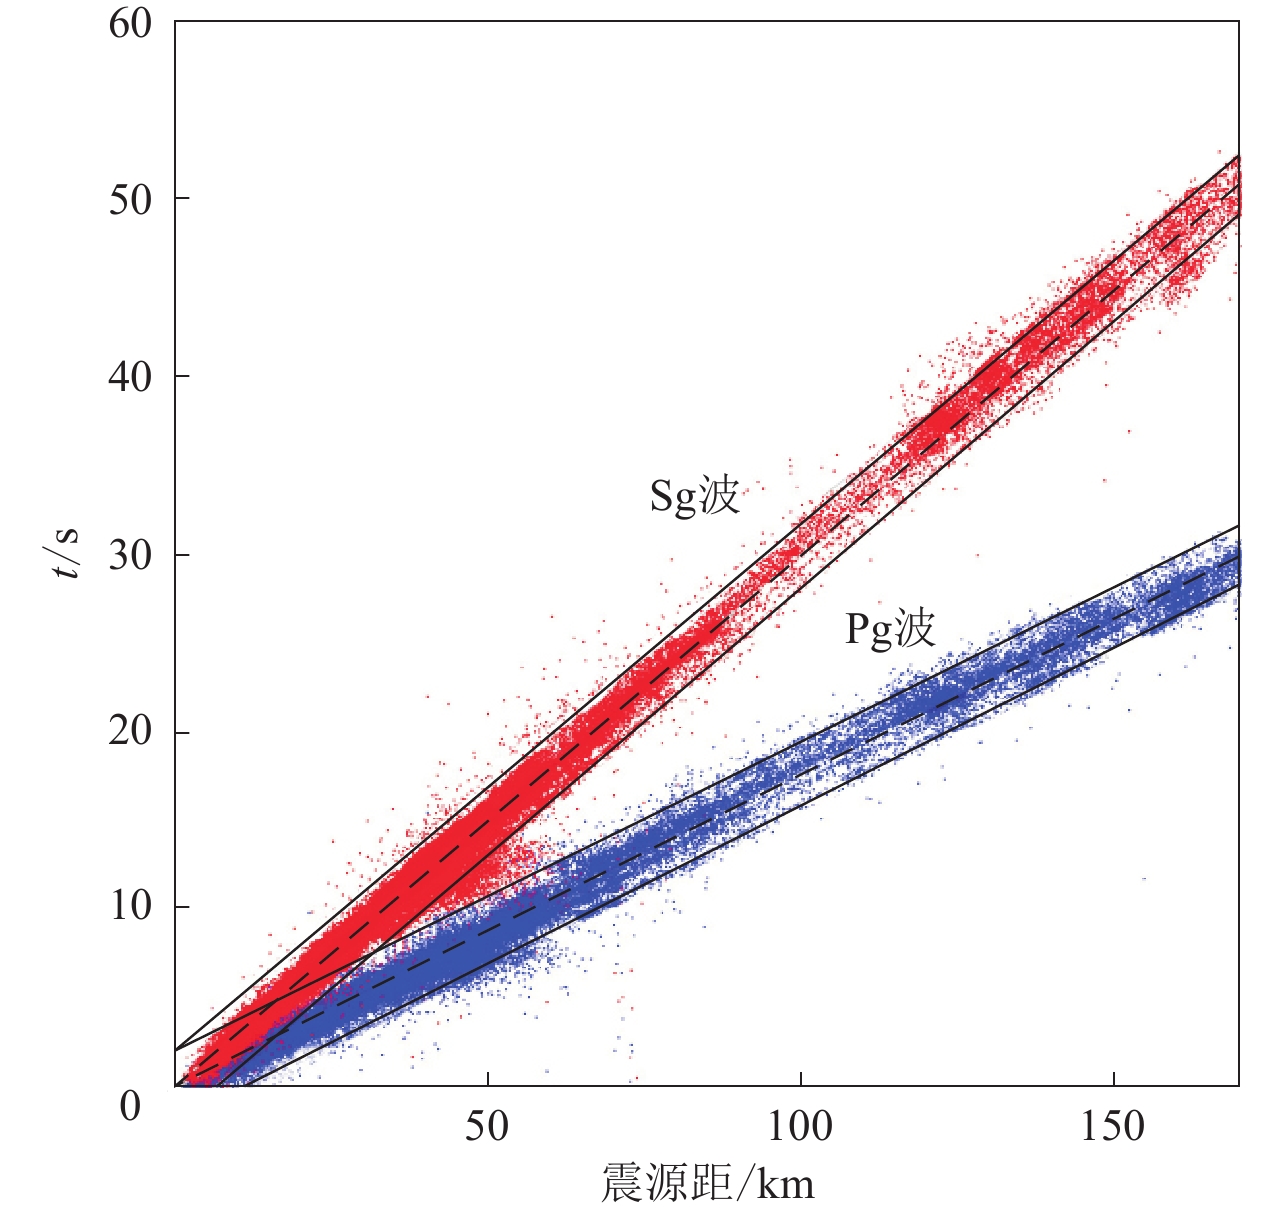
图 2 相对定位前震源距-到时曲线及震相数据筛选
Figure 2. Focal distance versus travel time curves before relative location and seismic phase data screening
![]()
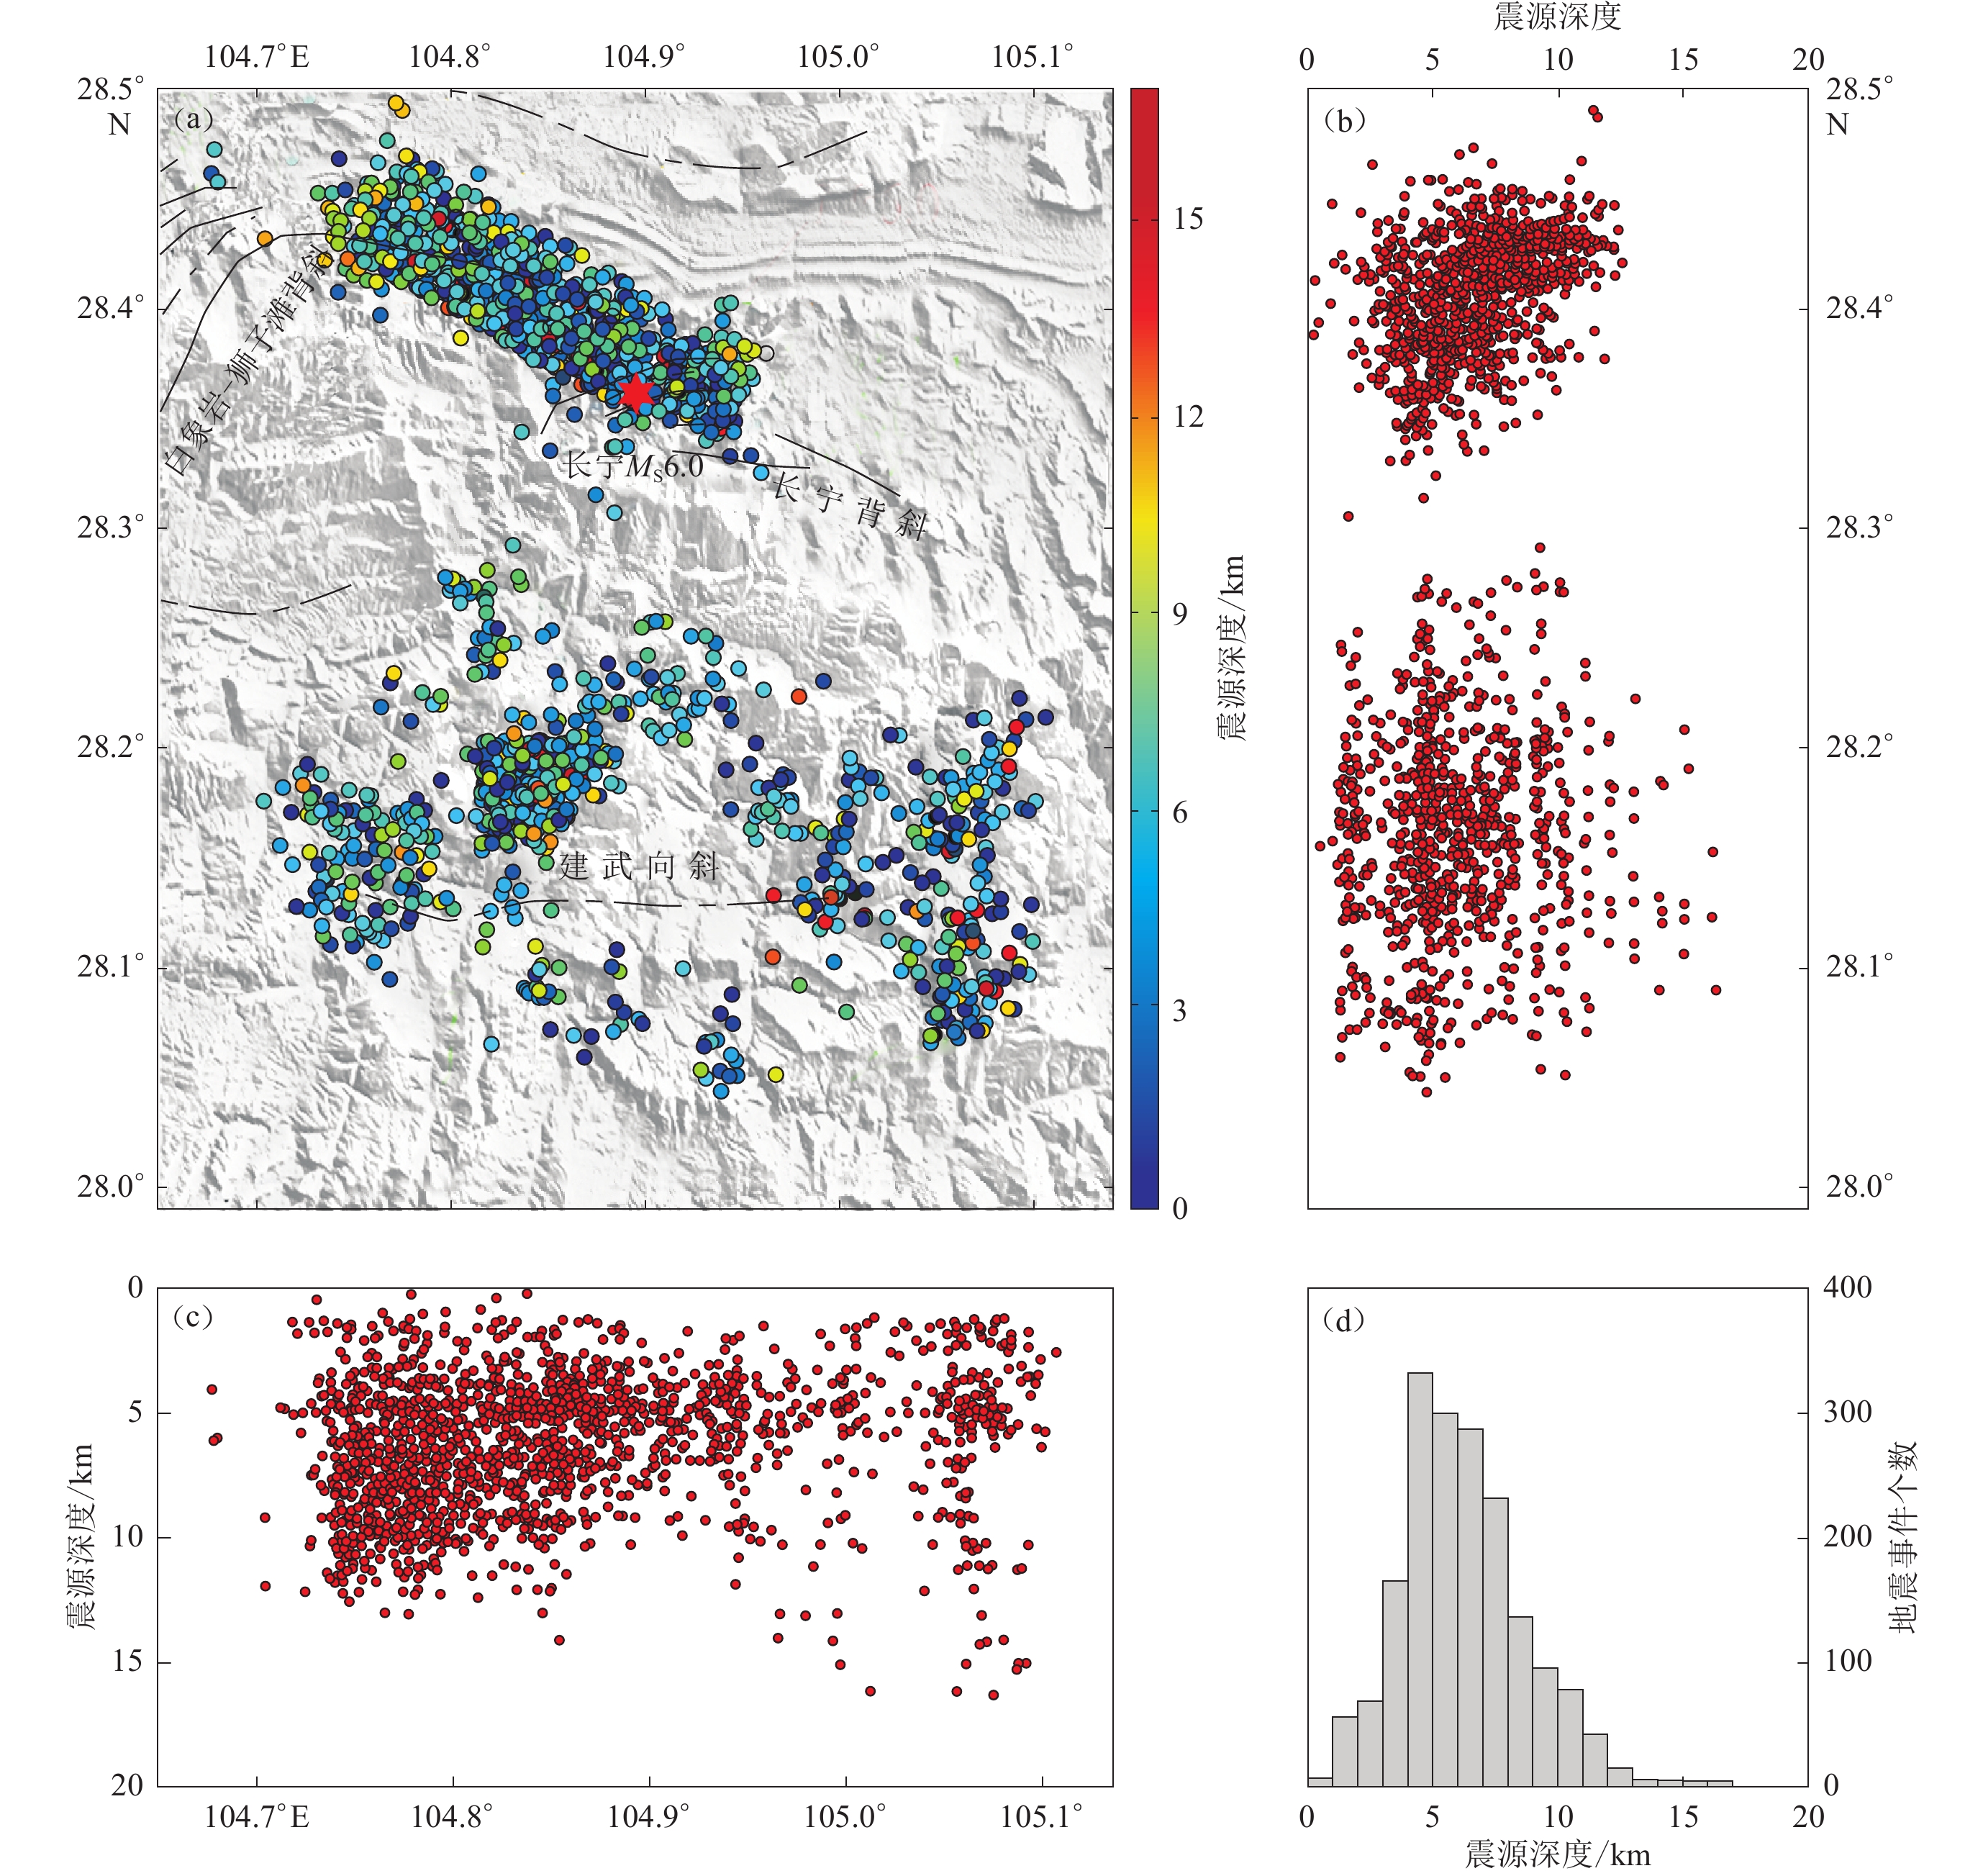
图 3 重定位后的震中分布
(a) 重定位震中分布;(b,c) 重定位后沿经度、纬度方向深度分布;(d) 重定位后深度分布统计
Figure 3. Distribution of relocated earthquake events
(a) Distribution of relocated epicenter;(b,c) Depth distribution along longitude and latitude,respectively;(d) Statistics of depth distribution after relocation
![]()
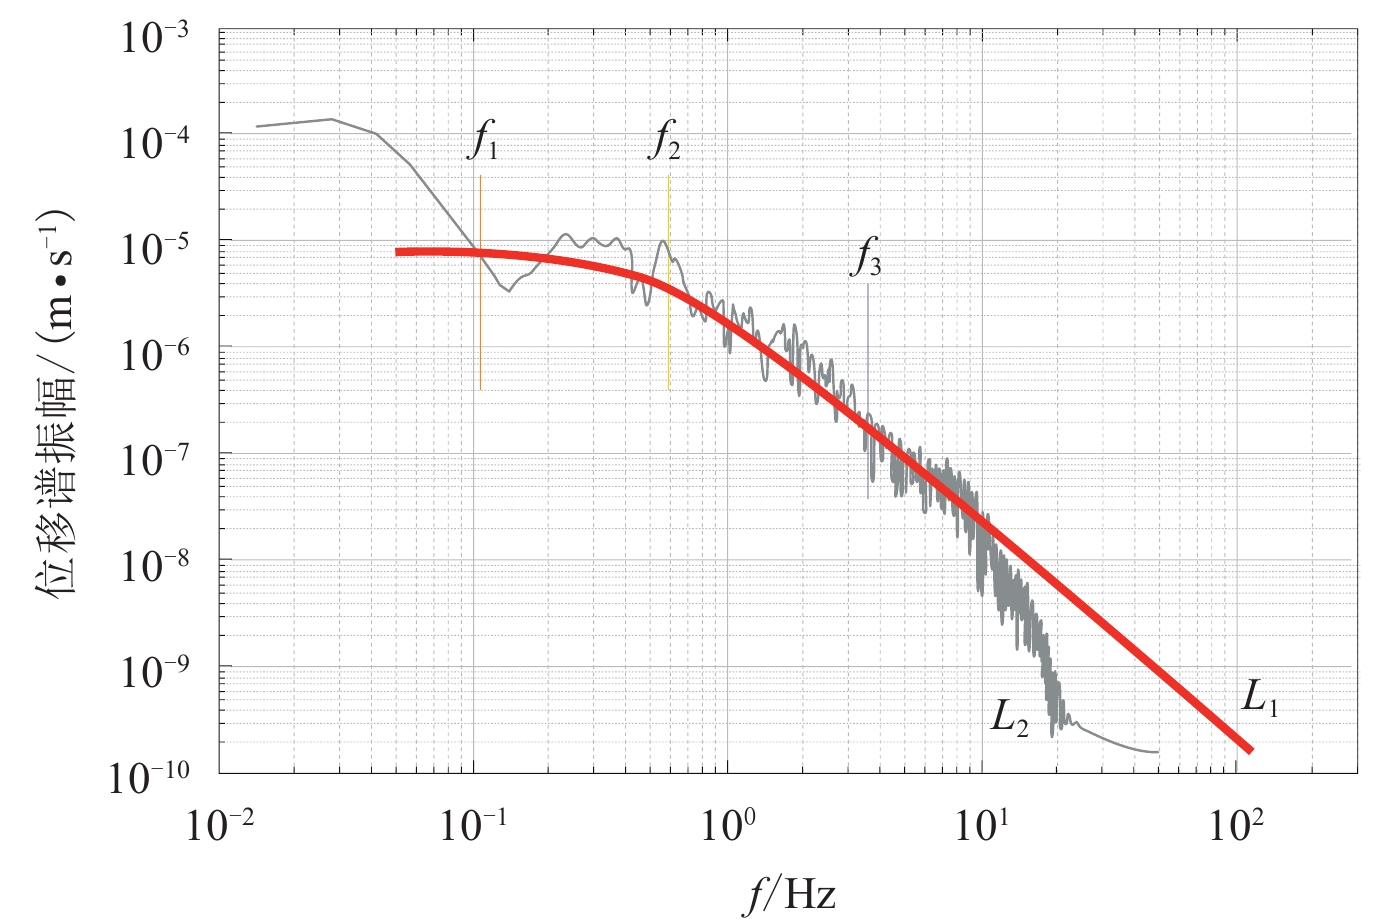
图 4 拐角频率拟合过程示例
L1表示将Ω0和fc代入式(4)得到的频谱曲线,L2为实际观测频谱曲线
Figure 4. The example of corner frequency fitting process
L1 represents the spectrum curve obtained by substituting Ω0 and fc into Equation (4),and L2 is the observation spectrum curve
![]()
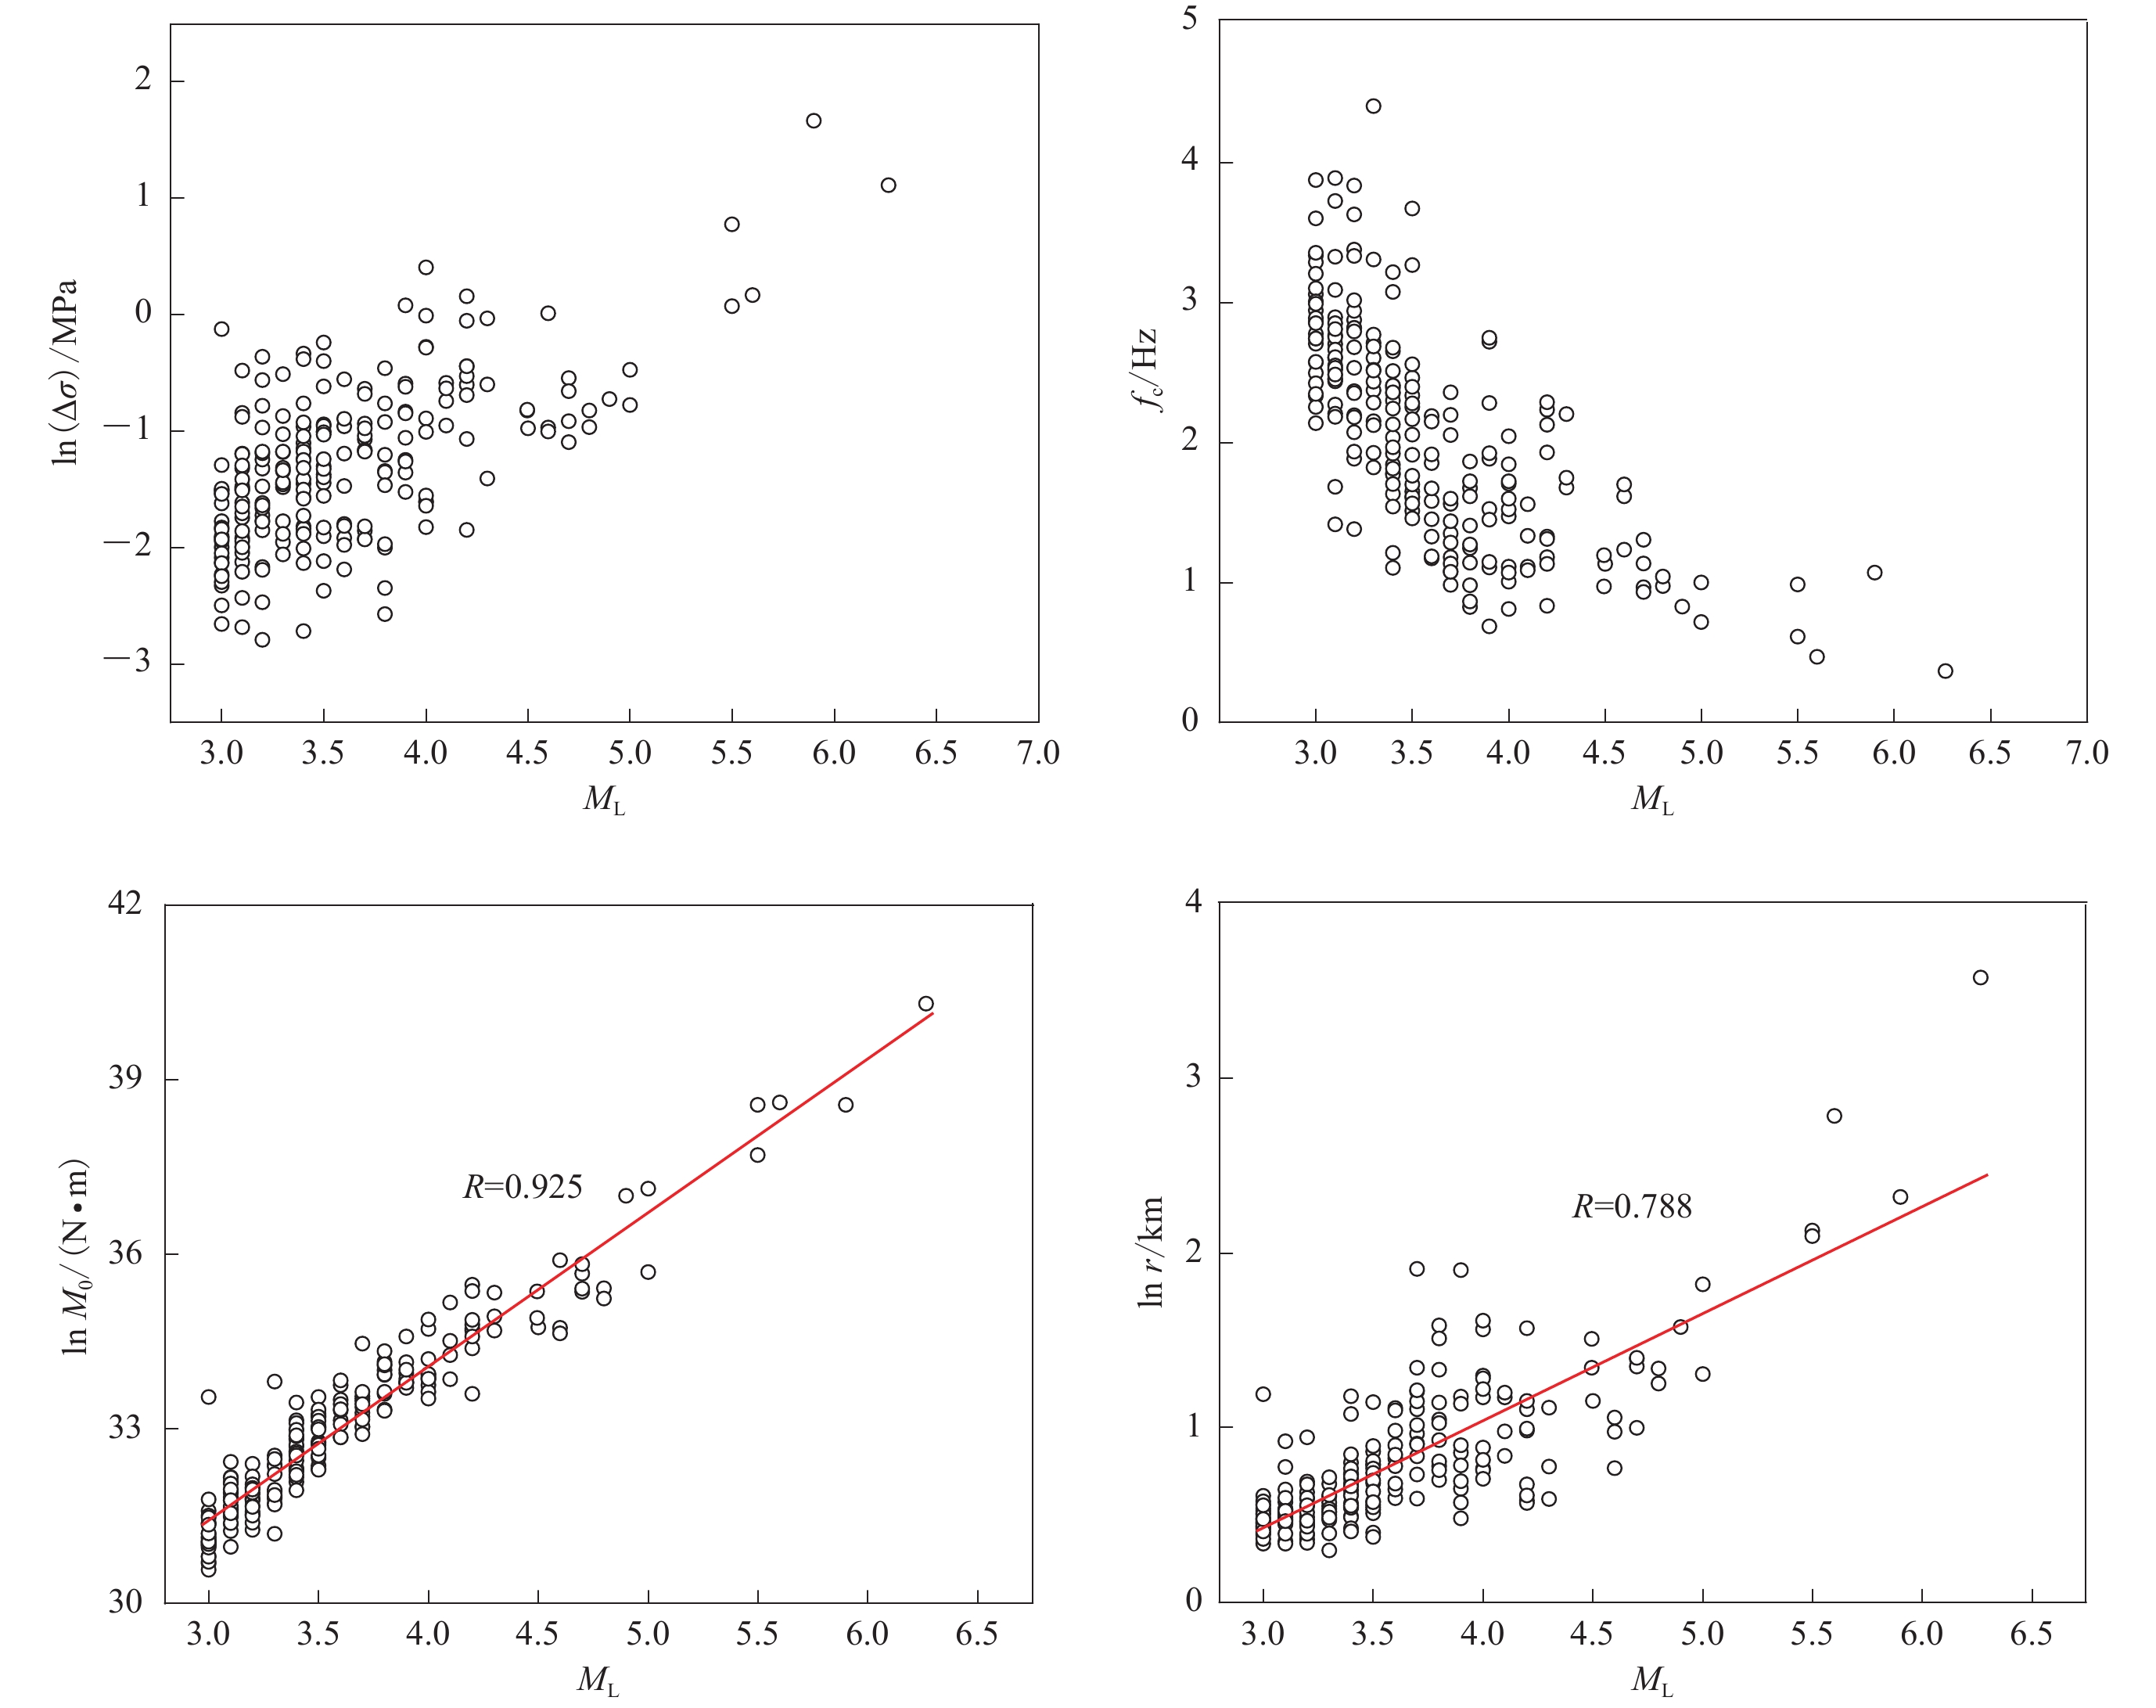
图 5 研究区震源参数与震级ML的关系
Δσ为应力降,fc为拐角频率,M0为地震矩,r为震源半径,ML为震级,R为相关系数,下同
Figure 5. The relationship between source parameters and magnitude ML in the studied area
Δσ is stress drop,fc is corner frequency,M0 is seismic moment,r is source radius,ML is magnitude,R is correlation coefficient,the same below
![]()
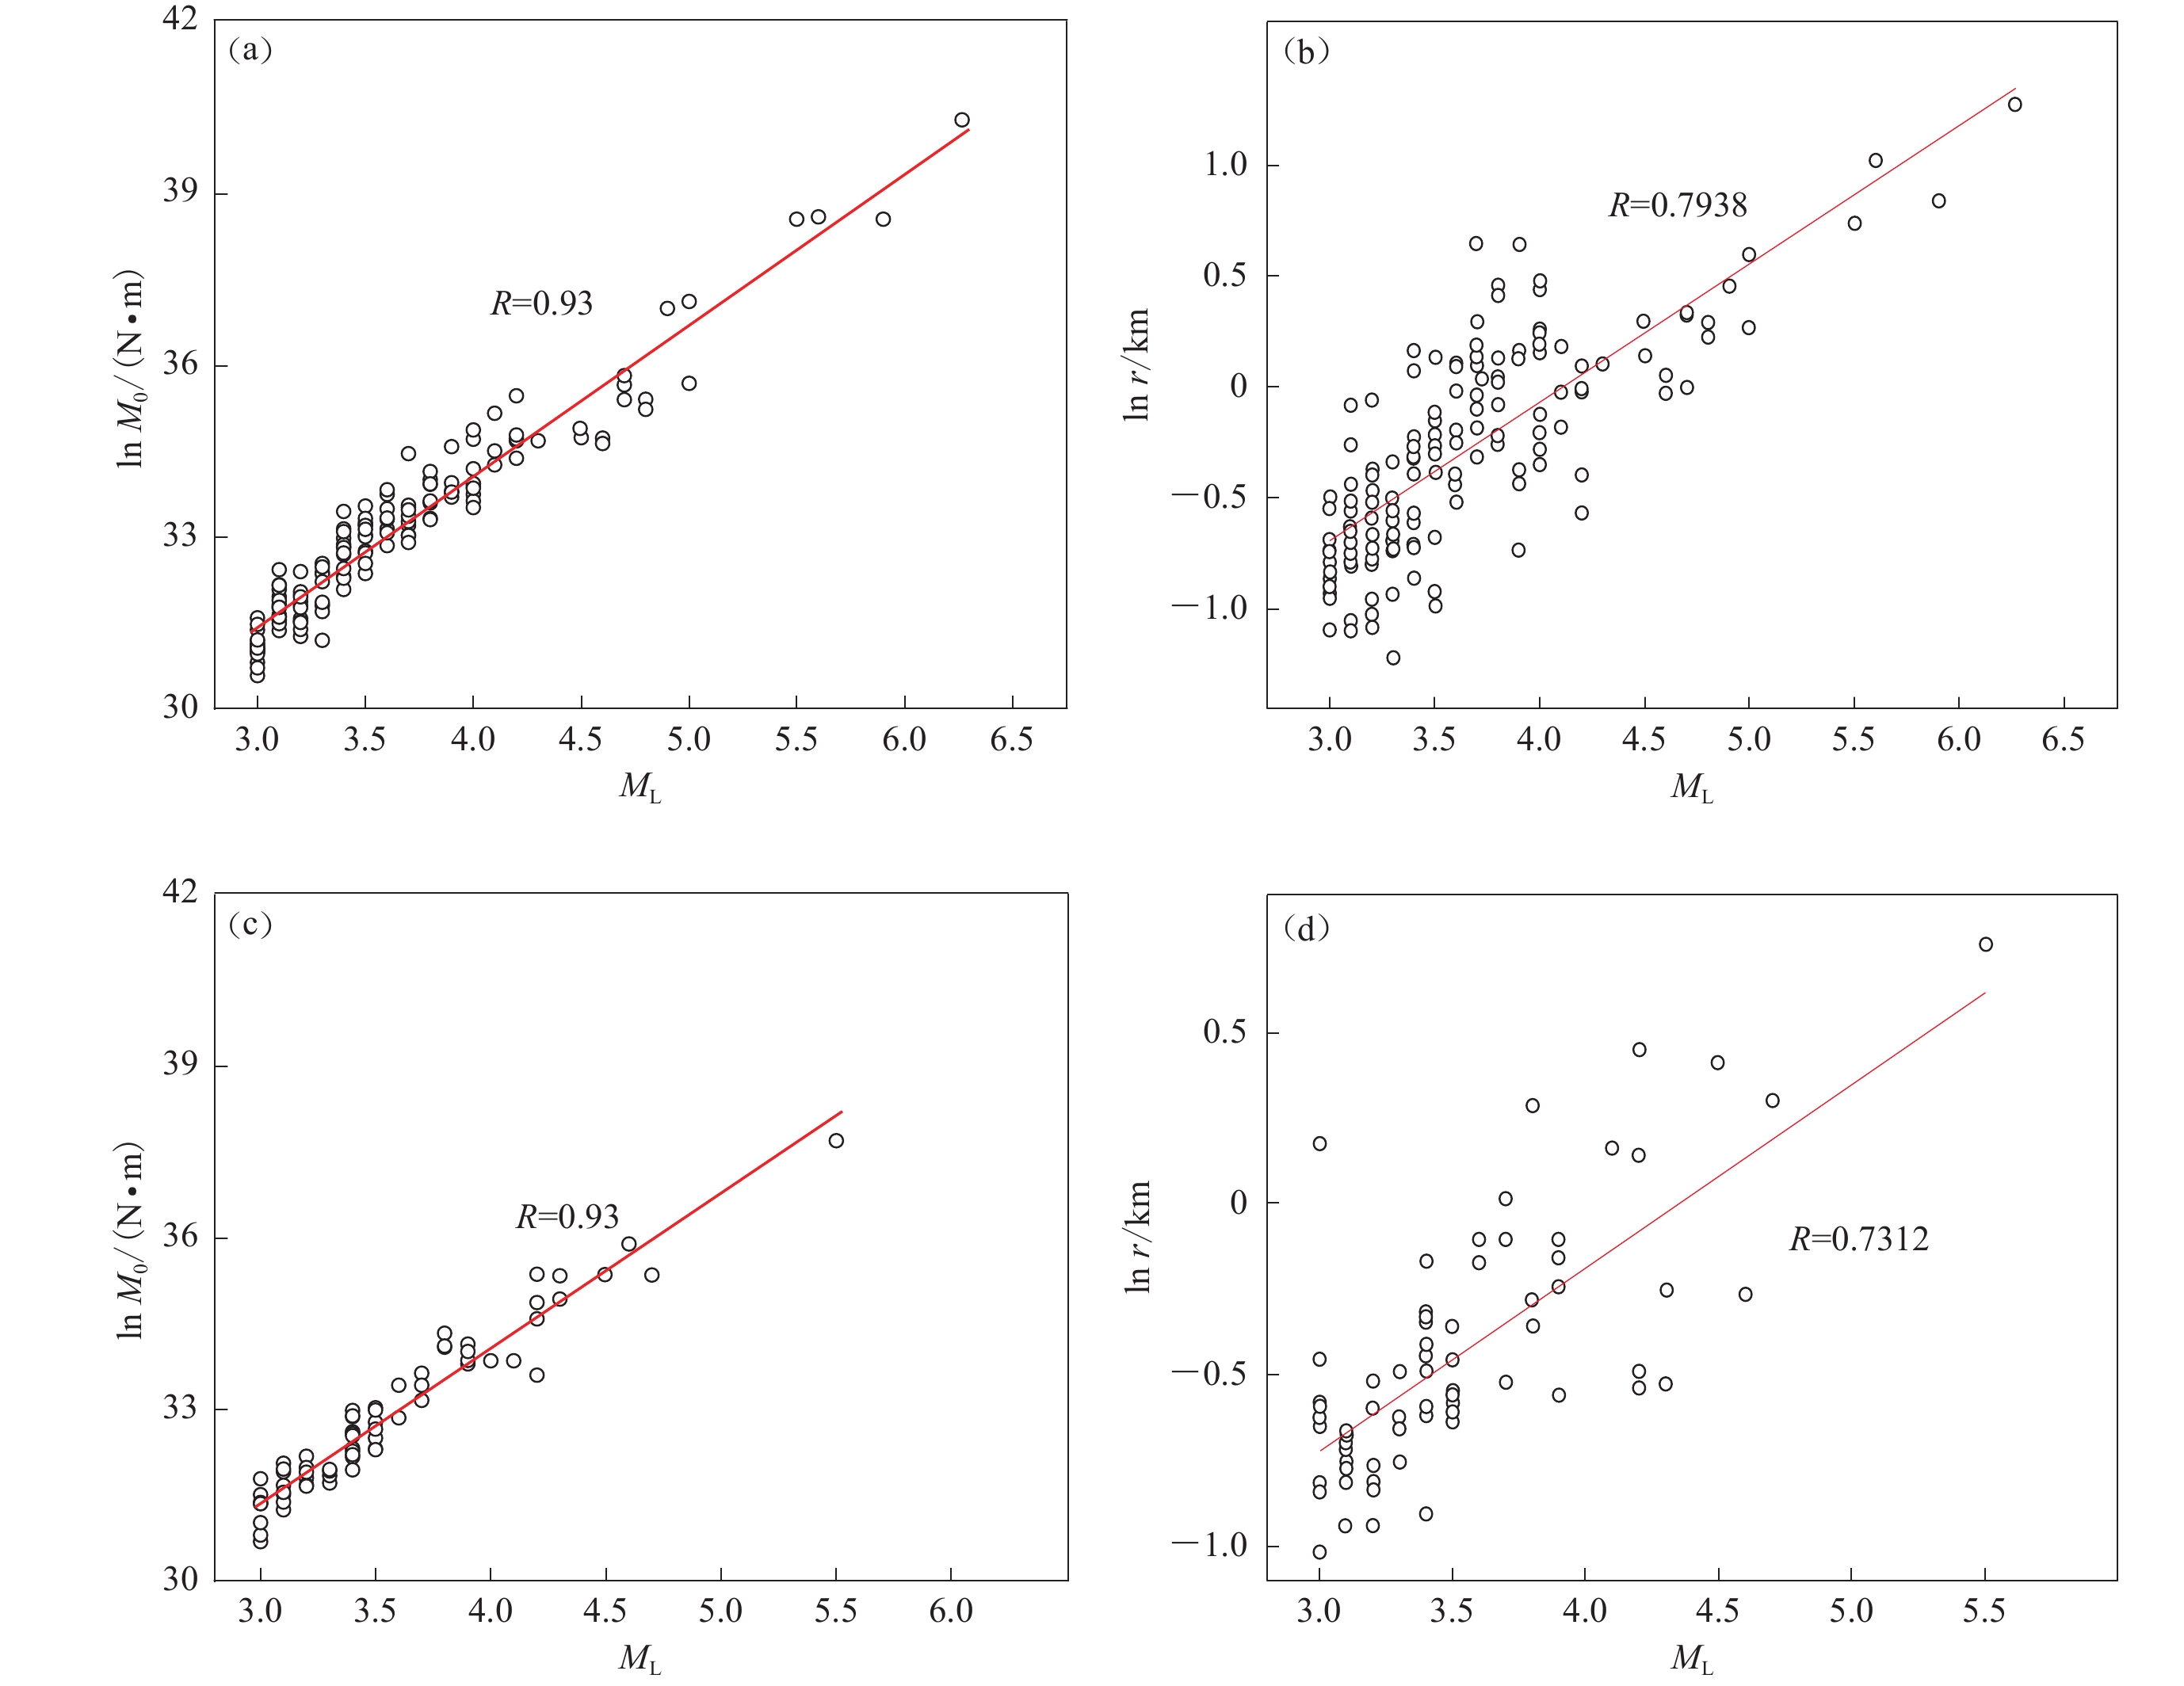
图 6 北区(a,b)、南区(c,d)震源参数地震矩M0、震源半径r与震级ML的关系
Figure 6. The relationship between seismic moment M0,source radius r and magnitude ML in the northern region (a,b) and southern region (c,d)
![]()
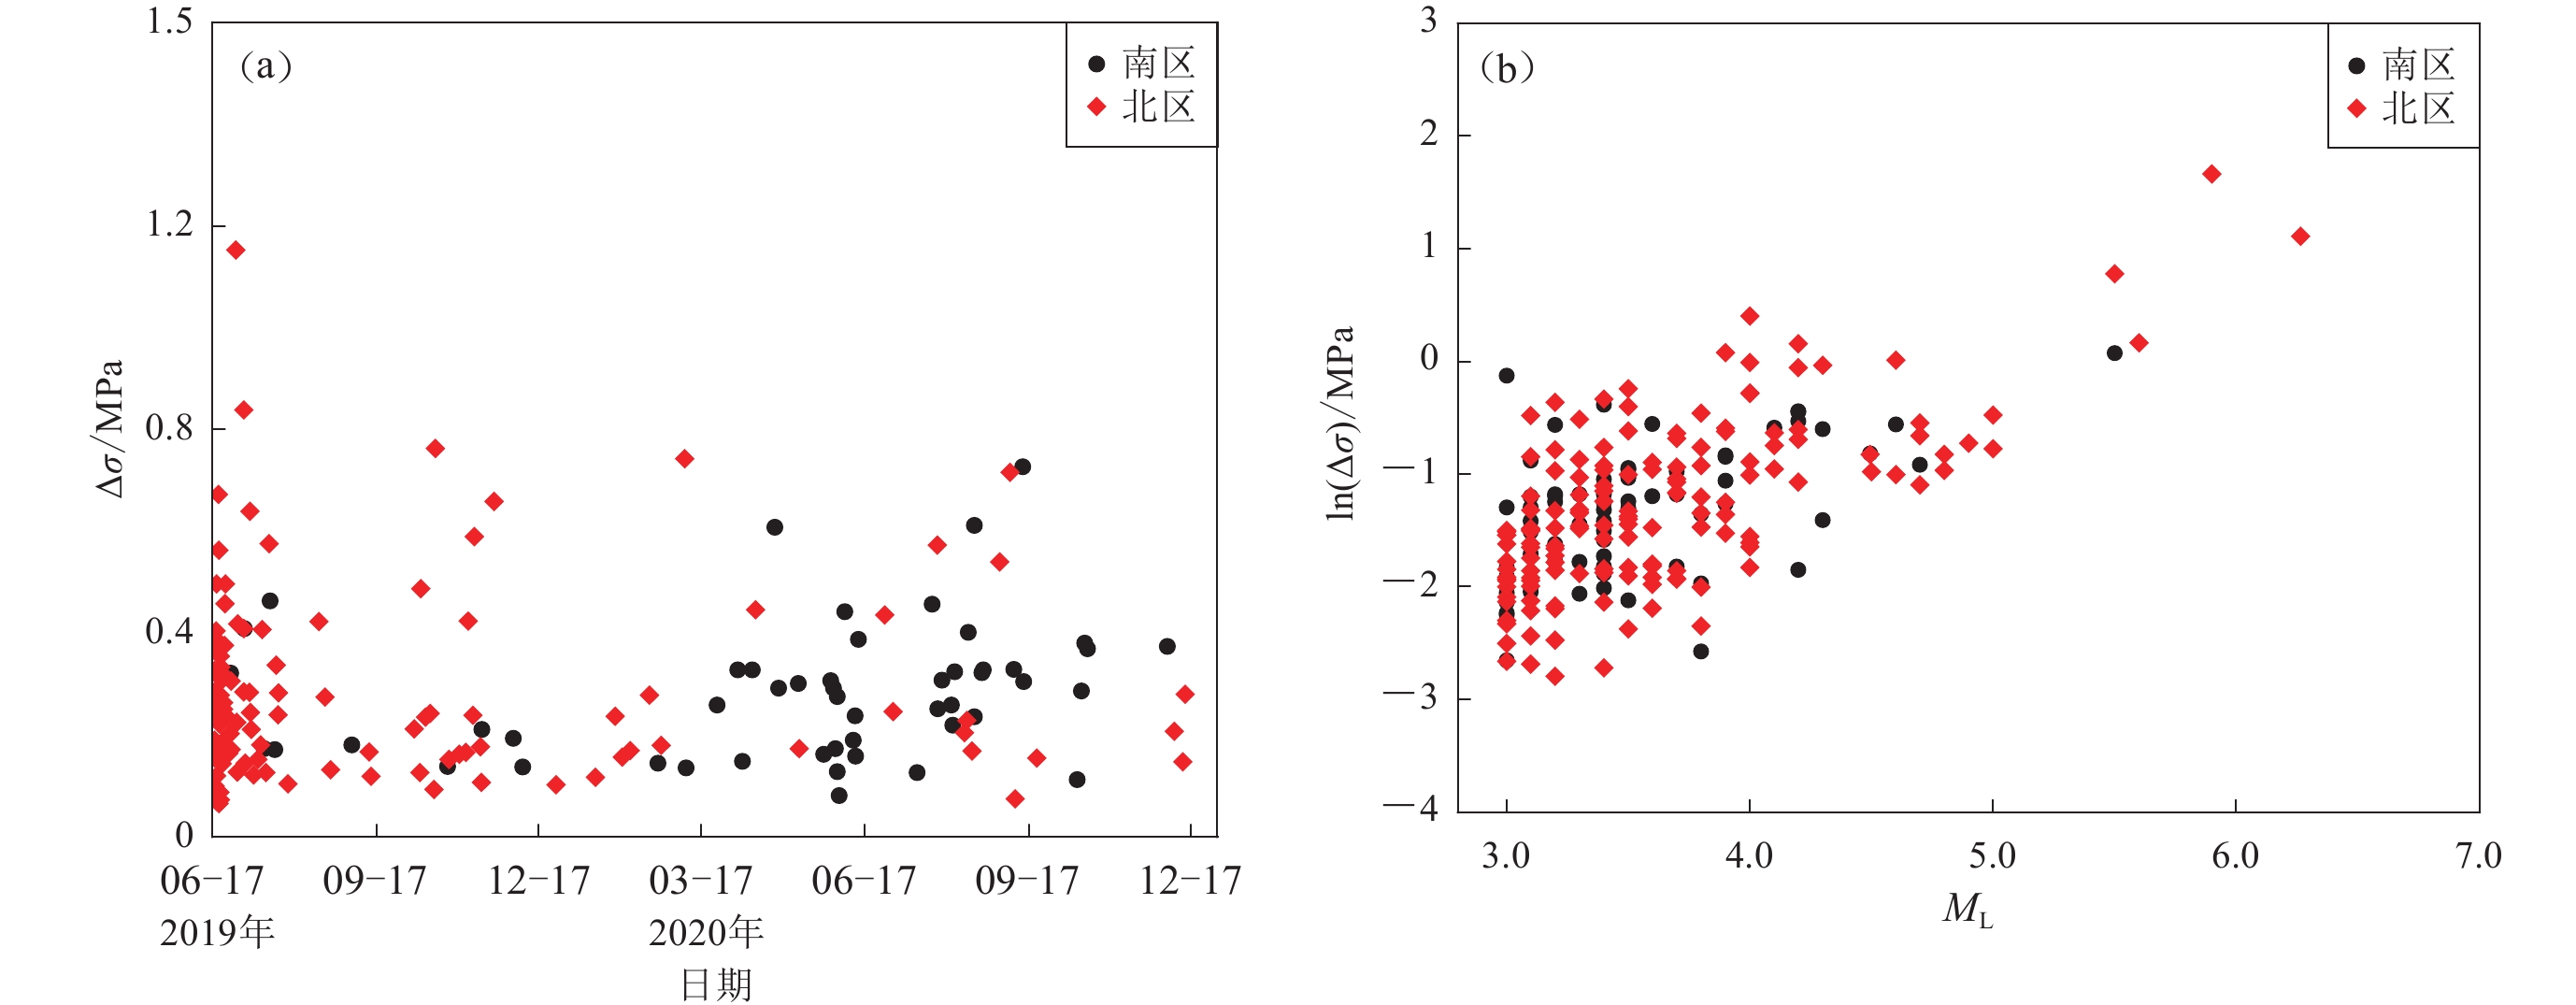
图 7 应力降∆σ随时间(a)和震级ML(b)的变化
Figure 7. Variation of the stress drop ∆σ with time (a) and magnitude ML (b)
![]()
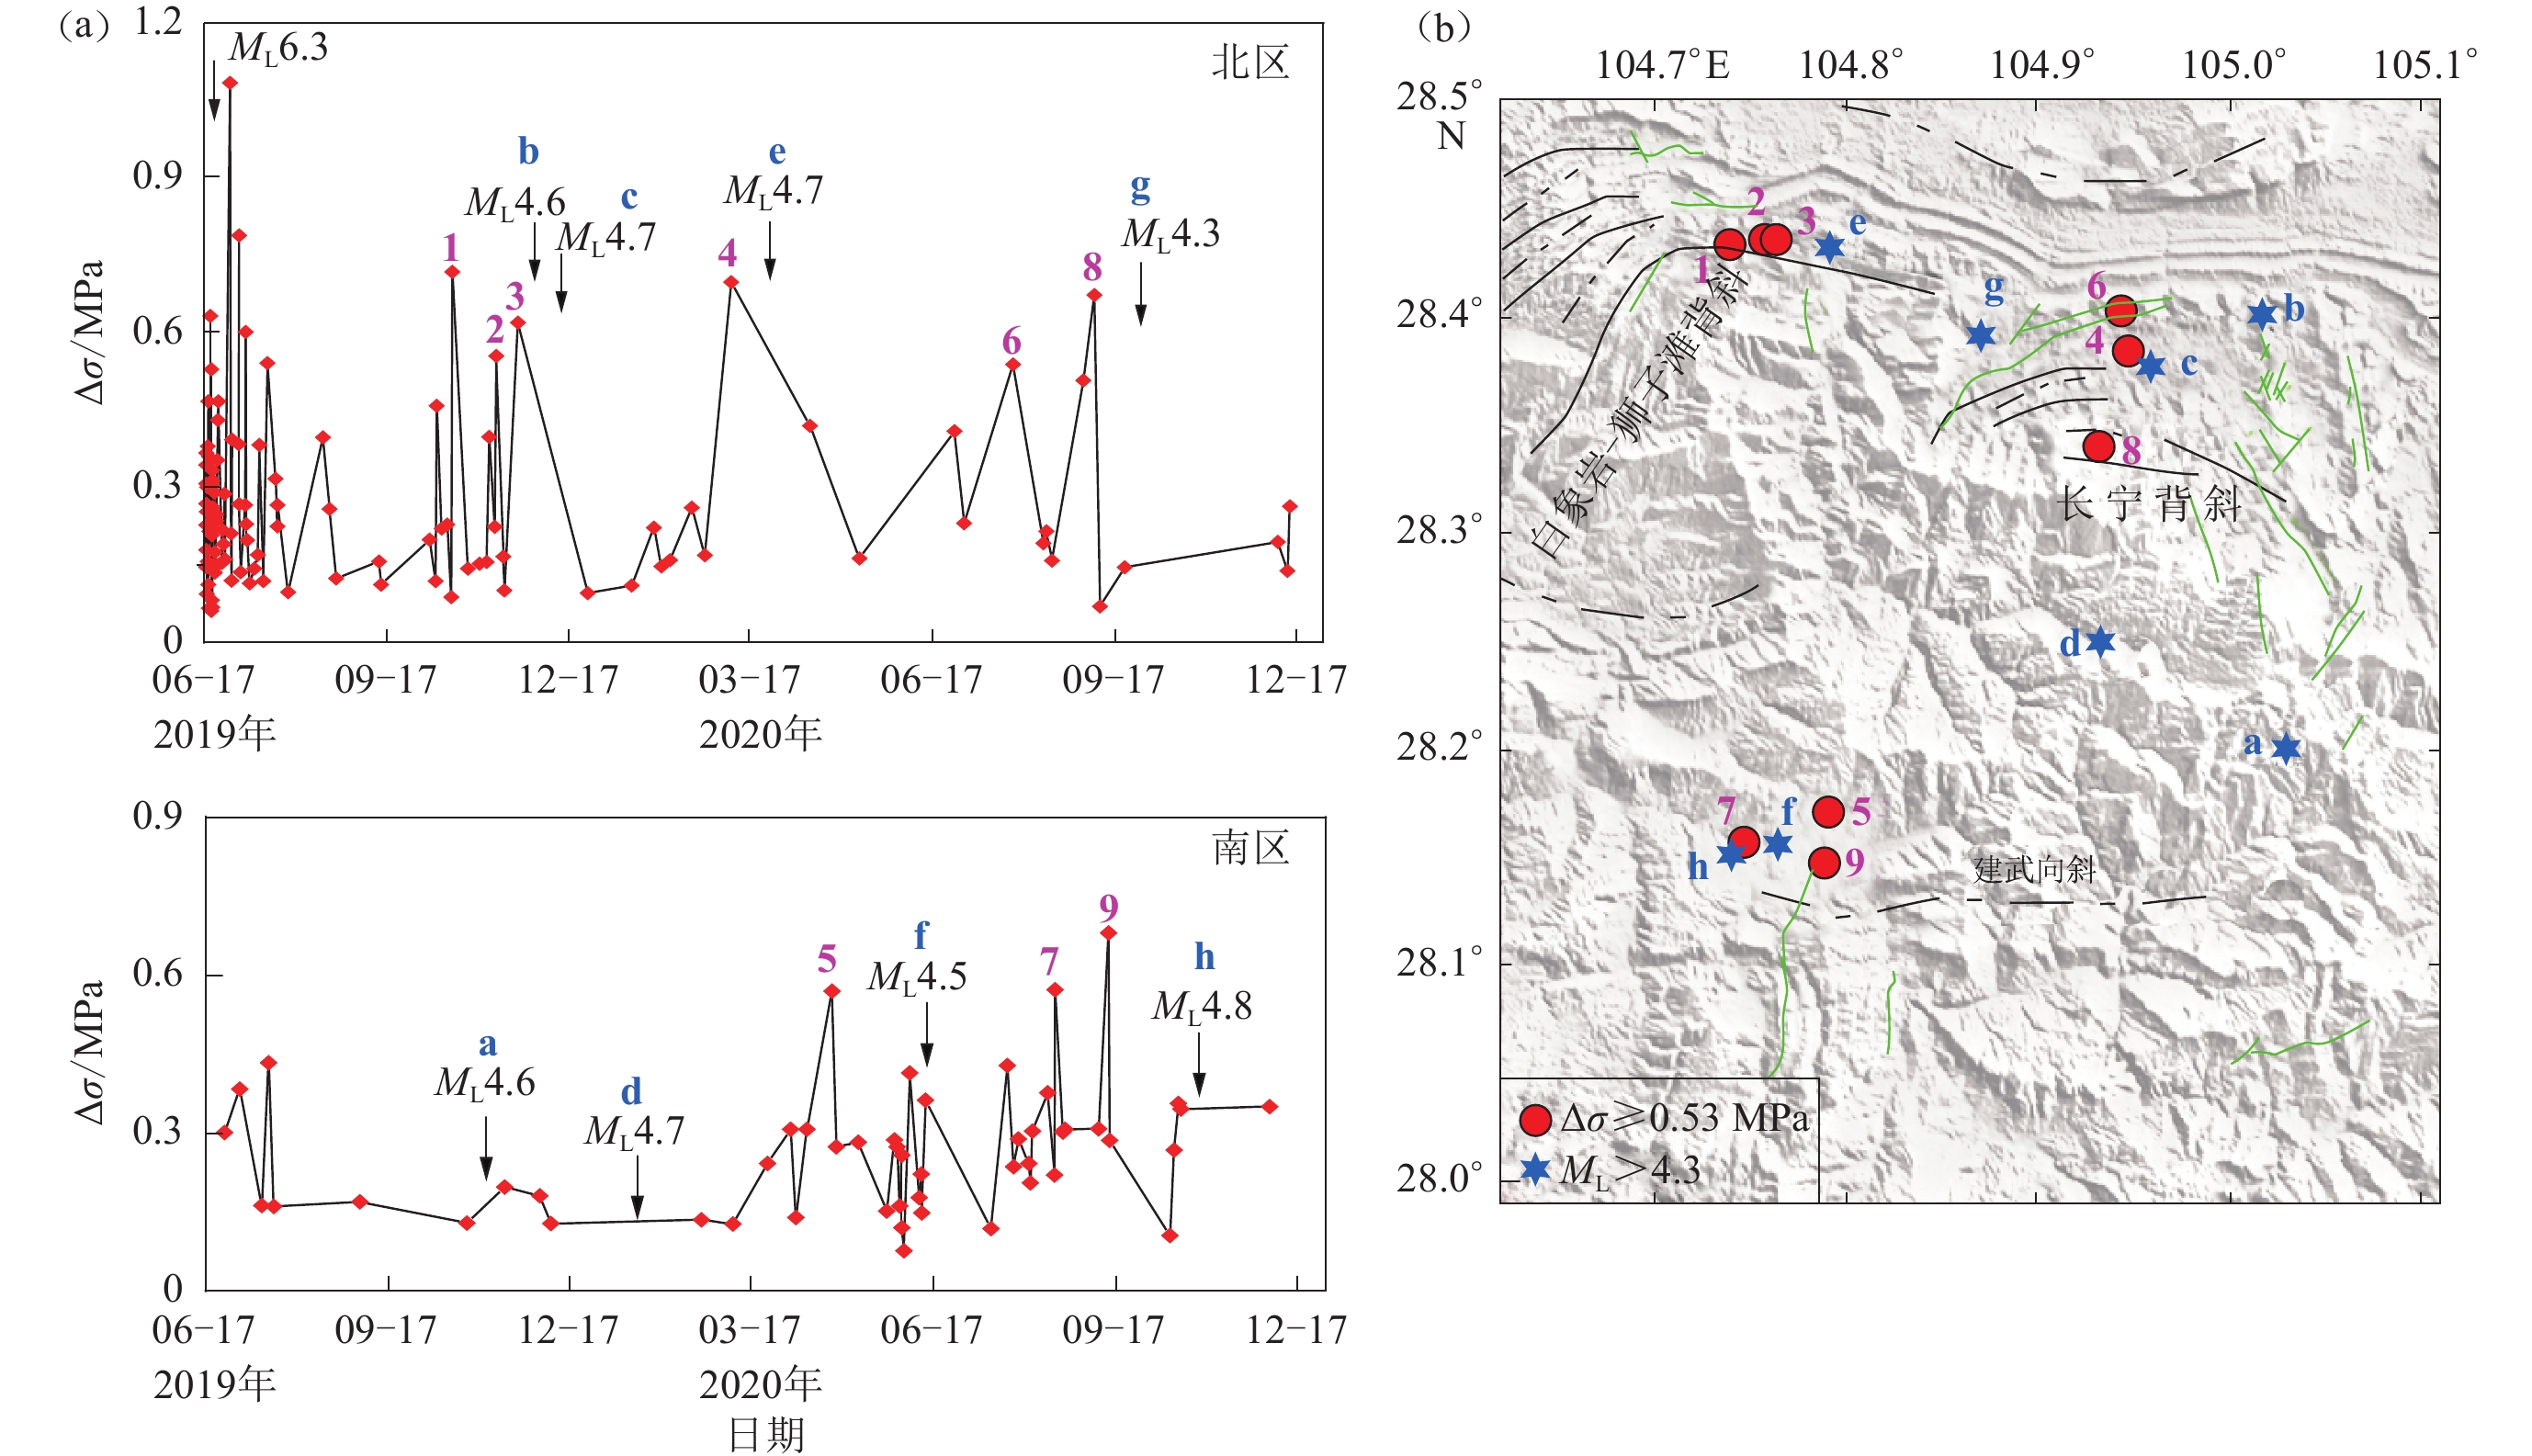
图 8 (a) 北区和南区ML3.0—3.9应力降随时间变化及强余震;(b) 2019年10月至2020年12月高应力降地震及其强余震的空间分布
Figure 8. (a) Stress drop changes of ML3.0—3.9 earthquakes and strong aftershocks with time in the northern region and the southern region;(b) Spatial distribution of high stress drop earthquakes and strong aftershocks from October 2019 to December 2020
![]()
图 9 ML3.0—3.9应力降网格均值分布(网格大小0.05°×0.05°)
黑点表示本文用于计算应力降均值的地震,圆圈表示2019年6月17日至2020年12月31日期间长宁地区ML4.0以上地震
Figure 9. Mean grid distribution of stress drop of ML3.0—3.9 (grid size 0.05°×0.05°) Black dots denote the earthquakes used for calculating mean stress drop,white circles denote the earthquakes above ML4.0 in Changning area from 17 June 2019 to 31 December 2020
-
程万正,陈学忠,乔慧珍. 2006. 四川地震辐射能量和视应力的研究[J]. 地球物理学进展,(3):692–699. doi: 10.3969/j.issn.1004-2903.2006.03.003 Cheng W Z,Chen X Z,Qiao H Z. 2006. Research on the radiated energy and apparent strain of the earthquakes in Sichuan Province[J]. Progress in Geophysics,(3):692–699 (in Chinese).
胡幸平,崔效锋,张广伟,王甘娇,Arno Zang,史丙新,姜大伟. 2021. 长宁地区复杂地震活动的力学成因分析[J]. 地球物理学报,64(1):1–17. doi: 10.6038/cjg2021O0232 Hu X P,Cui X F,Zhang G W,Wang G J,Arno Z,Shi B X,Jiang D W. 2021. Analysis on the mechanical causes of the complex seismicity in Changning area,China[J]. Chinese Journal of Geophysics,64(1):1–17 (in Chinese).
何登发,鲁人齐,黄涵宇,王晓山,姜华,张伟康. 2019. 长宁页岩气开发区地震的构造地质背景[J]. 石油勘探与开发,46(5):993–1006. He D F,Lu R Q,Huang H Y,Wang X S,Jiang H,Zhang W K. 2019. Tectonic and geological background of the earthquake hazards in Changning shale gas development zone,Sichuan Basin,SW China[J]. Petroleum Exploration and Development,46(5):993–1006 (in Chinese).
华卫,陈章立,郑斯华,晏纯清. 2010. 三峡水库地区震源参数特征研究[J]. 地震地质,32(4):533–542. doi: 10.3969/j.issn.0253-4967.2010.04.001 Hua W,Chen Z L,Zheng S H,Yan C Q. 2010. A study on characteristics of source parameters in Three Gorges Reservoir area[J]. Seismology and Geology,32(4):533–542 (in Chinese).
华卫,陈章立,郑斯华,晏纯清. 2012. 水库诱发地震与构造地震震源参数特征差异性研究:以龙滩水库为例[J]. 地球物理学进展,27(3):924–935. Hua W,Chen Z L,Zheng S H,Yan C Q. 2012. Differences existing in characteristics of source parameters between reservoir induced seismicity and tectonic earthquake:A case study of Longtan reservoir[J]. Progress in Geophysics,27(3):924–935 (in Chinese).
李艳娥,陈学忠,付虹. 2012. 2007年云南泞洱MS6.4地震前滇西南地区震源动力学参数时空变化特征[J]. 地震,32(1):28–39. doi: 10.3969/j.issn.1000-3274.2012.01.003 Li Yan’e,Chen X Z,Fu H. 2012. Temporal and spatial variation of focal dynamic parameters in Southwest Yunnan before the 2007 MS6.4 Ning’er earthquake[J]. Earthquake,32(1):28–39 (in Chinese).
阮祥,程万正,张永久,李军,陈银. 2008. 四川长宁盐矿井注水诱发地震研究[J]. 中国地震,24(3):226–234. Ruan X,Cheng W Z,Zhang Y J,Li J,Chen Y. 2008. Research of the earthquakes induced by water injections in salt mines in Changning,Sichuan[J]. Earthquake Research in China,24(3):226–234 (in Chinese).
解孟雨,孟令媛. 2021. 川东南长宁地区地震活动及b值演化特征[J]. 中国地震,37(2):494–507. doi: 10.3969/j.issn.1001-4683.2021.02.021 Xie M Y,Meng L Y. 2021. Seismicity and evolution characteristics of b-values of Changning area in southeastern region of Sichuan basin[J]. Earthquake Research in China,37(2):494–507 (in Chinese).
易桂喜,龙锋,梁明剑,赵敏,王思维,宫悦,乔慧珍,苏金蓉. 2019. 2019年6月17日四川长宁MS6.0地震序列震源机制解与发震构造分析[J]. 地球物理学报,62(9):3432–3447. Yi G X,Long F,Liang M J,Zhao M,Wang S W,Gong Y,Qiao H Z,Su J R. 2019. Focal mechanism solutions and seismogenic structure of the 17 June 2019 MS6.0 Sichuan Changning earthquake sequence[J]. Chinese Journal of Geophysics,62(9):3432–3447 (in Chinese).
张致伟,乔慧珍,吴朋,宫悦,赵小艳. 2015. 注水诱发地震的谱振幅相关系数及视应力研究[J]. 地震研究,38(1):42–50. Zhang Z W,Qiao H Z,Wu P,Gong Y,Zhao X Y. 2015. Study on correlation coefficient of spectral amplitude and apparent stress of water injection induced earthquake[J]. Journal of Seismological Research,38(1):42–50 (in Chinese).
赵翠萍,陈章立,华卫,王勤彩,李志雄,郑斯华. 2011. 中国大陆主要地震活动区中小地震震源参数研究[J]. 地球物理学报,54(6):1478–1489. doi: 10.3969/j.issn.0001-5733.2011.06.007 Zhao C P,Chen Z L,Hua W,Wang Q C,Li Z X,Zheng S H. 2011. Study on source parameters of small to moderate earthquakes in the main seismic active regions,China Mainland[J]. Chinese Journal of Geophysics,54(6):1478–1489 (in Chinese).
周少辉,蒋海昆,曲均浩,李健. 2018. 应力降研究进展综述[J]. 中国地震,34(4):591–605. doi: 10.3969/j.issn.1001-4683.2018.04.001 Zhou S H,Jiang H K,Qu J H,Li J. 2018. A review on research of foreshocks[J]. Earthquake Research in China,34(4):591–605 (in Chinese).
朱利锋,翁剑桥,吕文雅. 2016. 四川长宁地区页岩储层天然裂缝发育特征及研究意义[J]. 地质调查与研究,39(2):104–110. Zhu L F,Weng J Q,Lü W Y. 2016. The significance and characteristics of natural fractures of the shale in Changning area,Sichuan Province[J]. Geological Survey and Research,39(2):104–110 (in Chinese).
左可桢,赵翠萍. 2021. 四川长宁地区地震震源参数的时空分布特征[J]. 中国地震,37(2):472–482. doi: 10.3969/j.issn.1001-4683.2021.02.019 Zuo K Z,Zhao C P. 2021. The spatial and temporal distribution of source parameters of earthquakes in Changning area,Sichuan Province[J]. Earthquake Research in China,37(2):472–482 (in Chinese).
Aki K, Richards P G. 1980. Quantitative Seismology: Theory and Methods (Volume Ⅱ)[M]. San Francisco, California: W. H. Freeman: 105–107.
Allmann B P,Shearer P M. 2009. Global variations of stress drop for moderate to large earthquakes[J]. J Geophys Res:Solid Earth,114(B1):B01310.
Archuleta R J,Cranswick E,Mueller C,Spudich P. 1982. Source parameters of the 1980 Mammoth Lakes,California,earthquake sequence[J]. J Geophys Res:Solid Earth,87(B6):4595–4607. doi: 10.1029/JB087iB06p04595
Clerc F,Harrington R M,Liu Y J,Gu Y J. 2016. Stress drop estimates and hypocenter relocations of induced seismicity near Crooked Lake,Alberta[J]. Geophys Res Lett,43(13):6942–6951. doi: 10.1002/2016GL069800
Hough S E. 2015. Shaking intensity from injection-induced versus tectonic earthquakes in the Central-Eastern United States[J]. Leading Edge,34(6):690–697. doi: 10.1190/tle34060690.1
Houston H. 2001. Influence of depth,focal mechanism,and tectonic setting on the shape and duration of earthquake source time functions[J]. J Geophys Res:Solid Earth,106(B6):11137–11150. doi: 10.1029/2000JB900468
Huang Y H,Ellsworth W L,Beroza G C. 2017. Stress drops of induced and tectonic earthquakes in the Central United States are indistinguishable[J]. Sci Adv,3(8):e1700772. doi: 10.1126/sciadv.1700772
Lei X L,Huang D J,Su J R,Jiang G M,Wang X L,Wang H,Guo X,Fu H. 2017. Fault reactivation and earthquakes with magnitudes of up to MW4.7 induced by shale-gas hydraulic fracturing in Sichuan Basin,China[J]. Sci Rep,7(1):7971. doi: 10.1038/s41598-017-08557-y
Lei X L,Wang Z W,Su J R. 2019a. The December 2018 ML5.7 and January 2019 ML5.3 earthquakes in South Sichuan Basin induced by shale gas hydraulic fracturing[J]. Seismol Res Lett,90(3):1099–1110. doi: 10.1785/0220190029
Lei X L,Wang Z W,Su J R. 2019b. Possible link between long-term and short-term water injections and earthquakes in salt mine and shale gas site in Changning,South Sichuan Basin,China[J]. Earth Planet Phys,3(6):510–525. doi: 10.26464/epp2019052
Lei X L,Su J R,Wang Z W. 2020. Growing seismicity in the Sichuan Basin and its association with industrial activities[J]. Science China Earth Sciences,63(11):1633–1660.
Meng L Y,McGarr A,Zhou L Q,Zang Y. 2019. An investigation of seismicity induced by hydraulic fracturing in the Sichuan Basin of China based on data from a temporary seismic network[J]. Bull Seismol Soc Am,109(1):348–357. doi: 10.1785/0120180310
Tan Y Y,Hu J,Zhang H J,Chen Y K,Qian J W,Wang Q F,Zha H,Tang P,Nie Z. 2020. Hydraulic fracturing induced seismicity in the southern Sichuan Basin due to fluid diffusion inferred from seismic and injection data analysis[J]. Geophys Res Lett,47(4):e2019GL084885.
Tomic J,Abercrombie R E,Do Nascimento A F. 2009. Source parameters and rupture velocity of small M≤2.1 reservoir induced earthquakes[J]. Geophys J Int,179(2):1013–1023. doi: 10.1111/j.1365-246X.2009.04233.x
Uchide T,Shearer P M,Imanishi K. 2014. Stress drop variations among small earthquakes before the 2011 Tohoku-Oki,Japan,earthquake and implications for the main shock[J]. J Geophys Res:Solid Earth,119(9):7164–7174. doi: 10.1002/2014JB010943
Waldhauser F,Ellsworth W L. 2000. A double-difference earthquake location algorithm:Method and application to the northern Hayward fault,California[J]. Bull Seismol Soc Am,90(6):1353–1368. doi: 10.1785/0120000006
Wu Y Q,Jiang Z S,Zhao J,Liu X X,Wei W X,Liu Q,Li Q,Zou Z Y,Zhang L. 2015. Crustal deformation before the 2008 Wenchuan MS8.0 earthquake studied using GPS data[J]. J Geodyn,85:11–23. doi: 10.1016/j.jog.2014.12.002
Wyss M. 1970. Apparent stresses of earthquakes on ridges compared to apparent stresses of earthquakes in trenches[J]. Geophys J Int,19(5):479–484. doi: 10.1111/j.1365-246X.1970.tb00153.x

 下载:
下载:


计量
- 文章访问数: 394
- HTML全文浏览量: 168
- PDF下载量: 136
