

Differences of geomagnetic anomalous field over Chinese mainland and its adjacent areas during 1960−2000 based on Taylor polynomial model
-
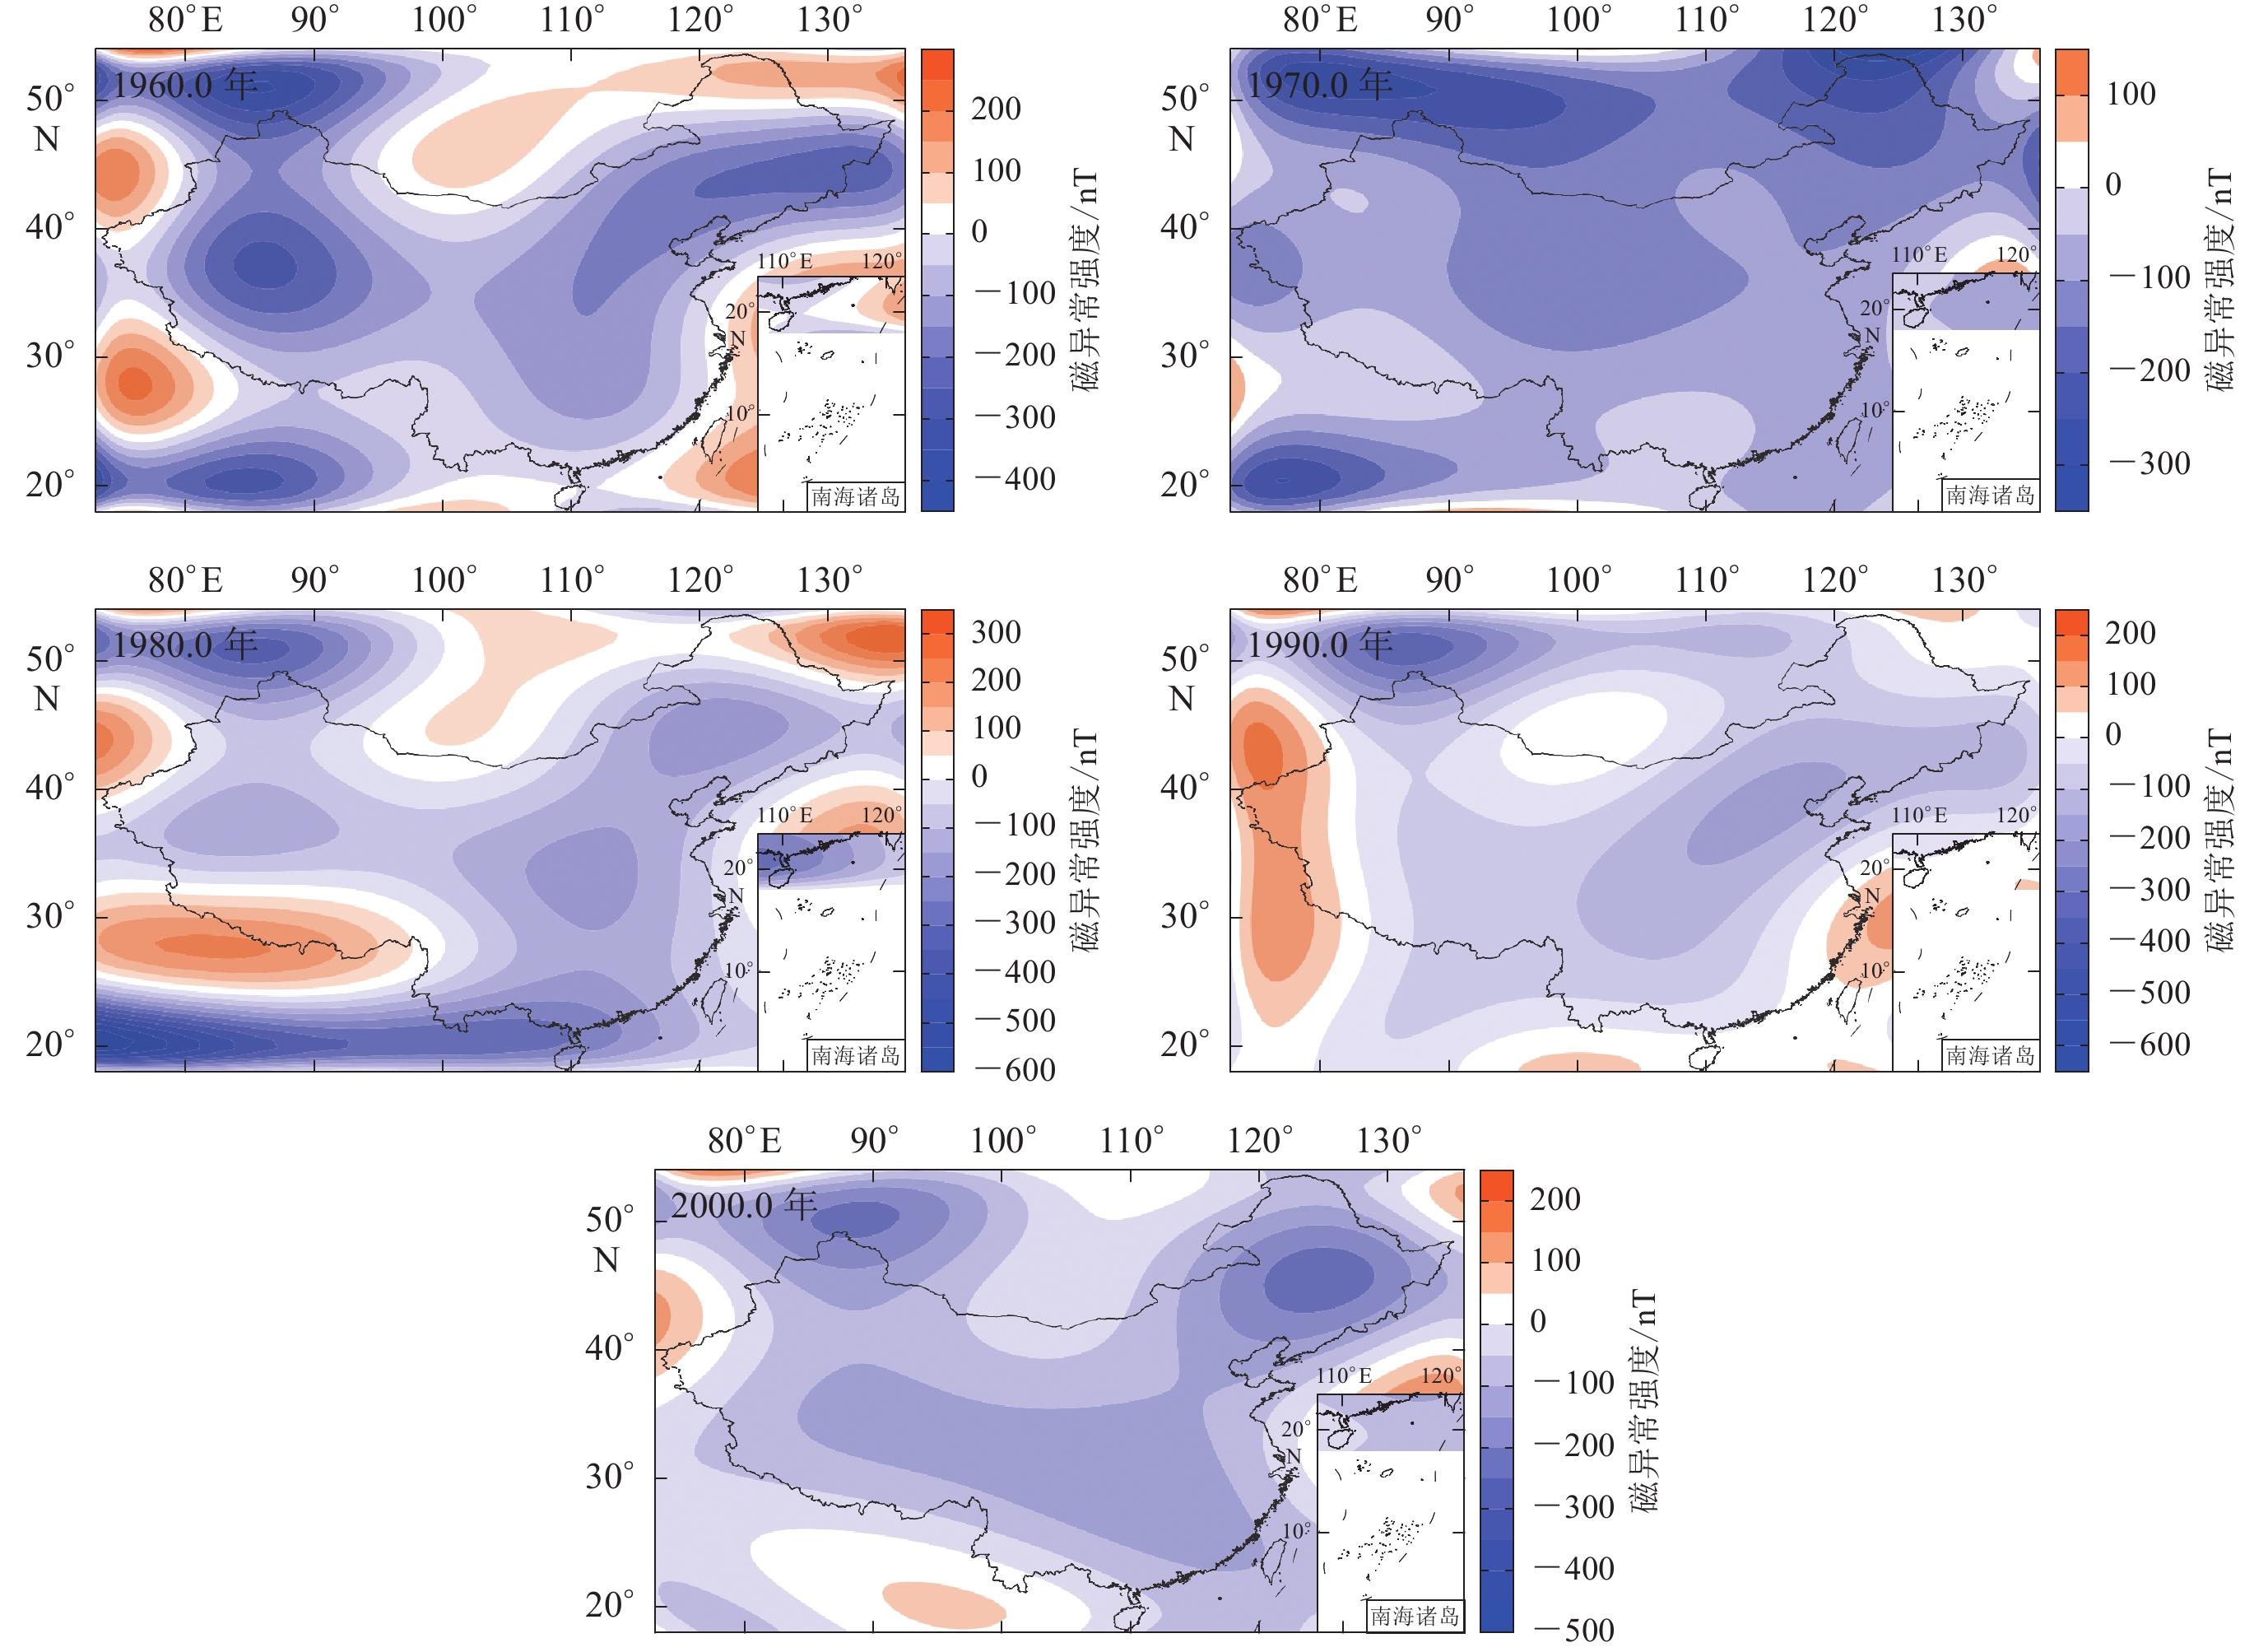
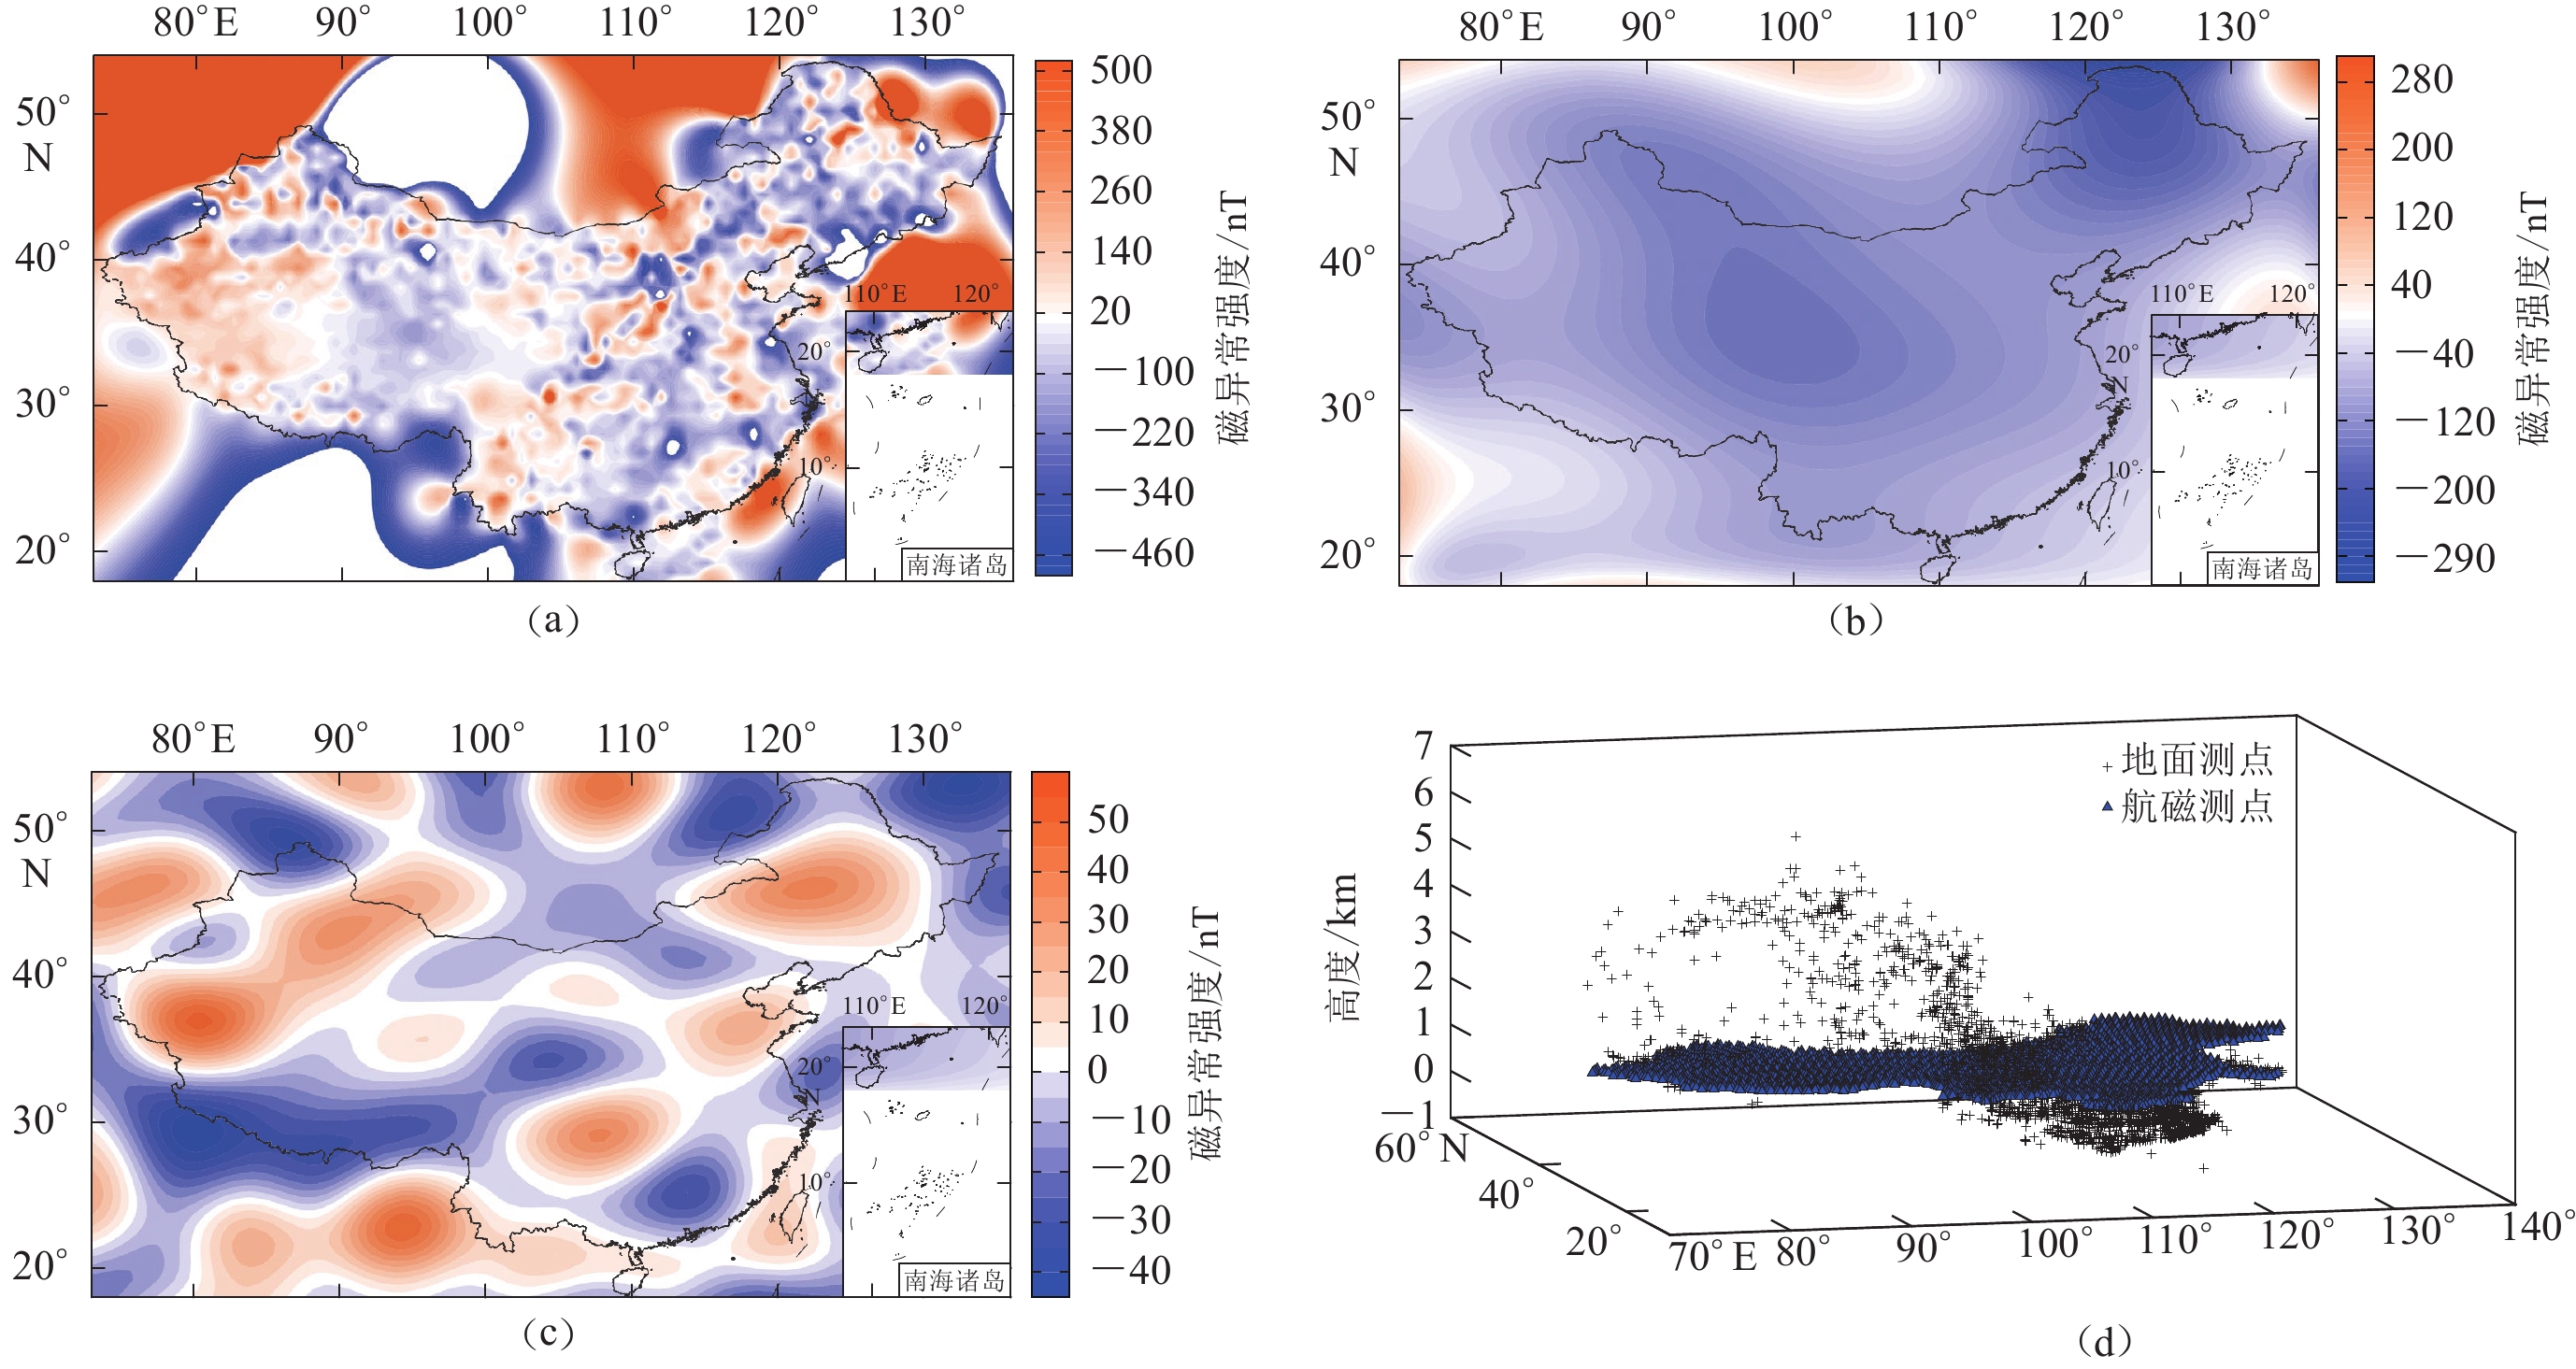
摘要: 基于1960.0,1970.0,1980.0,1990.0和2000.0年的中国大陆地区实测地磁数据,采用泰勒多项式展开建立了一个中等尺度的低空间分辨率的地壳磁异常模型,结合第四代地磁场综合模型CM4绘制了各年代的磁异常场分布图,并将所有实测点归算至2000.0 年以分析磁异常的整体分布,而后通过最新开发的综合地面磁测数据及航空磁测的三维曲面样条模型研究各年代磁异常的差异。结果显示:泰勒多项式模型的北向分量X 的磁异常强度随时间逐渐降低,分布呈向西南收缩趋势;东向分量Y的磁异常呈正值区向西部移动、负值区逐步占据优势的趋势;垂直分量Z 的磁异常以负值为主,形态较为稳定,说明该分量不易受到其它因素的干扰。对于归算后磁异常的整体分布,X向和Z向分量、总强度F、垂直分量H几乎均为负值,与CM4模型存在一定的差异。由于数据的相似性,总强度F的分布与3DSS 模型有一些相似特征,但后者可反映更多的中小尺度磁异常信息。三种模型存在的差异主要来自数据数量、位置和建模方法的不同。
-
关键词:
- 地磁场 /
- 磁异常场 /
- 泰勒多项式模型 /
- 三维曲面样条模型 /
- 第四代地磁场综合模型
Abstract: This study adopts the geomagnetic measurements of the Chinese mainland in 1960.0, 1970.0, 1980.0, 1990.0, 2000.0, and the Taylor polynomial model to build up a medium-scale crustal magnetic anomaly model with low spatial resolution, associated with the fourth-generation geomagnetic comprehensive model (CM4). The figures of the anomaly field are drawn. The whole trends of the field are studied by putting all measurements into 2000.0. The differences in anomalies among different epochs have also been analyzed by the newest three-dimensional surface spline (3DSS) model derived from all available ground and aeromagnetic data. Results show that the intensity of the northward component X decreases with time, and its distribution shrinks to the southwest; the positive area of eastward component Y gradually moves to the west, and the negative area gradually occupies most of Chinese mainland; the distribution of vertical component Z is stable and is mainly negative in the study area, which implies that other factors do not likely influence the radial component. For the overall distribution of magnetic anomalies, components X, Z, total intensity F and horizontal component H are almost negative, which differs from CM4. Regarding the data consistency, the distribution of F has some similar features to the 3DSS model, which can illustrate more middle and small wavelength structures of the anomaly field. Large differences among the three models mainly come from the different measurement numbers, locations, and modeling theories.-
Keywords:
- geomagnetic field /
- magnetic anomaly field /
- Taylor polynomial model /
- 3D surface spline model /
- CM4
-
-
![]()
图 1 中国大陆地区在1960—2000年的测点分布
Figure 1. Distribution of surveying points over Chinese mainland during 1960−2000
![]()
图 2 基于泰勒多项式模型的X分量(a)和Y分量(b)的磁异常分布图
Figure 2. Geomagnetic anomaly distributions of component X (a) and Y (b) based on Taylor polynomial model
![]()
图 3 基于泰勒多项式模型的Z分量磁异常强度分布图
Figure 3. Geomagnetic anomaly distributions of component Z based on Taylor polynomial model
![]()
图 4 基于泰勒模型 (左)和CM4模型(右)的磁异常分布
(a) X分量;(b) Y分量
Figure 4. Geomagnetic anomaly distribution based on Taylor polynomial model (left) and CM4 (right)
(a) Component X;(b) Component Y
![]()
图 4 基于泰勒模型 (左)和CM4模型(右)的磁异常分布
(c) Z分量;(d) 总强度F;(e) 水平分量H;(f) 磁偏角 D;(g) 磁倾角I
Figure 4. Geomagnetic anomaly distribution based on Taylor polynomial model (left) and CM4 (right)
(c) Component Z;(d) Total intensity F;(e) Horizontal component H;(f) Declination D;(g) Inclination I
-
安振昌. 2003. 1950—1990年中国地磁剩余场冠谐分析[J]. 地球物理学报,46(6):767–771. doi: 10.3321/j.issn:0001-5733.2003.06.007 An Z C. 2003. Spherical cap harmonic analysis of the geomagnetic residual field in China for 1950−1990[J]. Chinese Journal of Geophysics,46(6):767–771 (in Chinese).
冯彦. 2011. 中国大陆地区的岩石圈磁场模拟研究[D]. 南京: 南京农业大学: 1−127. Feng Y. 2011. Simulation of Lithospheric Magnetic Field Over Chinese Mainland[D]. Nanjing: Nanjing Agricultural University: 1−127 (in Chinese).
冯彦,蒋勇,孙涵,安振昌,黄娅. 2018. 地磁场三维曲面Spline模型[J]. 地球物理学报,61(4):1352–1365. doi: 10.6038/cjg2018K0217 Feng Y,Jiang Y,Sun H,An Z C,Huang Y. 2018. The three-dimensional surface spline model of geomagnetic field[J]. Chinese Journal of Geophysics,61(4):1352–1365 (in Chinese).
高金田,安振昌,顾左文,韩炜,詹志佳,姚同起. 2006. 用曲面Spline方法表示1900—1936年中国(部分地区)地磁场及其长期变化的分布[J]. 地球物理学报,49(2):398–407. doi: 10.3321/j.issn:0001-5733.2006.02.013 Gao J T,An Z C,Gu Z W,Han W,Zhan Z J,Yao T Q. 2006. Distributions of the geomagnetic field and its secular variations expressed by the surface spline method in China (a part) for 1900−1936[J]. Chinese Journal of Geophysics,49(2):398–407 (in Chinese).
Alldredge L R. 1981. Rectangular harmonic analysis applied to the geomagnetic field[J]. J Geophys Res:Solid Earth,86(B4):3021–3026. doi: 10.1029/JB086iB04p03021
Feng Y,Sun H,Jiang Y. 2015. Data fitting and modeling of regional geomagnetic field[J]. Appl Geophys,12(3):303–316. doi: 10.1007/s11770-015-0500-6
Feng Y,Jiang Y,Jiang Y,Liu B J,Jiang J,Liu Z W,Ye M C,Wang H S,Li X M. 2016a. Spherical cap harmonic analysis of regional magnetic anomalies based on CHAMP satellite data[J]. Appl Geophys,13(3):561–569. doi: 10.1007/s11770-016-0567-8
Feng Y,Jiang Y,Jiang Y,Li Z,Jiang J,Liu Z W,Ye M C,Wang H S,Li X M. 2016b. Regional magnetic anomaly fields:3D Taylor polynomial and surface spline models[J]. Appl Geophys,13(1):59–68. doi: 10.1007/s11770-016-0533-5
Finlay C C,Olsen N,Tøffner-Clausen L. 2015. DTU candidate field models for IGRF-12 and the CHAOS-5 geomagnetic field model[J]. Earth Planets Space,67(1):114. doi: 10.1186/s40623-015-0274-3
Finlay C C,Olsen N,Kotsiaros S,Gillet N,Tøffner-Clausen L. 2016. Recent geomagnetic secular variation from Swarm and ground observatories as estimated in the CHAOS-6 geomagnetic field model[J]. Earth Planets Space,68(1):112. doi: 10.1186/s40623-016-0486-1
Finlay C C,Kloss C,Olsen N,Hammer M D,Tøffner-Clausen L,Grayver A,Kuvshinov A. 2020. The CHAOS-7 geomagnetic field model and observed changes in the South Atlantic anomaly[J]. Earth Planets Space,72(1):156. doi: 10.1186/s40623-020-01252-9
Friis-Christensen E,Lühr H,Hulot G. 2006. Swarm:A constellation to study the Earth’s magnetic field[J]. Earth Planets Space,58(4):351–358. doi: 10.1186/BF03351933
Haines G V. 1985. Spherical cap harmonic analysis[J]. J Geophys Res:Solid Earth,90(B3):2583–2591. doi: 10.1029/JB090iB03p02583
Le Mouel J. 1969. Sur la Distribution des Elements Magnetiques en France[D]. University de Paris.
Maus S. 2010. An ellipsoidal harmonic representation of Earth’s lithospheric magnetic field to degree and order 720[J]. Geochem Geophys Geosyst,11(6):Q06015. doi: 10.1029/2010GC003026
Maus S,Lühr H,Rother M,Hemant K,Balasis G,Ritter P,Stolle C. 2007. Fifth-generation lithospheric magnetic field model from CHAMP satellite measurements[J]. Geochem Geophys Geosyst,8(5):Q05013. doi: 10.1029/2006GC001521
Maus S,Yin F,Lühr H,Manoj C,Rother M,Rauberg J,Michaelis I,Stolle C,Müller R D. 2008. Resolution of direction of oceanic magnetic lineations by the sixth-generation lithospheric magnetic field model from CHAMP satellite magnetic measurements[J]. Geochem Geophys Geosyst,9(7):Q07021. doi: 10.1029/2008GC001949
Maus S,Barckhausen U,Berkenbosch H,Bournas N,Brozena J,Childers V,Dostaler F,Fairhead J D,Finn C,Von Frese R R B,Gaina C,Golynsky S,Kucks R,Lühr H,Milligan P,Mogren S,Müller R D,Olesen O,Pilkington M,Saltus R,Schreckenberger B,Thébault E,Tontini T C. 2009. EMAG2:A 2-arc min resolution earth magnetic anomaly grid compiled from satellite,airborne,and marine magnetic measurements[J]. Geochem Geophys Geosyst,10(8):Q08005. doi: 10.1029/2009GC002471
Meyer B,Chulliat A,Saltus R. 2017. Derivation and error analysis of the earth magnetic anomaly grid at 2 arc min resolution version 3 (EMAG2v3)[J]. Geochem Geophys Geosyst,18(12):4522–4537. doi: 10.1002/2017GC007280
Neubert T,Mandea M,Hulot G,von Frese R,Primdahl F,Jørgensen J L,Friis-Christensen E,Stauning P,Olsen N,Risbo T. 2001. Ørsted satellite captures high-precision geomagnetic field data[J]. EOS,82(7):81–88.
Olsen N,Ravat D,Finlay C C,Kother L K. 2017. LCS-1:A high-resolution global model of the lithospheric magnetic field derived from CHAMP and Swarm satellite observations[J]. Geophys J Int,211(3):1461–1477. doi: 10.1093/gji/ggx381
Ou J M,Du A M,Thébault E,Xu W Y,Tian X B,Zhang T L. 2013. A high resolution lithospheric magnetic field model over China[J]. Science China Earth Science,56(10):1759–1768. doi: 10.1007/s11430-013-4580-y
Purucker M E, Whaler K A. 2007. Treatise on Geophysics, Volume 5[M]. Amsterdam: Elsevier: 195–237.
Reigber C,Lühr H,Schwintzer P. 2002. Champ Mission status[J]. Adv Space Res,30(2):129–134. doi: 10.1016/S0273-1177(02)00276-4
Sabaka T J,Olsen N,Purucker M E. 2004. Extending comprehensive models of the Earth’s magnetic field with Ørsted and CHAMP data[J]. Geophys J Int,159(2):521–547. doi: 10.1111/j.1365-246X.2004.02421.x
Sabaka T J,Olsen N,Tyler R H,Kuvshinov A. 2015. CM5,a pre-Swarm comprehensive geomagnetic field model derived from over 12 yr of CHAMP,Ørsted,SAC-C and observatory data[J]. Geophys J Int,200(3):1596–1626. doi: 10.1093/gji/ggu493
Sabaka T J,Tøffner-Clausen L,Olsen N,Finlay C C. 2020. CM6:A comprehensive geomagnetic field model derived from both CHAMP and Swarm satellite observations[J]. Earth Planets Space,72(1):80. doi: 10.1186/s40623-020-01210-5
Thébault E,Hulot G,Langlais B,Vigneron P. 2021. A spherical harmonic model of Earth’s lithospheric magnetic field up to degree 1050[J]. Geophys Res Lett,48(21):e2021GL095147. doi: 10.1029/2021GL095147
Xiong S Q,Tong J,Ding Y Y,Li Z K. 2016. Aeromagnetic data and geological structure of continental China:A review[J]. Appl Geophys,13(2):227–237. doi: 10.1007/s11770-016-0552-2
 下载:
下载:


计量
- 文章访问数: 278
- HTML全文浏览量: 122
- PDF下载量: 99
