

An estimation model of high frequency attenuation coefficient of ground motion for local site
-
摘要:
采用随机有限断层法进行地震动模拟时,选用合理的参数描述特定局部场地近地表高频衰减特征,对评价地震动模拟结果的正确与否具有重要的实践意义。 在工程场址地震动参数预测中,如何快速确定参数的取值,是实际应用中亟需解决的问题。首先对场地高频衰减系数κ0与平均剪切波速vS30的相关性进行了分析;然后,基于国内外学者计算得到的546个κ0系数,采用一定时窗内的κ0均方根值,讨论其随平均剪切波速vS30增加的变化趋势。 结果表明,虽然κ0具有明显的区域差异性,但其均方根值随着vS30的增大呈现出逐渐减小的趋势。 为了得到合理的κ0估计模型,分别采用线性函数、多项式函数、对数线性函数和双对数线性函数对κ0均方根值与vS30的关系进行初步拟合,结果表明,对数线性函数能够较好地描述κ0与vS30之间的关系。 最后,基于筛选得到的477个数据,采用最小二乘法对模型参数进行拟合,建立了适合工程应用的κ0-vS30模型。对模型适用性的分析表明,本研究所构建的κ0估计模型能够合理估计地震动的高频衰减影响。
-
关键词:
- 地震动模拟 /
- 高频衰减系数κ0 /
- 平均剪切波速vS30 /
- 最小二乘法
Abstract:When using the stochastic finite fault method for ground motion simulation, how to select reasonable parameters to describe the near-surface high-frequency attenuation characteristics of a specific local site has important practical significance for evaluating the correctness of ground motion simulation results. In the prediction of ground motion parameters of engineering sites, how to quickly determine the value of parameters is an urgent problem to be solved in practical applications. Firstly, we analyzed the correlation between the high-frequency attenuation coefficient κ0 of the site and the average shear wave velocity vS30. Then, based on the 546 κ0 coefficients calculated by domestic and foreign scholars, the root mean square value of κ0 in a certain time window was used to discuss its variation trend with the increase of the average shear wave velocity vS30.The results showed that although κ0 had obvious regional differences, its root mean square value showed a decreasing trend with the increase of vS30. In order to obtain a reasonable κ0 estimation model, the linear function, polynomial function, logarithmic linear function and log-log linear function were used to preliminarily fit the relationship between the root mean square value of κ0 and vS30. The results show that the logarithmic linear function can better describe the relationship between κ0 and vS30. Finally, based on the 477 data obtained from the screening, the model parameters were fitted by the least square method, and a practical model of κ0-vS30 suitable for engineering applications was obtained. The analysis of the applicability of the model shows that the κ0 estimation model constructed in this study can reasonably estimate the high-frequency attenuation of ground motion when predicting engineering site ground motion parameters.
-
引言
采用随机有限断层法进行地震动模拟时,地震动传播过程中的衰减包括两部分,其一是路径衰减,即随距离$R$的增加而使振幅减小的几何衰减,以及由于地球介质对波能的吸收和耗散产生的非弹性衰减;其二是场地效应的影响,即需要考虑近地表地震动幅值影响和与路径无关的地震动高频衰减。Anderson和Hough (1984)引入kappa滤波器,即exp (−πfκ)(f为频率,κ为高频衰减系数),来模拟地震动高频部分的衰减,局部场地的地震动高频衰减则可采用0 km处的κ值κ0表示。 κ表征在某一频率之后,地震动傅里叶幅值谱会随着频率的增大而减小。 如何估计特定场址的κ值,基于不同的研究目标已有很多计算方法,例如:Anderson和Humphrey (1991)提出的宽带反演方法,其关键在于假定震源谱形状,此种方法不受震级大小的约束;Kilb等(2012)提出固体应力降方法,适用于各种震级,主要用于拐角频率不确定、不易测定或探究拐角频率影响。工程地震领域场址地震动模拟中,普遍采用由Anderson和Hough (1984)提出的加速度反应谱法估计κ值,直接从加速度记录的傅里叶幅值谱的高频部分测量κ,在半对数坐标系下,高频衰减系数κ可以用最简单的线性近似得到。但这些估计κ值的方法普遍依赖于实际地震记录,在预测未来某场址的地震动时,很难直接从实际地震记录来获取研究区域的κ值,因此需要构建一个用于估计κ值的实用模型,使其能够在对不同类型场址的地震动预测中合理地模拟地震动高频衰减。 然而,κ值的影响因素很多,例如:Hanks (1982)认为高频衰减现象与场地性质有关;Boore (1983)认为κ值与震源或场地条件有关,而与传播路径无关;Anderson和Hough (1984)提出κ值与震中距呈正相关,且主要受近地表地质构造影响;Atkinson (1984)则认为κ值与场地和震源都存在一定的关系。
虽然不同学者对影响κ值的因素尚未达成一致的结论,但对局部场地地震动高频衰减系数κ0影响因素的研究表明,κ0与平均剪切波速 vS30之间存在比较显著的相关性(Silva et al,1998;Chandler et al,2006;Drouet et al,2010;van Houtte et al,2011;Laurendeau et al,2013;Edwards et al,2015)。 比如,Anderson等( 1996 )模拟了S波在土层中的传播,结果表明κ0对地震动峰值振幅的影响与平均剪切波速 vS30有相同的量级,并建议完备的场地分类应该同时考虑κ0和 vS30的影响。为了便于工程应用中能快速进行κ0的估计,本研究试图在κ0和 vS30之间寻找合适的统计关系,用于近似模拟工程场址的地震动高频衰减。本文拟基于国内外学者研究得到的546个κ0值,分析κ0值随vS30增大的变化趋势,并选取合适的函数形式拟合得到适合于工程应用的κ0-vS30模型,进而得到κ0估计模型,以期为工程场址地震动模拟给出合理的高频衰减系数估计。
1. 地震动模拟中局部场地的高频衰减
随机有限断层法是基于随机理论发展起来的地震动模拟方法,其主要思想是将一个发震规模较大的断层划分为一系列子断层(子源),然后将每一个子断层视为点源,得到每个子源在场址产生的地震动,最终累加所有子源对场址的贡献即可得到整个断层破裂在场址产生的地震动。如果在频域综合考虑震源、传播路径及场地效应的影响,则每个子源产生的傅里叶幅值谱FA(M0,f,R)可以写为:
$$ {F_{\rm{A}}} ( {{M_0}, f, R} ) = S ( {{M_0}, f} ) P ( {R, f} ) G ( f ) I ( f ) \text{,} $$ (1) 式中: M0为子源的地震矩; S(M0,f)表示震源谱; P(R,f)描述传播路径衰减影响;f为频率;R表示震源距;$I(f)= ( 2\text{π}f{\rm{i}} ) ^{n}$为地震动类型因子,当输出为位移、速度和加速度时, n的取值分别为0,1,2;$G ( f ) $描述场地效应影响,可以表示为
$$ G ( f ) = A ( f ) K ( f ) \text{,}$$ (2) 式中:A(f)为近地表幅值放大因子,表示研究区域场地对地震谱的放大系数随频率的变化关系;K(f)为与路径无关的高频衰减项,可用kappa滤波器来表示,即
$$ K ( f ) = \exp ( { - \pi f\kappa } ) \text{.} $$ (3) 此时$K ( f ) $种对距离的依赖被认为是线性的,表示为
$$ \kappa ( R ) = {\kappa _0} + a R\text{,} $$ (4) 式中,震源距的影响可以通过设置R为0来消除,即κ0表示地震波在场地下方地质结构中的衰减。Anderson和Hough (1984)认为对于不同观测点的近地表地质条件, κ0可以表示地震波在观测台站下几百米甚至几千米的衰减,即κ0是一个与局部场地条件相关的参数。
由于式(1)所示的G(f)主要描述场地效应的影响,因此在地震动的模拟中,式(3)所述的高频衰减主要考虑局部场地的影响,因此代表与路径无关的高频衰减项K(f)可表示为
$$ K ( f ) = \exp ( { - \pi f{\kappa _0}} ) {\text{.}} $$ (5) 如前所述,κ0是一个与局部场地条件相关的参数,已有研究也表明,平均剪切波速 vS30作为场地条件参数研究基础深厚,其与场地放大效应的相关性显著且得到了学界的普遍认可,作为一个独立参数应用便捷意义清晰,在地震工程领域应用广泛(Castellaro et al,2008;Lee, Trifunac, 2010;Boore et al, 2011)。 因此,本文在后续的研究中,将以 vS30作为场地条件划分的依据,讨论对局部场地高频衰减系数κ0的估计。
2. κ0数据来源和分析
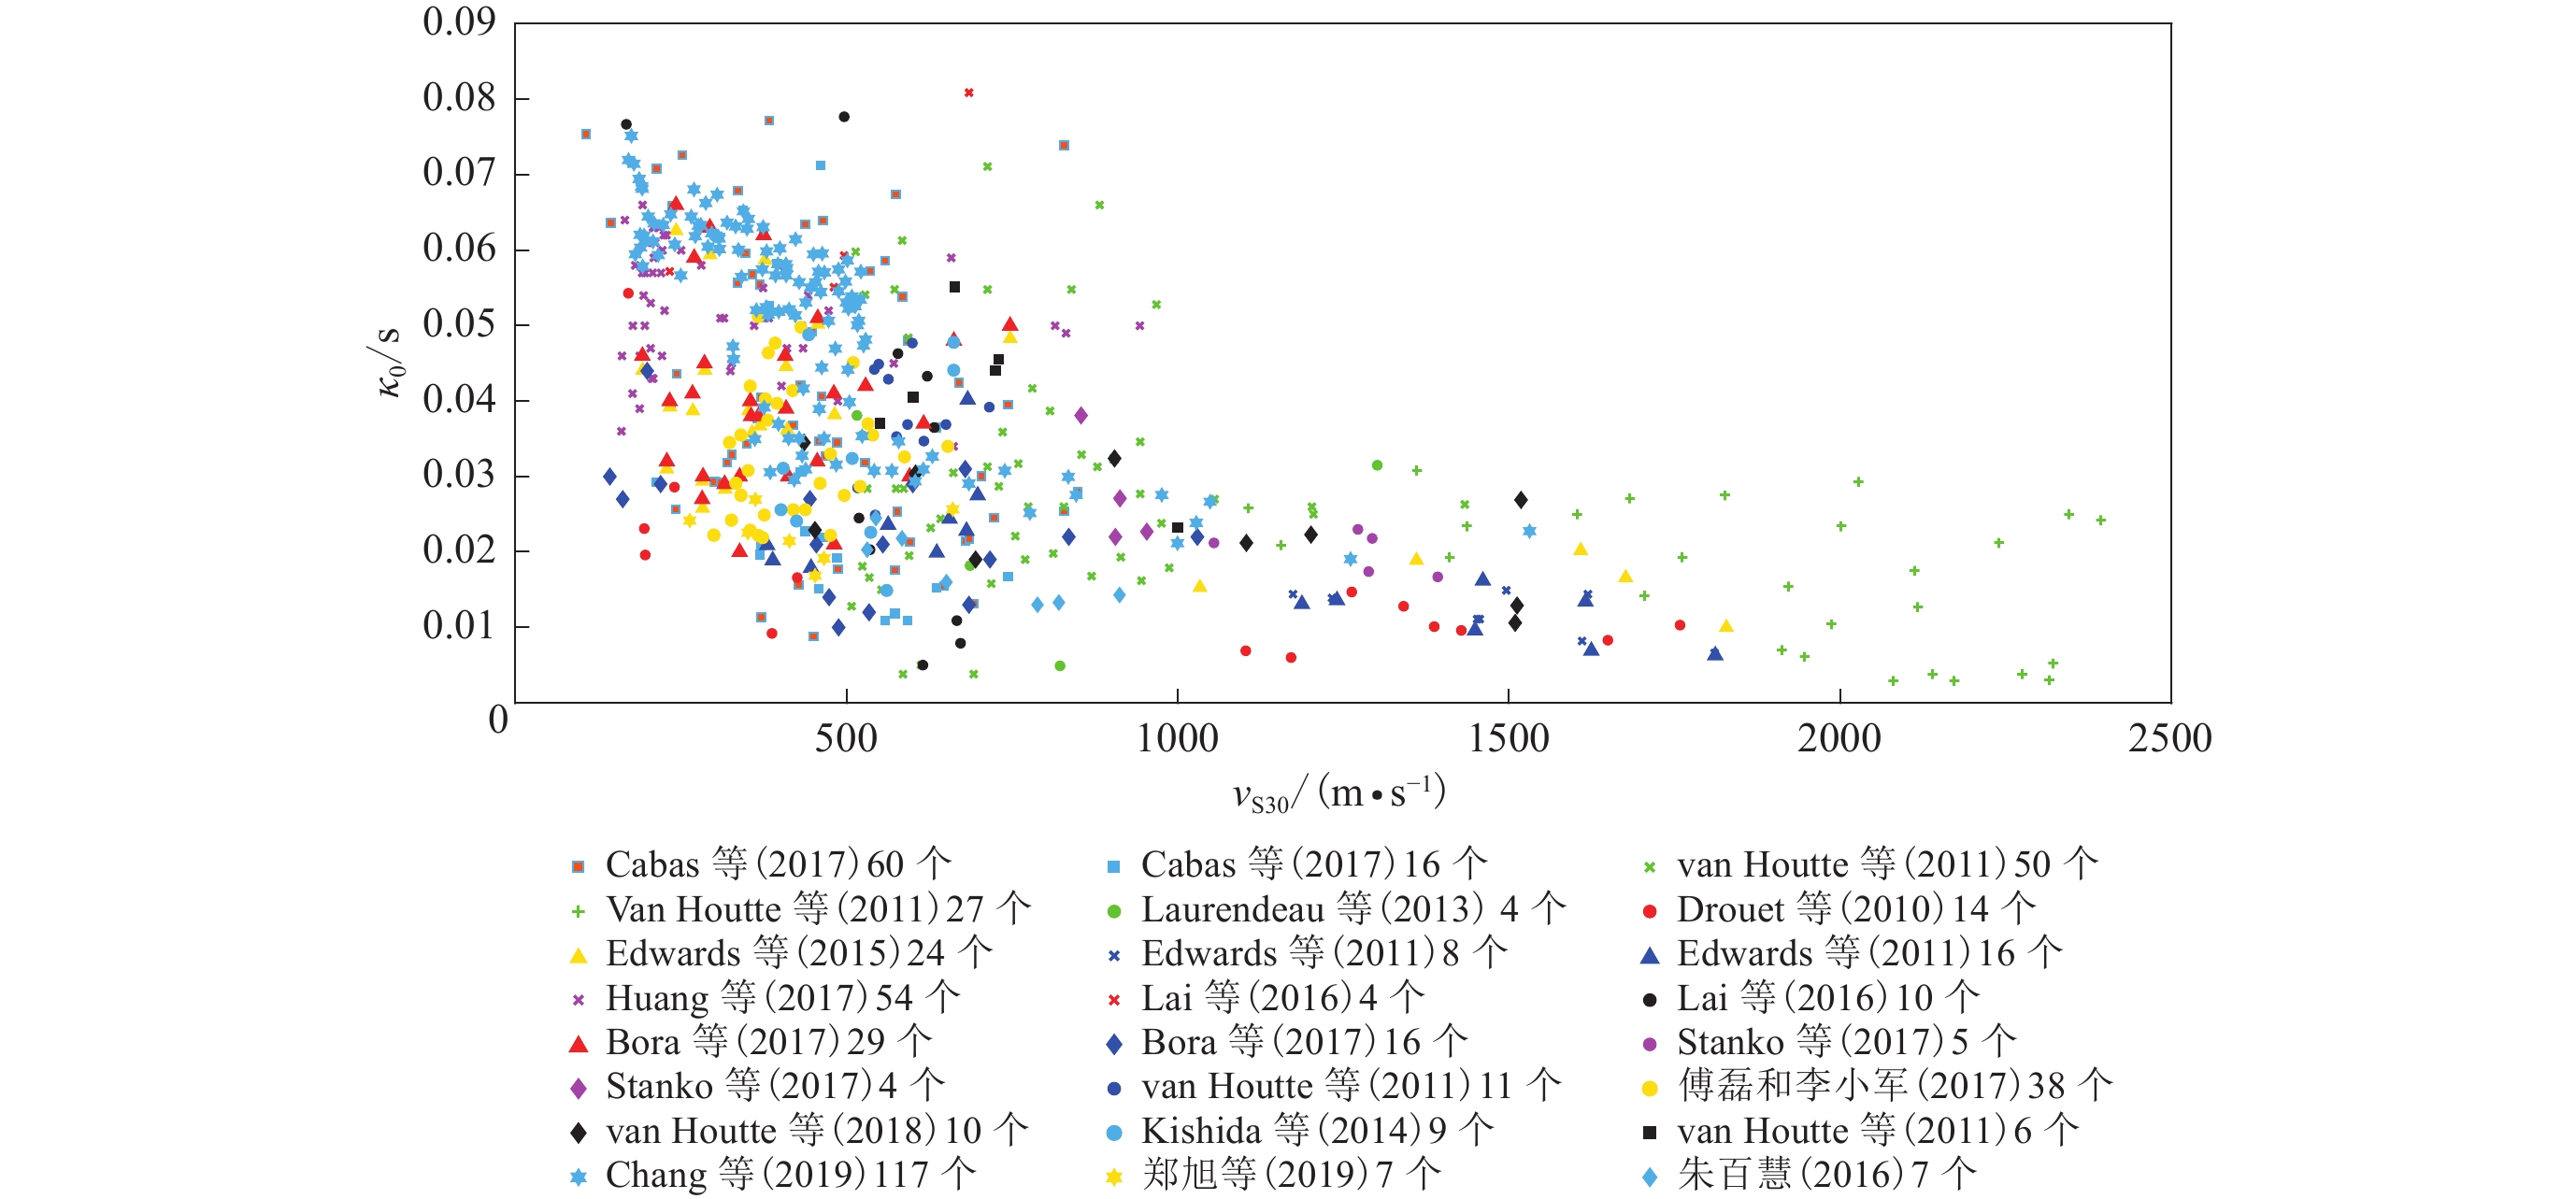
本文用于统计和分析的κ0如表1所示,包含了亚洲、欧洲、北美洲和大洋洲的546个数值。其中,平均剪切波速vS30的变化范围在106.8—2 394.0 m/s之间,κ0的取值范围在0.002 9—0.087 5 s之间,为了详细分析κ0随vS30的变化情况,本文在vS30<1500 m/s范围内,以ΔvS30=100 m/s为间隔,当vS30大于1 500 m/s时,以300 m/s为间隔,对每个分级档内κ0的数量、最小值、最大值、标准差和均值进行了统计分析(图1,表2)。可以看出,当vS30的变化范围在100—1 000 m/s时,虽然数据分布较多,但数据标准差介于0.011—0.018之间,分布相对较为离散;当 vS30大于1 000 m/s时,数据分布相对较少,标准差也相对较为集中,在0.003 9—0.093 6之间。图2直观地给出了表2中的统计数据的变化情况,图中表示了各组数据的最小值、下四分位数、中位数、上四分位数以及最大值的分布情况。可以看出,虽然κ0中位数在不同的vS30分级档内有一定的波动,但总体上呈随着 vS30的增大逐渐减小的趋势。
表 1 本文研究采用的κ0数目、来源及相应的vS分布范围Table 1. The number and source of κ0 used in this study and the corresponding distribution range of vS序号 数据个数 vS30/(m·s−1) 地区 数据来源 1 60 106.8—904.2 日本 Cabas等(2017) 2 16 213.2—744.1 日本 Cabas等(2017) 3 50 507.7—1 433.4 日本 van Houtte等(2011) 4 27 1 106.8— 2 394.0 日本 van Houtte等(2011) 5 4 515.7—1 301.3 日本 Laurendeau等(2013) 6 14 170.6—1 428.1 法国 Drouet等(2010) 7 24 192.1—747.1 瑞士 Edwards等(2015) 8 8 1 174.0—1 810.5 瑞士 Edwards等(2011) 9 16 380.1—1 811.5 瑞士 Edwards等(2011) 10 54 160.1—942.8 中国台湾 Huang等(2017) 11 4 233.1—684.8 中国台湾 Lai等(2016) 12 10 167.5—496.4 中国台湾 Lai等(2016) 13 29 191.8—746.9 土耳其 Bora等(2017) 14 16 142.6—1 029.6 意大利 Bora等(2017) 15 5 1 054.7—1 392.5 克罗地亚 Stanko等(2017) 16 4 854.1—953.3 克罗地亚 Stanko等(2017) 17 11 516.6—715.5 中国台湾 van Houtte等(2011) 18 38 299.6—652.9 中国 傅磊和李小军(2017) 19 10 435.7—1 518.3 新西兰 van Houtte等(2018) 20 9 401.0—661.8 亚利桑那 Kishida等(2014) 21 6 550.9—1 000.3 加利福尼亚 van Houtte等(2011) 22 117 170.9—1 531.2 中国台湾 Chang等(2019) 23 7 263.3—660.3 中国 郑旭等(2019) 24 7 531.2—912.1 日本 朱百慧(2016) ![]() 图 1 本文研究采用的κ0值随平均剪切波速 vS30的分布Figure 1. The distribution of κ0 value used in this study with mean shear wave velocity vS30表 2 κ0值在不同 vS30范围的分组统计Table 2. Group statistics of κ0 values in different vS30 ranges
图 1 本文研究采用的κ0值随平均剪切波速 vS30的分布Figure 1. The distribution of κ0 value used in this study with mean shear wave velocity vS30表 2 κ0值在不同 vS30范围的分组统计Table 2. Group statistics of κ0 values in different vS30 rangesvS30/(m·s−1) κ0值 数量 最小值 最大值 标准差 均值 100—200 37 0.019 6 0.076 7 0.014 85 0.054 48 200—300 65 0.022 2 0.072 6 0.014 58 0.051 33 300—400 95 0.009 2 0.077 2 0.015 38 0.043 41 400—500 95 0.008 8 0.087 5 0.016 06 0.040 43 500—600 73 0.003 8 0.067 4 0.015 16 0.035 60 600—700 46 0.003 8 0.080 9 0.015 17 0.029 28 700—800 24 0.013 0 0.071 1 0.014 11 0.033 48 800—900 19 0.004 9 0.073 9 0.017 84 0.034 12 900—1000 16 0.014 3 0.052 8 0.010 99 0.027 61 1 000—1 100 7 0.015 3 0.027 0 0.003 93 0.022 73 1 100—1 200 7 0.006 0 0.025 8 0.007 52 0.015 47 1 200—1 300 10 0.013 6 0.026 0 0.004 61 0.019 67 1 300—1 400 6 0.010 1 0.031 5 0.009 06 0.020 13 1 400—1 500 9 0.009 6 0.026 3 0.006 15 0.015 72 1 500—1 800 16 0.006 9 0.027 1 0.006 75 0.016 06 1 800—2 100 11 0.002 9 0.029 3 0.009 36 0.013 71 2 100—2 400 10 0.002 9 0.025 0 0.009 30 0.011 93 3. κ0变化特点及模型选择
由图2可以看出,虽然整体数据分布较为离散,但κ0的中位数值随平均剪切波速 vS30的增大而减小的趋势还是很明显的。为了更加详细地分析κ0随 vS30的变化,本文选用滑动平均法对数据进行了处理。滑动窗长度为200 m/s,步长为20 m/s,按照式(6)所示的方法计算每个窗内全部数据的均方根值κrms。图3中三角形是按照式(6)计算得到的115个均方根值,可以很清晰地看出,κrms呈现出随着 vS30的增加逐渐减小的趋势。
$$ {\kappa _{{\rm{rms}}}} = \sqrt {\dfrac{{\sum\limits_{i = 1}^N {} \kappa _i^2}}{N}} \text{,} $$ (6) 式中:κi表示不同滑动窗内的κ0值,N为κ0的个数.
为了拟合κ0随vS30的变化,本文选用了四个常用的函数形式,即线性函数、多项式函数、对数线性函数和双对数线性函数,对上述115组数据进行拟合,拟合曲线如图3所示。函数表达形式和拟合结果列于表3。分析四个函数的拟合结果可知,相比于线性和双对数线性函数,多项式和对数线性函数拟合的和方差SSE最接近于0,拟合优度R2最接近于1,拟合效果相对更为理想。但从图3所示的曲线变化趋势来看,多项式拟合结果在 vS30>2 000 m/s的时候有逐渐增大的趋势,这和本文对κ0变化的认识不符。考虑到对数线性函数拟合无论在拟合优度和曲线的变化趋势上,都能很好地模拟κ0随 vS30的变化,与整体数据变化趋势最为接近,因此本文选用对数线性函数作为模型形式对原始数据进行拟合。
表 3 κrms与 vS30的经验关系Table 3. The empirical relationship between кrms and vS30拟合函数 模型参数 a b SSE R2 c 线性函数:κrms=avS30+b −1.557×10⁻⁵ 4.478×10⁻² 3.61×10⁻³ 7.734×10⁻¹ 多项式函数:κrms=${av^2_{{\rm{S}}30}} $+bvS30+c 1.284×10⁻⁸ −4.741×10⁻⁵ 6.559×10⁻⁴ 9.587×10⁻¹ 5.886×10⁻⁵ 对数线性函数:κrms =algvS30+b −3.439×10⁻² 1.286×10⁻¹ 1.466×10⁻³ 9.07 8×10⁻¹ 双对数线性函数:lgκrms=algvS30+b −4.488×10⁻¹ −2.72×10⁻¹ 2.245×10⁻³ 8.587×10⁻¹ 注:表中a,b和c为模型拟合参数,SSE 表示和方差,R2为拟合优度。 4. 基于vS30的κ0估计模型
4.1 模型参数拟合及实用性分析
由第3节的讨论可知,κ0与平均剪切波速 vS30之间呈现出很强的负相关性,本文采用式(7)所示的对数线性函数作为κ0-vS30的模型函数,即
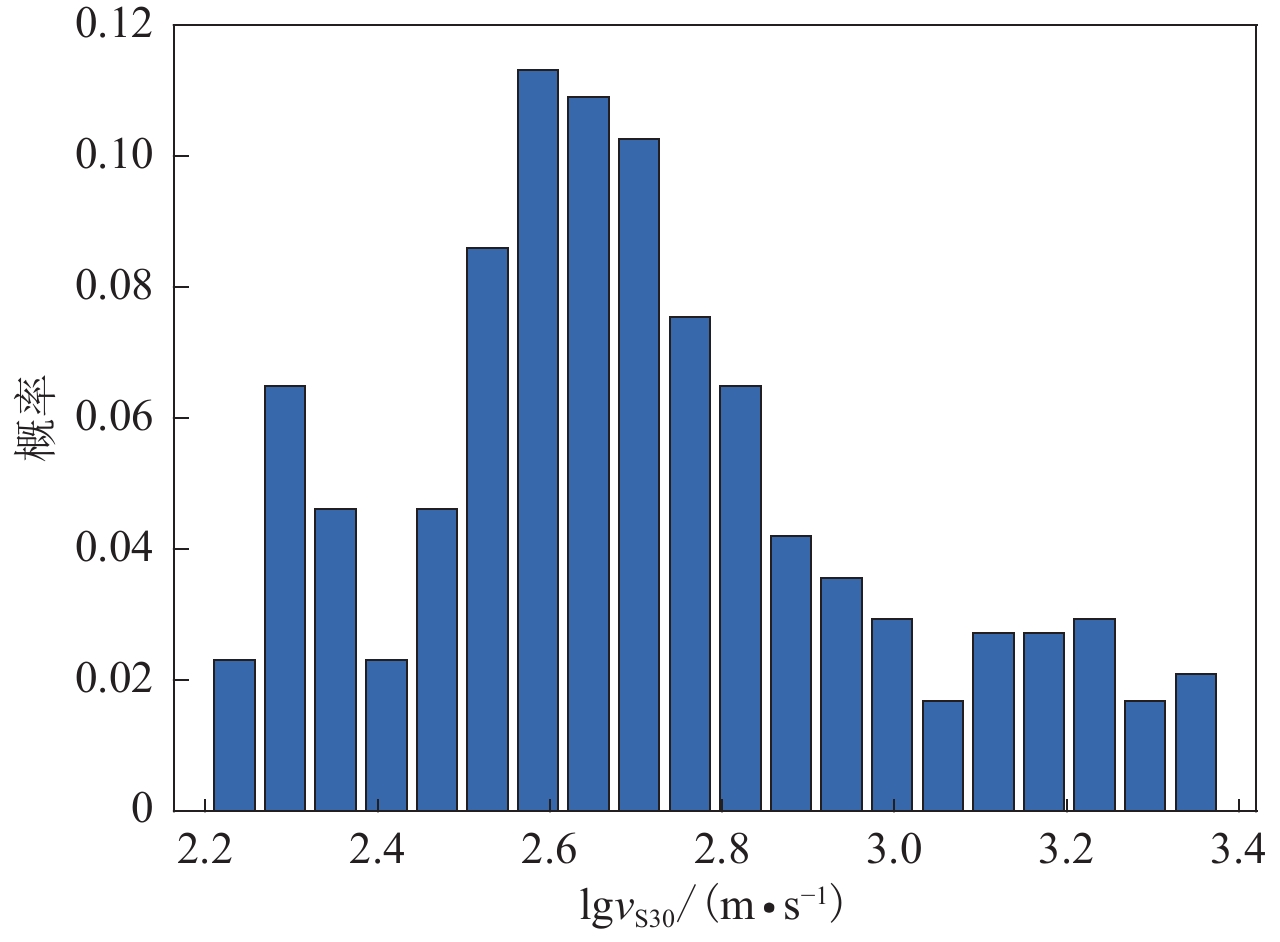
$$ {\kappa _0} = a{\rm{lg}}{v_{{\rm{S}}30}} {\text{+}} b{\text{.}} $$ (7) 为了能够合理地对模型参数a和b进行拟合,本文对原始数据的分布情况进行分析。数据整体分布情况如图4所示,可以看出数据整体呈近似对数正态分布形式,因此本文采用最小二乘法对式(7)所示的模型函数进行参数拟合。最小二乘法是一种数学优化技术,它通过最小化误差的平方和来寻找数据的最佳函数匹配。利用最小二乘法可以简便地求得未知的数据,并使得这些求得的数据与实际数据之间误差的平方和为最小,从而保证拟合模型与实际数据之间的误差最小,使所得到的拟合模型符合要求。需要说明的是,由于部分原始数据偏离样本均方根值较远,为了保证拟合参数的合理性,本文对原始数据以偏离统计均方根值的程度进行了适当的筛选,最后选取477个原始数据用于模型拟合。
利用最小二乘法,对选取的477个原始数据进行如式(7)所示的模型参数拟合,拟合得到的模型为
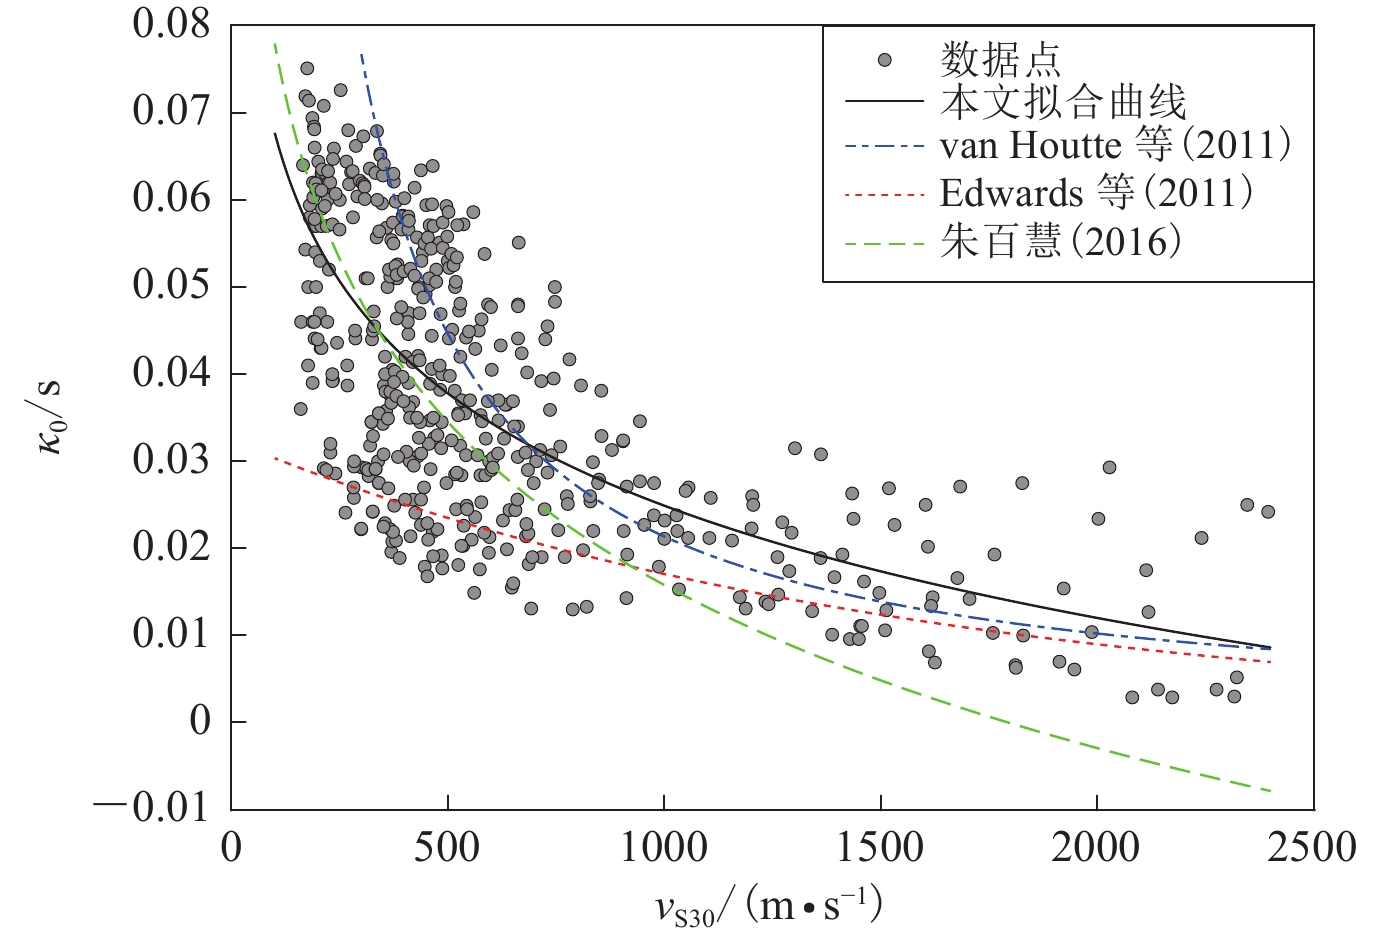
$$ {\kappa _0} = - 0.042\;8{\text{lg}}{v_{{\rm{S}}30}} + 0.153\;3.$$ (8) 模型拟合得到的和方差SSE=0.066 58,拟合优度R2=0.489 9,标准差σ=0.011 8。由于和方差接近于0,标准差也相对较小,说明对数线性函数模型对原始数据拟合的效果较为理想。式(8)所示模型对原始数据的拟合情况如图5所示,可以看出,拟合曲线能够较好地穿过原始数据,且能够较好地表示κ0随 vS30的变化趋势。此外,图5中列出了三个学者提出的κ0模型:van Houtte (2011)模型是基于日本地区数据提出的,通过比较可以看出,虽然在 vS30>700 m/s部分与本文的模型较为贴近,但模型在vS30较小的范围内对κ0的估值偏大;模型Edwards (2011) 是基于瑞士地区数据提出的,vS30在100—1 500 m/s范围内对κ0的估计普遍偏低,在vS30>1 500 m/s时与本文得到的结果相近;朱百慧 (2016) 模型也是基于日本地区数据提出的,该模型在vS30<500 m/s部分与本文研究结果较为符合,但在vS30大于500 m/s的范围内,对κ0的估计明显偏低。
![]() 图 5 对数线性函数拟合以及与其它模型对比Figure 5. Log-linear function fitting and comparison with other models
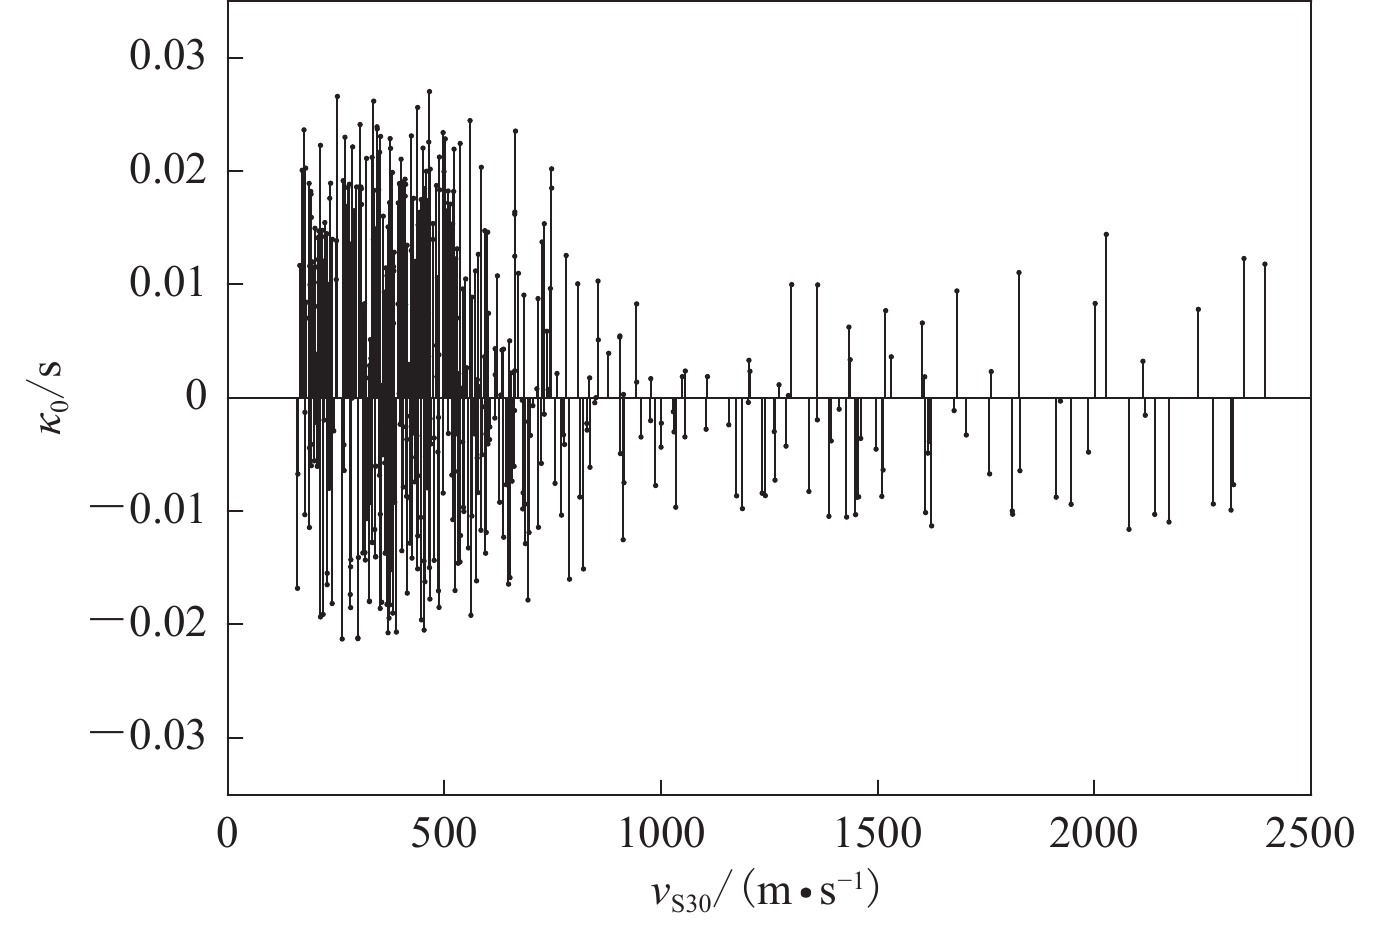
图 5 对数线性函数拟合以及与其它模型对比Figure 5. Log-linear function fitting and comparison with other models为进一步探究对数模型的拟合效果,本文采用式(9)对拟合结果进行残差分析,从而确定拟合结果的优劣,即:
$$ \varepsilon = {\kappa _{\rm{p}}} - {\kappa _{\rm{t}}}\text{,} $$ (9) 式中,ε表示由估计值与实测值确定的残差,κp表示κ0的估计值,κt表示κ0的实测值。
图6所示为计算得到的残差ε随着 vS30的变化,可以看出,残差在零线附近 [ 0,0.02 ]范围内呈正态分布,结果介于 [ −0.025,0.025 ] 之间,进一步说明拟合结果较为理想。
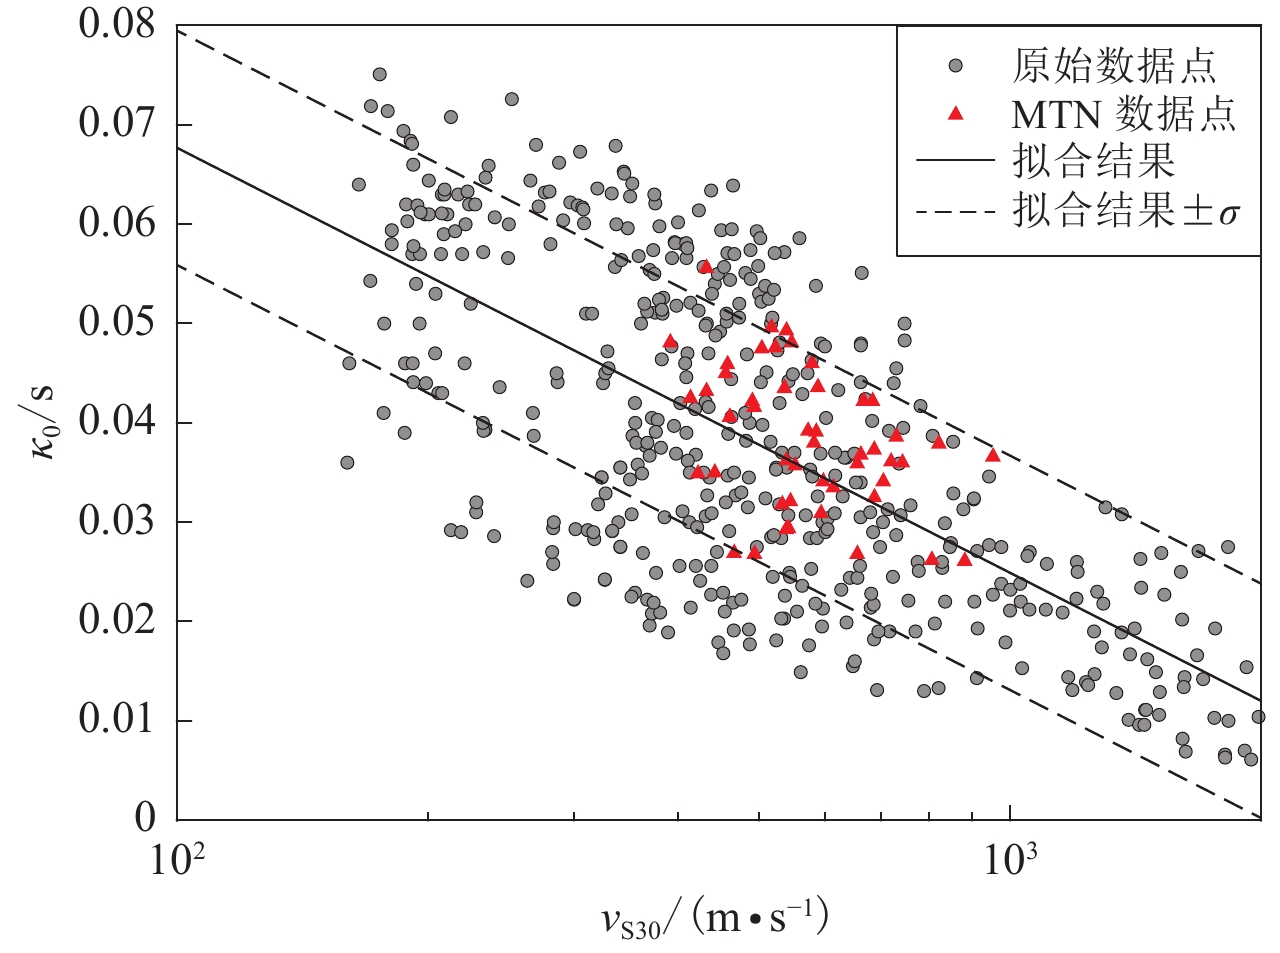
为了检验式(8)所示的模型对整体数据的包容情况,本文分析了原始数据在拟合均值±1倍标准差范围内的分布情况,计算结果表明,76.7%的原始数据点落在拟合均值±σ区间范围内(图7)。对结果进一步分析表明,本文建立的模型能够较好地表征κ0与vS30之间的关系,拟合模型的标准差取值也能较好地表示数据的离散程度,式(8)所示的模型可用来估计κ0均值。
为了检验式(8)所示模型的适用性,本文选用了根据中国台湾地区TSMIP强震台站(包括48个MTN强震台站)1989—2020年的48条强震记录计算得到的κ0值,vS30为 391.0—954.1 m/s的范围之间,κ0在0.026 1—0.055 6 s的范围之间变化。图7三角形数据点所示为48个κ0数据落在本文建立的模型中的情况,可以看出,48个数据中有91.7%的数据点落在κ0均值±σ范围之内,进一步说明本文给出的κ0-vS30模型可以用来合理地估计地震动的高频衰减。
4.2 对κ0估计的讨论
虽然本文得到了一个可以近似估计局部场地地震动高频衰减系数的模型,但是在进行数据的统计分析中,还存在一些问题需要进一步讨论。
1) 数据区域性的影响. 在本文的统计分析中,没有区分数据来源区域,将亚洲、欧洲、北美洲、大洋洲等不同区域的数据放在一起进行统计分析。分析图1所示的分类数据和图7所示的κ0均值的估计值,可以看出,κ0的估计具有一定的区域差异性,例如Drouet 等(2010) 研究结果中的法国数据分布于拟合曲线下方,van Houtte等 (2011)研究采用的日本数据则相对均匀地分布在拟合曲线上下两侧,Bora等(2017)研究中给出的意大利数据集中分布于拟合曲线下方,而Chang等(2019)研究中给出的中国台湾数据则集中分布于拟合曲线上方,由此可见数据的区域性分布较为明显,对κ0的估计也会产生一定的影响。
2) 场地条件的影响. 本文给出的κ0的估计模型仅考虑其与平均剪切波速vS30之间的关系,由于κ0描述地震波在观测台站下几百米甚至几公里的衰减,因此,对κ0取值的影响可能会与场址下方的介质相关。此外,对vS30的计算方法可能也有影响,vS30和场地效应之间的联系是统计性的,而不是物理性的直接预测,因而不同的计算方法会产生不同的结果,从而间接影响κ0的估计。
3) κ0计算方法的影响. κ0计算方法有很多种,不同的计算方法会导致结果的偏差。由于本文的研究数据来源于不同学者的研究结果,在κ0计算方法上有差异,从而导致κ0计算结果离散性较大,最终影响κ0的估计。
4) 模型选择的影响. 由于回归模型本身具有多样性,不同回归模型得到的κ0的估计可能会有差异。
5. 讨论与结论
本文选取了国内外学者计算得到的对应不同场地条件的546个高频衰减系数κ0,运用最小二乘法进行回归分析,研究了κ0均值与场地平均剪切波速vS30之间的关系,得到了如下主要结论:
1) 运用均值法和滑动平均法对κ0值随平均剪切波速vS30的变化进行了分析,结果表明,虽然κ0具有明显的区域差异性,但随着vS30的增大,呈现出逐渐减小的趋势,且这种变化趋势可以用合适的函数进行模拟;然后采用线性函数、多项式函数、对数线性函数和双对数线性函数对κ0的均方根值进行拟合,通过分析和比较,最终选取对数线性函数作为κ0的拟合模型。
2) 基于筛选得到的477个数据,采用最小二乘法对模型参数进行了拟合,得到了适合于工程应用的κ0-vS30实用模型。对模型的适用性分析表明,本文构建的模型在预测场址地震动参数时能够合理估计地震动的高频衰减。
3) 本文通过对拟合模型的和方差、拟合优度、标准差和残差分析,验证了该模型的可行性。并基于中国台湾地区MTN强震台站的κ0落在模型中的情况检验了κ0-vS30模型的适用性。结果表明,本文构建的模型能够合理估计不同场地条件下的κ0均值,因此,在预测场址地震动参数时,可用本文构建的κ0-vS30模型估计场址的κ0系数,进而近似模拟地震动的高频衰减效应。
需要特别指出的是,虽然在模型的构建中,在数据区域性、场地条件、κ0计算方法以及模型选择及回归模型等方面都存在不确定性,并且数据的离散性较大,但总体来看,κ0随 vS30增大逐渐减小的趋势符合地震动在局部场地的衰减特征,并且在±1倍标准差的范围内,可以大致描述参数的变化特征,从而能够实现κ0的近似估计。
-
![]()
图 1 本文研究采用的κ0值随平均剪切波速 vS30的分布
Figure 1. The distribution of κ0 value used in this study with mean shear wave velocity vS30
![]()
图 5 对数线性函数拟合以及与其它模型对比
Figure 5. Log-linear function fitting and comparison with other models
表 1 本文研究采用的κ0数目、来源及相应的vS分布范围
Table 1 The number and source of κ0 used in this study and the corresponding distribution range of vS
序号 数据个数 vS30/(m·s−1) 地区 数据来源 1 60 106.8—904.2 日本 Cabas等(2017) 2 16 213.2—744.1 日本 Cabas等(2017) 3 50 507.7—1 433.4 日本 van Houtte等(2011) 4 27 1 106.8— 2 394.0 日本 van Houtte等(2011) 5 4 515.7—1 301.3 日本 Laurendeau等(2013) 6 14 170.6—1 428.1 法国 Drouet等(2010) 7 24 192.1—747.1 瑞士 Edwards等(2015) 8 8 1 174.0—1 810.5 瑞士 Edwards等(2011) 9 16 380.1—1 811.5 瑞士 Edwards等(2011) 10 54 160.1—942.8 中国台湾 Huang等(2017) 11 4 233.1—684.8 中国台湾 Lai等(2016) 12 10 167.5—496.4 中国台湾 Lai等(2016) 13 29 191.8—746.9 土耳其 Bora等(2017) 14 16 142.6—1 029.6 意大利 Bora等(2017) 15 5 1 054.7—1 392.5 克罗地亚 Stanko等(2017) 16 4 854.1—953.3 克罗地亚 Stanko等(2017) 17 11 516.6—715.5 中国台湾 van Houtte等(2011) 18 38 299.6—652.9 中国 傅磊和李小军(2017) 19 10 435.7—1 518.3 新西兰 van Houtte等(2018) 20 9 401.0—661.8 亚利桑那 Kishida等(2014) 21 6 550.9—1 000.3 加利福尼亚 van Houtte等(2011) 22 117 170.9—1 531.2 中国台湾 Chang等(2019) 23 7 263.3—660.3 中国 郑旭等(2019) 24 7 531.2—912.1 日本 朱百慧(2016)  下载: 导出CSV
表 2 κ0值在不同 vS30范围的分组统计
Table 2 Group statistics of κ0 values in different vS30 ranges
vS30/(m·s−1) κ0值 数量 最小值 最大值 标准差 均值 100—200 37 0.019 6 0.076 7 0.014 85 0.054 48 200—300 65 0.022 2 0.072 6 0.014 58 0.051 33 300—400 95 0.009 2 0.077 2 0.015 38 0.043 41 400—500 95 0.008 8 0.087 5 0.016 06 0.040 43 500—600 73 0.003 8 0.067 4 0.015 16 0.035 60 600—700 46 0.003 8 0.080 9 0.015 17 0.029 28 700—800 24 0.013 0 0.071 1 0.014 11 0.033 48 800—900 19 0.004 9 0.073 9 0.017 84 0.034 12 900—1000 16 0.014 3 0.052 8 0.010 99 0.027 61 1 000—1 100 7 0.015 3 0.027 0 0.003 93 0.022 73 1 100—1 200 7 0.006 0 0.025 8 0.007 52 0.015 47 1 200—1 300 10 0.013 6 0.026 0 0.004 61 0.019 67 1 300—1 400 6 0.010 1 0.031 5 0.009 06 0.020 13 1 400—1 500 9 0.009 6 0.026 3 0.006 15 0.015 72 1 500—1 800 16 0.006 9 0.027 1 0.006 75 0.016 06 1 800—2 100 11 0.002 9 0.029 3 0.009 36 0.013 71 2 100—2 400 10 0.002 9 0.025 0 0.009 30 0.011 93
下载: 导出CSV
表 3 κrms与 vS30的经验关系
Table 3 The empirical relationship between кrms and vS30
拟合函数 模型参数 a b SSE R2 c 线性函数:κrms=avS30+b −1.557×10⁻⁵ 4.478×10⁻² 3.61×10⁻³ 7.734×10⁻¹ 多项式函数:κrms=${av^2_{{\rm{S}}30}} $+bvS30+c 1.284×10⁻⁸ −4.741×10⁻⁵ 6.559×10⁻⁴ 9.587×10⁻¹ 5.886×10⁻⁵ 对数线性函数:κrms =algvS30+b −3.439×10⁻² 1.286×10⁻¹ 1.466×10⁻³ 9.07 8×10⁻¹ 双对数线性函数:lgκrms=algvS30+b −4.488×10⁻¹ −2.72×10⁻¹ 2.245×10⁻³ 8.587×10⁻¹ 注:表中a,b和c为模型拟合参数,SSE 表示和方差,R2为拟合优度。
下载: 导出CSV
-
傅磊,李小军. 2017. 龙门山地区的kappa(κ0)模型及汶川MS8.0地震的强地震动模拟[J]. 地球物理学报,60(8):2935–2947. doi: 10.6038/cjg20170803 Fu L,Li X J. 2017. The kappa (κ0) model of the Longmenshan region and its application to simulation of strong ground-motion by the Wenchuan MS8.0 earthquake[J]. Chinese Journal of Geophysics,60(8):2935–2947 (in Chinese).
郑旭,胡进军,谢礼立,周少辉,鹿子林. 2019. 基于山东省场地的沂沭断裂带地震动高频消减作用[J]. 哈尔滨工业大学学报,51(12):55–62. doi: 10.11918/j.issn.0367-6234.201901170 Zheng X,Hu J J,Xie L L,Zhou S H,Lu Z L. 2019. High frequency reduction effect of ground motion in Yi-Shu fault zone based on sites of Shandong[J]. Journal of Harbin Institute of Technology,51(12):55–62 (in Chinese).
朱百慧. 2016. 强震数据Kappa值影响因素的讨论[D]. 哈尔滨: 中国地震局工程力学研究所: 39−41. Zhu B H. 2016. Discussion on Influencing Factors of Kappa Value of Strong Earthquake Data[D]. Harbin: Institute of Engineering Mechanics, China Earthquake Administration: 39−41 (in Chinese).
Anderson J G,Hough S E. 1984. A model for the shape of the Fourier amplitude spectrum of acceleration at high frequencies[J]. Bull Seismol Soc Am,74(5):1969–1993.
Anderson J G,Humphrey J R. 1991. A least squares method for objective determination of earthquake source parameters[J]. Seismolo Res Lett,62(3/4):201–209.
Anderson J G,Lee Y,Zeng Y H,Day S. 1996. Control of strong motion by the upper 30 meters[J]. Bull Seismol Soc Am,86(6):1749–1759.
Atkinson G M. 1984. Attenuation of strong ground motion in Canada from a random vibrations approach[J]. Bull Seismol Soc Am,74(6):2629–2653.
Boore D M. 1983. Stochastic simulation of high-frequency ground motions based on seismological models of the radiated spectra[J]. Bull Seismol Soc Am,73(6A):1865–1894.
Boore D M,Thompson E M,Cadet H. 2011. Regional correlations of vS30 and velocities averaged over depths less than and greater than 30 meters[J]. Bull Seismol Soc Am,101(6):3046–3059. doi: 10.1785/0120110071
Bora S S,Cotton F,Scherbaum F,Edwards B,Traversa P. 2017. Stochastic source,path and site attenuation parameters and associated variabilities for shallow crustal European earthquakes[J]. Bull Earthq Eng,15(11):4531–4561. doi: 10.1007/s10518-017-0167-x
Cabas A,Rodriguez-Marek A,Bonilla L F. 2017. Estimation of site-specific kappa (κ0)-consistent damping values at KiK-net sites to assess the discrepancy between laboratory-based damping models and observed attenuation (of seismic waves) in the field[J]. Bull Seismol Soc Am,107(5):2258–2271. doi: 10.1785/0120160370
Castellaro S,Mulargia F,Rossi P L. 2008. VS30:Proxy for seismic amplification?[J]. Seismol Res Lett,79(4):540–543. doi: 10.1785/gssrl.79.4.540
Chandler A M,Lam N T K,Tsang H H. 2006. Near-surface attenuation modelling based on rock shear-wave velocity profile[J]. Soil Dyn Earthq Eng,26(11):1004–1014. doi: 10.1016/j.soildyn.2006.02.010
Chang S C,Wen K L,Huang M W,Kuo C H,Lin C M,Chen C T,Huang J Y. 2019. The high-frequency decay parameter (Kappa) in Taiwan[J]. Pure Appl Geophys,176(11):4861–4879. doi: 10.1007/s00024-019-02219-y
Drouet S,Cotton F,Guéguen P. 2010. VS30,κ,regional attenuation and MW from accelerograms:Application to magnitude 3-5 French earthquakes[J]. Geophys J Int,182(2):880–898. doi: 10.1111/j.1365-246X.2010.04626.x
Edwards B,Fäh D,Giardini D. 2011. Attenuation of seismic shear wave energy in Switzerland[J]. Geophys J Int,185(2):967–984. doi: 10.1111/j.1365-246X.2011.04987.x
Edwards B,Ktenidou O J,Cotton F,Abrahamson N,van Houtte C,Fäh D. 2015. Epistemic uncertainty and limitations of the κ0 model for near-surface attenuation at hard rock sites[J]. Geophys J Int,202(3):1627–1645. doi: 10.1093/gji/ggv222
Hanks T C. 1982. fmax[J]. Bull Seismol Soc Am,72(6A):1867–1879. doi: 10.1785/BSSA07206A1867
Huang M W,Wen K L,Chang S C,Chang C L,Liu S Y,Chen K P. 2017. The high-cut parameter (Kappa) for the near-surface geology in and around the Taipei basin,Taiwan[J]. Bull Seismol Soc Am,107(3):1254–1264. doi: 10.1785/0120160070
Kilb D,Biasi G,Anderson J,Brune J,Peng Z,Vernon F L. 2012. A comparison of spectral parameter kappa from small and moderate earthquakes using southern California ANZA seismic network data[J]. Bull Seismol Soc Am,102(1):284–300. doi: 10.1785/0120100309
Kishida T,Darragh R,Ktenidou O J. 2014. Fourier spectra and kappa (κ0) estimates for rock stations in the NGA-west2 project[J]. Eng Geol,202(4):1–13.
Lai T S,Mittal H,Chao W A,Wu Y M. 2016. A study on kappa value in Taiwan using borehole and surface seismic array[J]. Bull Seismol Soc Am,106(4):1509–1517. doi: 10.1785/0120160004
Laurendeau A,Cotton F,Ktenidou O J,Bonilla L F,Hollender F. 2013. Rock and stiff-soil site amplification:Dependency on vS30 and kappa (κ0)[J]. Bull Seismol Soc Am,103(6):3131–3148. doi: 10.1785/0120130020
Lee V W,Trifunac M D. 2010. Should average shear-wave velocity in the top 30 m of soil be used to describe seismic amplification?[J]. Soil Dyn Earthq Eng,30(11):1250–1258. doi: 10.1016/j.soildyn.2010.05.007
Silva W J, Wong I G, Darragh R B. 1998. Engineering characterization of earthquake strong ground motions in the Pacific Northwest[G]//Assessing Earthquake Hazards and Reducing Risk in the Pacific Northwest. Reston: U. S. Geological Survey: 313−324.
Stanko D,Markušić S,Ivančić I,Mario G,Gülerce Z. 2017. Preliminary estimation of kappa parameter in Croatia[J]. IOP Conf Ser:Earth Environ Sci,95(3):032014.
van Houtte C,Drouet S,Cotton F. 2011. Analysis of the origins of κ (kappa) to compute hard rock to rock adjustment factors for GMPEs[J]. Bull Seismol Soc Am,101(6):2926–2941. doi: 10.1785/0120100345
van Houtte C,Ktenidou O J,Larkin T,Holden C. 2018. A continuous map of near-surface S-wave attenuation in New Zealand[J]. Geophys J Int,213(1):408–425. doi: 10.1093/gji/ggx559
-
期刊类型引用(4)
1. 陶正如,张孟骋昊,赵一鸣,郝俊,肖培. 加速度傅氏谱高频衰减参数kappa(κ)研究进展. 世界地震工程. 2025(02): 42-52 .  百度学术
百度学术
2. 师涵博,张元生. 2022年1月8日青海门源6.9级强地震动模拟研究. 地震工程学报. 2024(03): 680-691 . 百度学术
3. 毛岚,石玉成,卢育霞,刘琨. 2023年甘肃积石山M_S6.2地震随机有限断层三分向地震动模拟. 地震工程学报. 2024(04): 778-790 . 百度学术
4. 毛岚,石玉成,卢育霞,刘琨. 公元734年天水7级地震对麦积山石窟影响的地震动模拟研究. 石窟与土遗址保护研究. 2024(03): 90-101 . 百度学术
其他类型引用(3)


计量
- 文章访问数: 463
- HTML全文浏览量: 207
- PDF下载量: 114
- 被引次数: 7
