

Review on research of ground motion site adjustment coefficient
-
摘要: 回顾总结了近20年国内外关于地震动场地调整系数的主要研究成果,重点分析强震动观测和数值理论方法在考虑场地条件对地震动参数影响方面的效果,总结各类方法的适用性和优缺点,结合国内外相关规范条文对比分析国内外的主要成果,得出我国软土的场地调整系数值小于国际水平,并进一步分析了造成这种差异的原因。最后基于目前国际地震区划工作的发展趋势以及各行业相关规范的新技术需求,对新一代区划图的研究工作进行了展望。Abstract: This paper reviews and summarizes the main research results on the adjustment coefficients of ground motion field at home and abroad over the past 20 years, focusing on the effective means of considering the influence of filed conditions on ground motion parameters through strong ground motion observation and numerical theory methods. It summarizes the applicability along with the pros and cons of various methods, conducts a comparative analysis of the main results at home and abroad by combining relevant codes and provisions, and concludes that the coefficients of soft soil field in China are smaller than the international level. What’s more, the reasons for this difference are further analyzed. Finally, based on the current development trend of international seismic zoning work and the new technical requirements of the relevant codes in various industries, it puts forward prospects for the research work of the new generation of zoning maps.
-
引言
地震动的空间变化对大型桥梁(王君杰等,1995)、大坝(陈厚群,1997)、管线(Ghobarah et al,1996 )等长大结构有很大的影响。对地震动空间变化的研究主要集中在频域内,常用的方法有功率谱密度函数法(Matsushima,1975;冯启民,胡聿贤,1981)和相干函数法。随着大型密集强震观测台阵的建立和大量强震数据的获得,相干函数法得到了很大发展。所有的地震动空间相干函数模型均具有相同的特点,即相干系数的变化趋势随频率f和台站间距d的增大而减小。然而在通过台阵强震记录进行相干系数计算和相干函数模型统计时,采用的频率范围(截止频率fcut)不尽相同,例如:Hao (1989,1993)、Hao等(1989)及Loh和Lin (1990)采用10 Hz;Abrahamson等(1991)考虑的频率范围最大,达到50 Hz;屈铁军等(1996)、刘先明等(2004)和李英民等(2013)均采用12 Hz;Zerva和Harada (1997)采用40 Hz;丁海平等(2004)采用5 Hz;阿布都瓦里斯等(2013)采用20 Hz。由于相干函数的统计回归采用的频段范围不同,即计算相干函数时考虑的最大频率(本文定义为截止频率)不同,势必影响模型参数的统计结果。同时,由较小频段范围得到的统计模型能否应用于更大的频率范围也无明确的答案。为了解答上述问题,本文拟采用台湾SMART-1台阵(Abrahamson et al,1987 )的地震加速度记录,对选取不同截止频率fcut的相干函数计算值进行统计回归,通过比较相干函数模型曲线的差别,得到截止频率fcut对相干函数模型参数的影响程度。
1. 地震波的选取及调整
台湾SMART-1台阵由37个台站组成(图1),中心台站(C00)布设在3个同心环的中心。同心环半径分别为200,1 000和2 000 m,沿每个圆环布设12个间隔大致相等的台站。I01—I12台站位于半径为200 m的内环,M01—M12台站位于半径为1 000 m 的中环,O01—O12台站位于半径为2 000 m 的外环。
本文选取SMART-1台阵的第45号地震记录的NS向水平加速度作为统计数据。该地震发生于1986年11月14日,震级为ML7.0,震中距为79 km,震源深度为7 km。对于中心台站C00的加速度记录(图2),截取的S波时间窗为9—29 s (Oliveira,1985),数据采样间隔为dt=0.01 s,其它台站的加速度时程也取相同的时间窗。为计算不同台站间距d下的相关系数,将C00分别与内圈(I03,I06,I09,I12)、中圈(M03,M06,M09,M12)和外圈(O03,O06,O09,O12)组成4组台站对,则台站间距d分别为200,1 000和2 000 m。
![]() 图 2 第45号地震在台站C00处的NS向加速度时程及S波时间窗Figure 2. Acceleration traces of NS and EW components for the 45th event recorded at station C00 and the S wave time window
图 2 第45号地震在台站C00处的NS向加速度时程及S波时间窗Figure 2. Acceleration traces of NS and EW components for the 45th event recorded at station C00 and the S wave time window2. 计算方法
基于强震台阵的观测资料进行地震动空间变化的研究,常常是根据随机振动理论,采用相干函数进行表述。假定xj(t)和xk(t)为场点j和k的两个时间过程,相干系数计算方法为(Zerva,2009):① 计算xj(t)和xk(t)的傅里叶谱Aj(f)和Ak(f);② 计算自功率谱Sj(f)和Sk(f),
${S_j}\left( f \right) {\text{=}} {A_j}\left( f \right)\,A_j^*\left( f \right) {\text{,}}{S_k}\left( f \right) {\text{=}} {A_k}\left( f \right)A_k^*\left( f \right) {\text{,}}$

(1) 式中Aj*(f)为Aj(f)的复共轭;③ 计算互功率谱Sjk(f),
${S_{jk}}\left( f \right) {\text{=}} A_k\left( f \right)\,A_j^*\left( f \right) {\text{;}}$

(2) This page contains the following errors:
error on line 1 at column 1: Start tag expected, '<' not foundBelow is a rendering of the page up to the first error.
${\gamma _{jk}}{\rm{(}}f{\rm{)}} {\text{=}} \frac{{{{\overline S}_{jk}}{\rm{(}}f{\rm{)}}}}{{\sqrt {{{\overline S}_j}{\rm{(}}f{\rm{)}}{{\overline S}_k}{\rm{(}}f{\rm{)}}} }}{\text{,}}$

(3) 式中,γjk(f)为复数,由于0≤|γjk(f)|≤1,取相干系数绝对值,则
$\left| {{\gamma _{jk}}{\rm{(}}f{\rm{)}}} \right| {\text{=}} \frac{{\left| {{{\overline S}_{jk}}{\rm{(}}f{\rm{)}}} \right|}}{{\sqrt {{{\overline S}_j}{\rm{(}}f{\rm{)}}{{\overline S}_k}{\rm{(}}f{\rm{)}}} }}.$

(4) |γjk(f)|被称为迟滞相干系数,大多数情况下所讨论的均为迟滞相干系数,并把迟滞相干系数称为相干系数。
根据密集台阵的地震记录,国内外的研究人员提出了很多相干函数模型(Harichandran, Vanmarcke,1986;Hao,1989,1993;Loh,Lin,1990;Abrahamson et al,1991 ),本文采用其中的两种相干函数模型,并对模型参数进行拟合。两种相关函数模型为
1) Abrahamson等(1991)相干函数模型
${\tanh^{-1}}\left| {\gamma \left( {f,d} \right)} \right| {\text{=}} \left( {a_1 {\text{-}} a_2d} \right)\left\{ {\left. {\exp \left[ {\left( {b_1 {\text{+}} b_2d} \right)f} \right] {\text{+}} {\frac{1}{3f^c}}} \right\} {\text{+}} n} \right.{\text{,}}$

(5) 2) Loh和Lin (1990)相干函数模型
$\left| {\gamma \left( {\omega ,d} \right)} \right| {\text{=}} \exp \left[ {\left( { {\text{-}} a {\text{-}} b{\omega ^2}} \right)d} \right]{\text{,}}$

(6) 式中,f为频率,ω为圆频率,d为台站间距,其它变量为拟合参数。
为了研究截止频率fcut的选取对地震动空间相干函数统计模型参数的影响,本文计算了4组地震对在台站间距d=200,1 000和2 000 m,截止频率fcut=8,16和24 Hz,9种工况下的相干系数,之后采用式(5)和(6)的相干函数模型,对上述计算得到的相干系数进行拟合,之后根据拟合参数,得到不同台站间距d和截止频率fcut的拟合曲线。
3. 计算结果
根据SMART-1台阵记录的第45号地震南北分量加速度记录的S波时间窗,计算不同台站对的相干系数|γ(d,f)|,并对相干系数进行拟合,得到如下结果:① 台站间距d=200 m的4个台站对C00-I03,C00-I06,C00-I09和C00-I12在截止频率fcut=8,16,24 Hz时的相干系数分别为图3a,b,c中所示的细实线;② 台站间距d=1 000 m的上述4个台站对在截止频率fcut=8,16,24 Hz时的相干系数分别为图4a,b,c中所示的细实线;③ 台站间距d=2 000 m的上述4个台站对在截止频率fcut=8,16,24 Hz时的相干系数分别为图5a,b,c中所示的细实线。
![]() 图 5 台站间距d=2 000 m,截止频率fcut为8 Hz (a),16 Hz (b) 和24 Hz (c) 时的相干系数 |γ| (细实线)及其根据Abrahamson相干函数模型(黑粗线)和Loh相干函数模型(红粗线)拟合所得的拟合曲线Figure 5. Lagged coherencies |γ| at station spacing d=2 000 m (thin solid line) and the corresponding fitting curves based on Abrahamson (black rough line) and Loh (red rough line) coherence function model which obtained with different cut-off frequency values of 8 Hz (a),16 Hz (b) and 24 Hz (c)
图 5 台站间距d=2 000 m,截止频率fcut为8 Hz (a),16 Hz (b) 和24 Hz (c) 时的相干系数 |γ| (细实线)及其根据Abrahamson相干函数模型(黑粗线)和Loh相干函数模型(红粗线)拟合所得的拟合曲线Figure 5. Lagged coherencies |γ| at station spacing d=2 000 m (thin solid line) and the corresponding fitting curves based on Abrahamson (black rough line) and Loh (red rough line) coherence function model which obtained with different cut-off frequency values of 8 Hz (a),16 Hz (b) and 24 Hz (c)![]() 图 3 台站间距d=200 m,截止频率fcut为8 Hz (a),16 Hz (b) 和24 Hz (c)时的相干系数 |γ| (细实线)及其根据Abrahamson相干函数模型(黑粗线)和Loh相干函数模型(红粗线) 拟合所得的拟合曲线Figure 3. Lagged coherencies |γ| at station spacing d=200 m (thin solid line) and the corresponding fitting curves based on Abrahamson (black rough line) and Loh (red rough line) coherence function model which obtained with different cut-off frequency values of 8 Hz (a),16 Hz (b) and 24 Hz (c)
图 3 台站间距d=200 m,截止频率fcut为8 Hz (a),16 Hz (b) 和24 Hz (c)时的相干系数 |γ| (细实线)及其根据Abrahamson相干函数模型(黑粗线)和Loh相干函数模型(红粗线) 拟合所得的拟合曲线Figure 3. Lagged coherencies |γ| at station spacing d=200 m (thin solid line) and the corresponding fitting curves based on Abrahamson (black rough line) and Loh (red rough line) coherence function model which obtained with different cut-off frequency values of 8 Hz (a),16 Hz (b) and 24 Hz (c)![]() 图 4 台站间距d=1 000 m,截止频率fcut为8 Hz (a),16 Hz (b) 和24 Hz (c) 时的相干系数 |γ| (细实线)及其根据Abrahamson相干函数模型(黑粗线)和Loh相干函数模型(红粗线)拟合所得的拟合曲线Figure 4. Lagged coherencies |γ| at station spacing d=1 000 m (thin solid line) and the corresponding fitting curves based on Abrahamson (black rough line) and Loh (red rough line) coherence function model which obtained with different cut-off frequency values of 8 Hz (a),16 Hz (b) and 24 Hz (c)
图 4 台站间距d=1 000 m,截止频率fcut为8 Hz (a),16 Hz (b) 和24 Hz (c) 时的相干系数 |γ| (细实线)及其根据Abrahamson相干函数模型(黑粗线)和Loh相干函数模型(红粗线)拟合所得的拟合曲线Figure 4. Lagged coherencies |γ| at station spacing d=1 000 m (thin solid line) and the corresponding fitting curves based on Abrahamson (black rough line) and Loh (red rough line) coherence function model which obtained with different cut-off frequency values of 8 Hz (a),16 Hz (b) and 24 Hz (c)对上述9种工况的相干系数分别按Abrahamson模型和Loh模型进行曲线拟合,每个模型均可得到9组模型拟合参数,具体参数值列于表1和表2。根据对应的拟合参数计算得到的相干系数曲线在对应图中以粗实线进行展示。
表 2 基于Loh相干函数模型得到的拟合参数Table 2. Fitting parameters based on Loh coherence function model台站间距
d/m截止频率
fcut/Hz系数 a b 200 8 0.32 1.95×10⁻³ 16 1.57 4.57×10⁻³ 24 2.43 1.01×10⁻⁴ 1 000 8 0.53 6.73×10⁻⁴ 16 0.84 1.44×10⁻⁴ 24 1.10 2.27×10⁻⁵ 2 000 8 0.52 1.10×10⁻⁴ 16 0.61 4.46×10⁻⁶ 24 0.61 2.18×10⁻⁶ 表 1 基于Abrahamson相干函数模型得到的拟合参数Table 1. Fitting parameters based on Abrahamson coherence function model台站间距
d/m截止频率
fcut/Hz系数 a1 a2 b1 b2 c n 200 8 −0.65 0.013 2.31 −1.34×10⁻² −1.604 0.33 16 2.36 1.17×10⁻³ 1.29 −9.39×10⁻³ −1.148 0.39 24 −0.16 9.74×10⁻³ −0.24 −1.71×10⁻³ −0.587 0.36 1 000 8 0.95 −2.70×10⁻⁴ 0.62 1.16×10⁻³ −0.942 0.19 16 1.05 −3.76×10⁻⁴ −0.54 6.04×10⁻⁶ −0.988 0.20 24 0.62 −1.62×10⁻⁵ 0.59 1.20×10⁻³ −1.778 0.27 2 000 8 −0.91 5.78×10⁻⁴ −0.02 −2.31×10⁻⁵ −1.570 0.10 16 1.06 −4.96×10⁻⁴ −3.10 1.53×10⁻³ −3.970 0.24 24 2.66 −1.27×10⁻³ −0.052 2.23×10⁻⁵ −3.203 0.18 ![]() 图 6 根据不同截止频率fcut所得的拟合参数计算得到的台站间距d=200 m (a),1 000 m (b) 和2 000 m (c) 时的相干系数|γ|左侧对应于Abr相干函数模型的结果,右侧对应于Loh相干函数模型的结果Figure 6. Coherencies at separation distance d=200 m (a),1 000 m (b),2 000 m (c) based on fitting parameters which obtained from different cut-off frequency valuesThe graphs on the left correspond to the result of the Abrahamson,and the graphs on the right correspond to the result of the Loh
图 6 根据不同截止频率fcut所得的拟合参数计算得到的台站间距d=200 m (a),1 000 m (b) 和2 000 m (c) 时的相干系数|γ|左侧对应于Abr相干函数模型的结果,右侧对应于Loh相干函数模型的结果Figure 6. Coherencies at separation distance d=200 m (a),1 000 m (b),2 000 m (c) based on fitting parameters which obtained from different cut-off frequency valuesThe graphs on the left correspond to the result of the Abrahamson,and the graphs on the right correspond to the result of the Loh事实上,根据某一台站间距d和截止频率fcut得到的拟合参数,均可以计算其它8种工况的相干系数。例如以Loh模型为例,对应工况d=200 m,截止频率fcut=8 Hz时的相干函数模型拟合参数为a=0.32,b=1.95×10⁻³ (表2),根据式(6),即可计算出任意台站间距d和频率f下的相干系数;同样,根据截止频率fcut=16 Hz和fcut=24 Hz得到的相干函数模型拟合参数,也可以计算出任意台站间距d和频率f下的相干系数。为了方便对比,下文在根据拟合参数计算相干系数时,考虑的频率范围均为0—24 Hz,计算结果如图6所示。
采用Abrahamson相干函数模型在不同截止频率下的拟合参数计算相干系数时,可以得到:① d=200和1 000 m,频率f<8 Hz的相干系数基本相等;② 频率f>8 Hz的相干系数,由截止频率fcut=16和24 Hz的拟合参数得到的相干系数基本相等,而由截止频率fcut=8 Hz的拟合参数得到的相干系数与二者的结果相差较大;③ 无论是哪种情况,当f>8 Hz时,得到的相干系数衰减很慢,特别是由截止频率fcut=16和24 Hz的拟合参数得到的相干系数几乎无衰减。
采用Loh相干函数模型在不同截止频率下的拟合参数计算相干系数时,除了d=2 000 m,频率f<8 Hz时的相干系数相对差别比较小外,其它工况下的结果差别都很大。特别是根据截止频率fcut=8 Hz的拟合参数计算得到的f>8 Hz的相干系数,随着频率的增大,衰减非常快。
事实上,当频率达到一定大小后,即达到截止频率fcut,大于截止频率的高频部分,由于影响相干函数变化的因素很多,高频的相关性减小,随机性增大,这时长大结构的抗震分析再考虑空间变化就没有意义了。因此,考虑地震动的空间变化,需要确定一个“截止频率”,但若截止频率较大,将会对低频的相干系数有较大影响,即降低了低频的相干系数值,从而减弱了地震动低频段的相关性。表3给出了根据不同截止频率拟合所得相干系数在0—8 Hz频段内的变化,以Loh相干函数模型,台站间距d=200 m为例,若fcut=8 Hz,则0—8 Hz频段内相干系数为0.93—0.33,若fcut=24 Hz,则0—8 Hz频段内的相干系数为0.61—0.58,相关性大大降低。
表 3 根据不同截止频率fcut拟合得到的相干系数在0—8 Hz频段内的变化Table 3. Changes of the lagged coherencies obtained with different fcut in the 0—8 Hz frequency band台站间距
d/m0—8 Hz内的相干系数 Abr相干函数模型 Loh相干函数模型 fcut=8 Hz fcut=16 Hz fcut=24 Hz fcut=8 Hz fcut=16 Hz fcut=24 Hz 200 0.99—0.39 0.99—0.45 0.99—0.47 0.93—0.33 0.73—0.58 0.61—0.58 1 000 0.78—0.22 0.78—0.23 0.79—0.24 0.58—0.11 0.43—0.29 0.33—0.31 2 000 0.62—0.24 0.60—0.28 0.60—0.28 0.35—0.20 0.29—0.28 0.30—0.29 另外,从Abrahamson模型和Loh模型拟合结果的比较(图6)中可以看出,两个模型的差别还是很大的,这不在本文的研究范围,暂不讨论。
4. 讨论与结论
本文利用SMRAT-1台阵记录的第45号地震的南北分量加速度,采用Abrahamson相干函数模型和Loh相干函数模型,对不同截止频率fcut (8,16,24 Hz)范围内的相干系数进行曲线拟合,得到了相应的拟合参数,并根据各组拟合参数计算了台站间距d=200,1 000,2 000 m的相干系数|γ(d,f)|。比较由不同截止频率fcut的拟合参数计算得到的拟合曲线后发现:① 截止频率fcut取值的不同对拟合结果影响很大;② 根据较小的fcut得到的拟合参数计算出的相干系数随频率衰减很快,反之,根据较大的fcut得到的拟合参数计算出的相干系数随频率衰减较慢;③ 根据实际加速度记录的计算结果可以看出,高频相干系数的变化不明显,这可能是造成②中结果的原因;④ 若fcut较大,将会对低频的相干系数产生较大影响。
综上,本文认为,由于不同频率范围的相干特性差异较大,因此采用简单经验函数拟合得到的模型参数存在较大差异。当采用某一截止频率fcut得到相干系数拟合参数后,不建议用其计算超出fcut范围的相干系数,否则会产生很大的误差。当采用已有的相干函数模型进行多点地震动合成时,一定要注意该模型的频段范围。众多的相干函数模型采用的fcut之所以不一致,估计部分研究人员也发现是由fcut的影响所致,但并无文献提及这一问题。至于如何确定fcut,还需作进一步的研究。
-
![]()
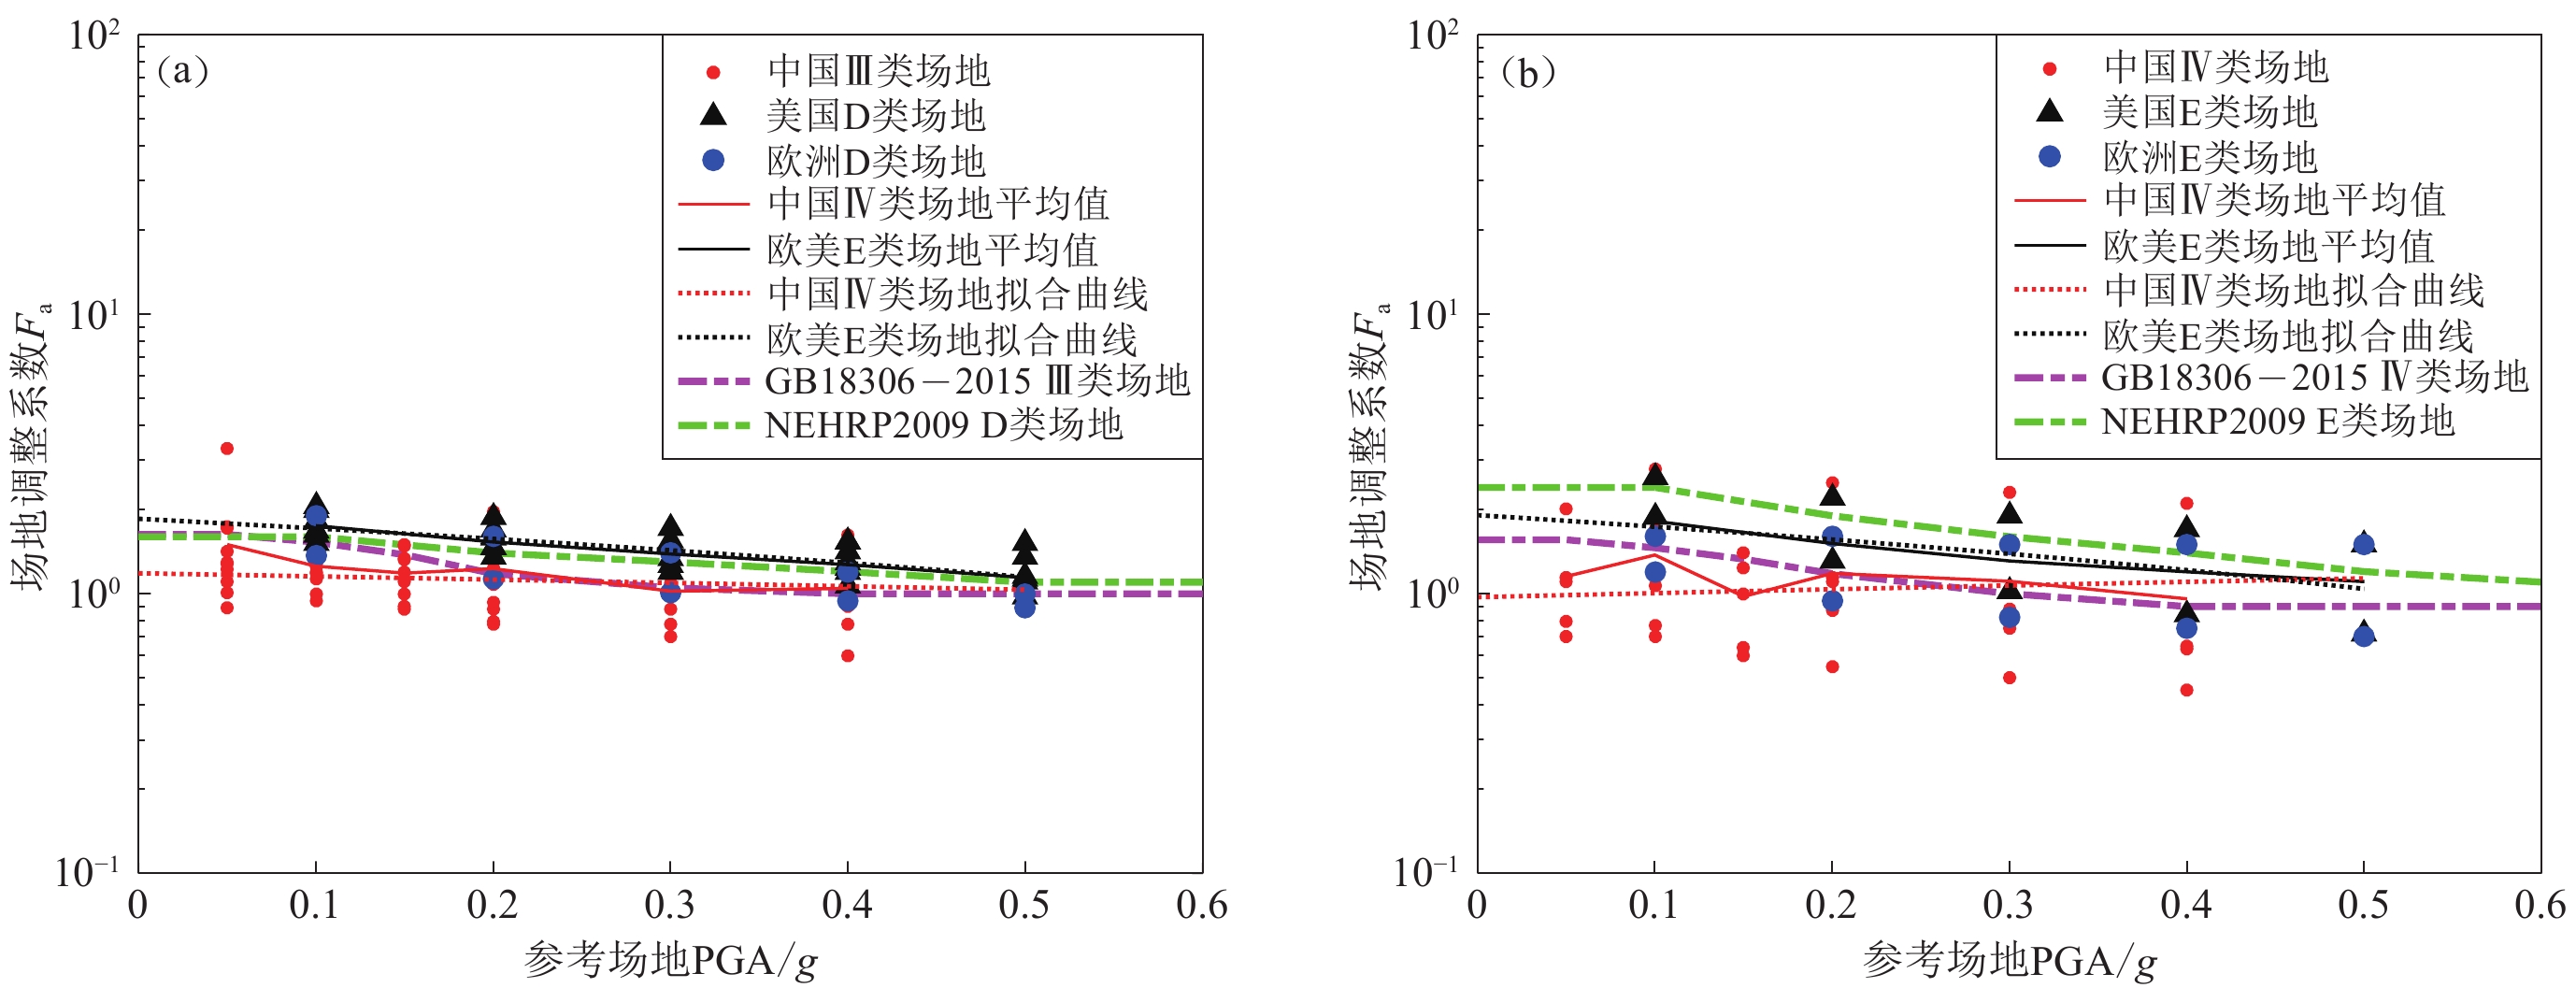
图 5 中国与欧美主要研究成果对比
(a) Ⅲ类场地或D类场地;(b) Ⅳ类场地或E类场地
Figure 5. Comparison of major achievements between China and Europe and America
(a) Site class Ⅲ or D;(b) Site class Ⅳ or E
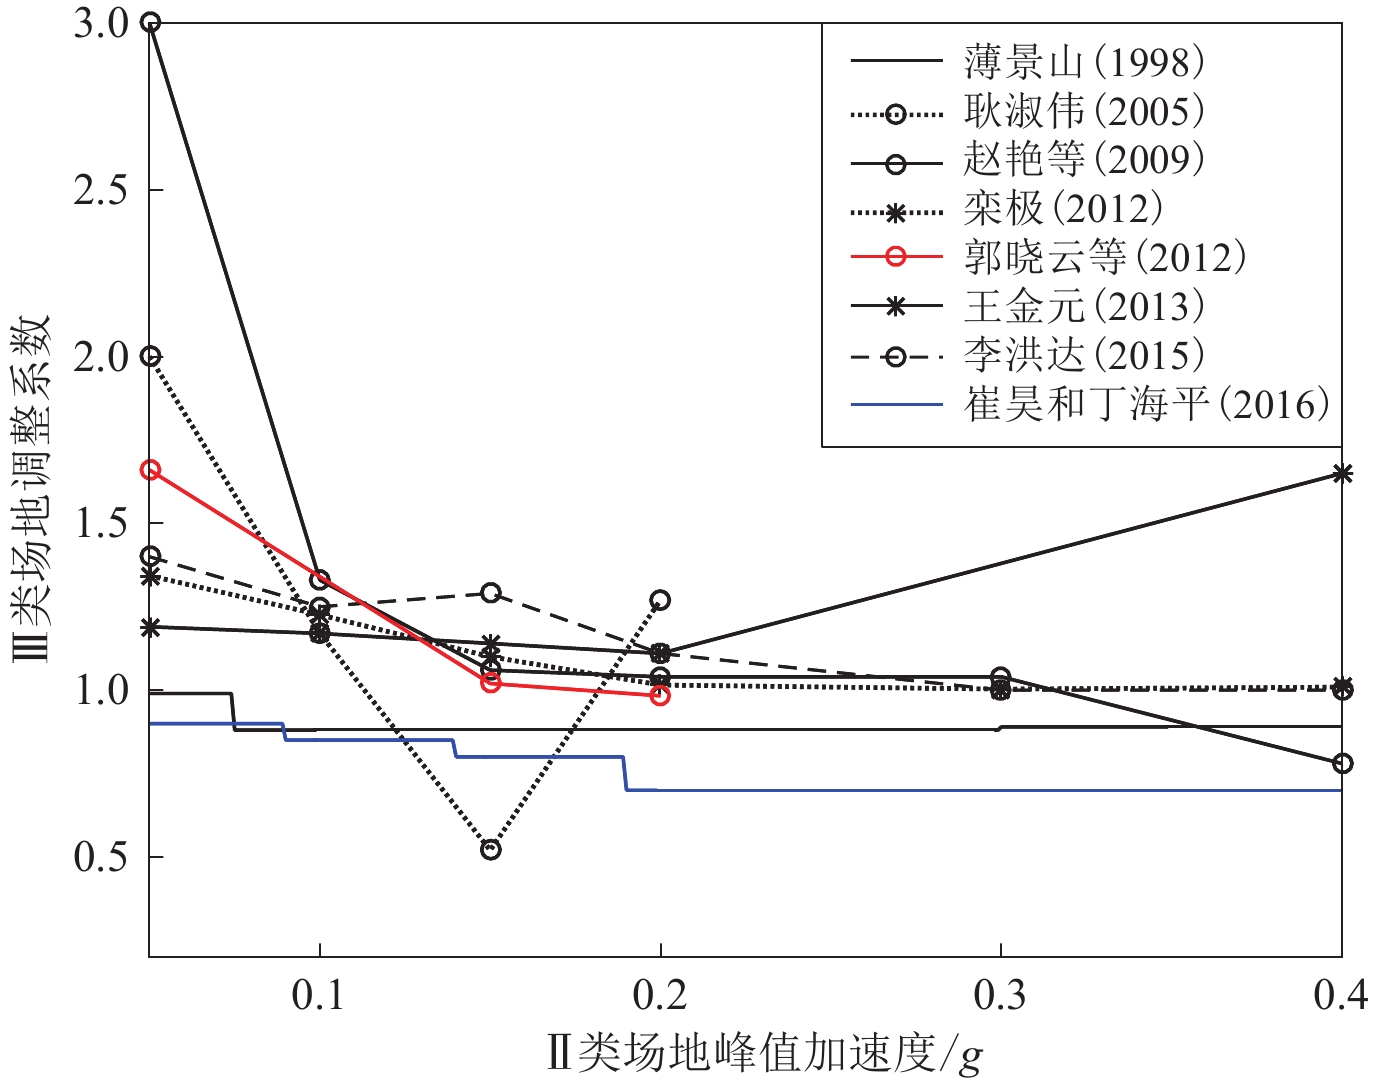
![]()
图 1 不同研究人员基于统计方法给出的我国Ⅲ类场地的调整系数结果对比
Figure 1. Comparison of adjustment coefficient results of class Ⅲ sites in China by different scholars based on statistical methods
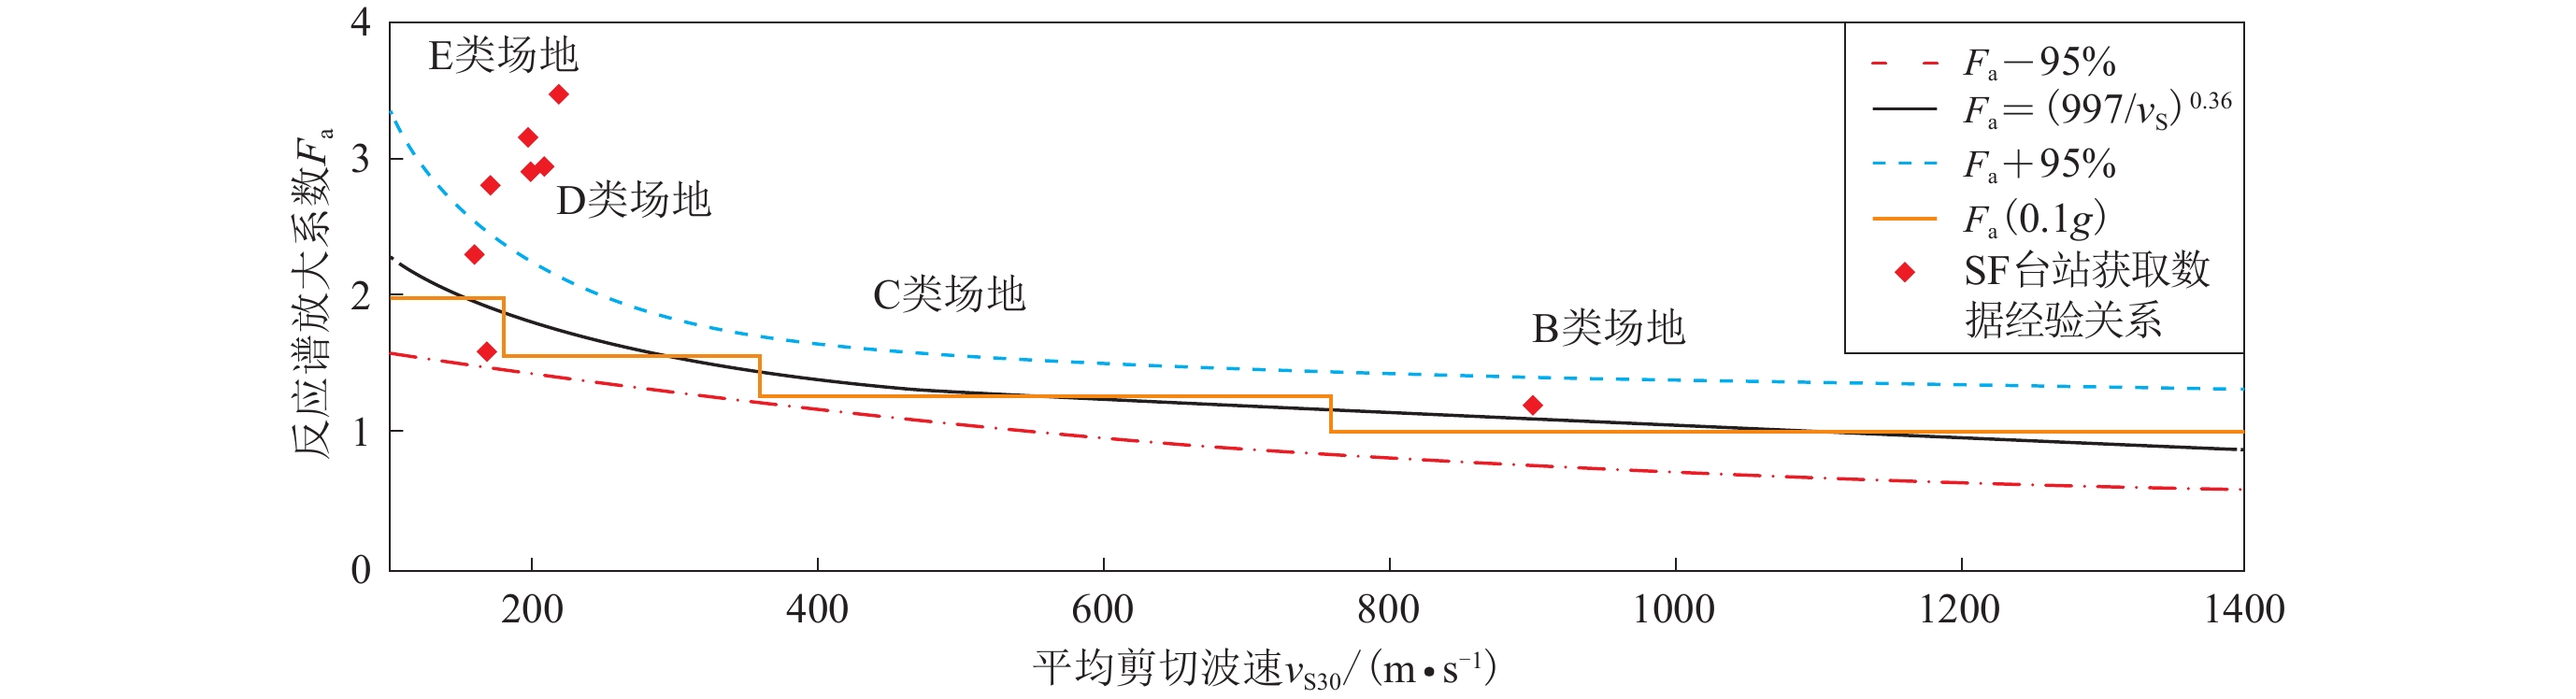
![]()
图 2 利用洛马・普雷塔强震记录基于美国规范预测的各类场地的场地调整系数(Borcherdt et al,2005)
Figure 2. Predicted site adjustment coefficients from Loma Prieta strong earthquake records based on US code (Borcherdt et al,2005)
![]()
图 3 基岩场地与软土场地(E类)加速度关系(Idriss,1990,1991)
Figure 3. Acceleration relationship between bedrock site and soft soil site (class E) (Idriss,1990,1991)
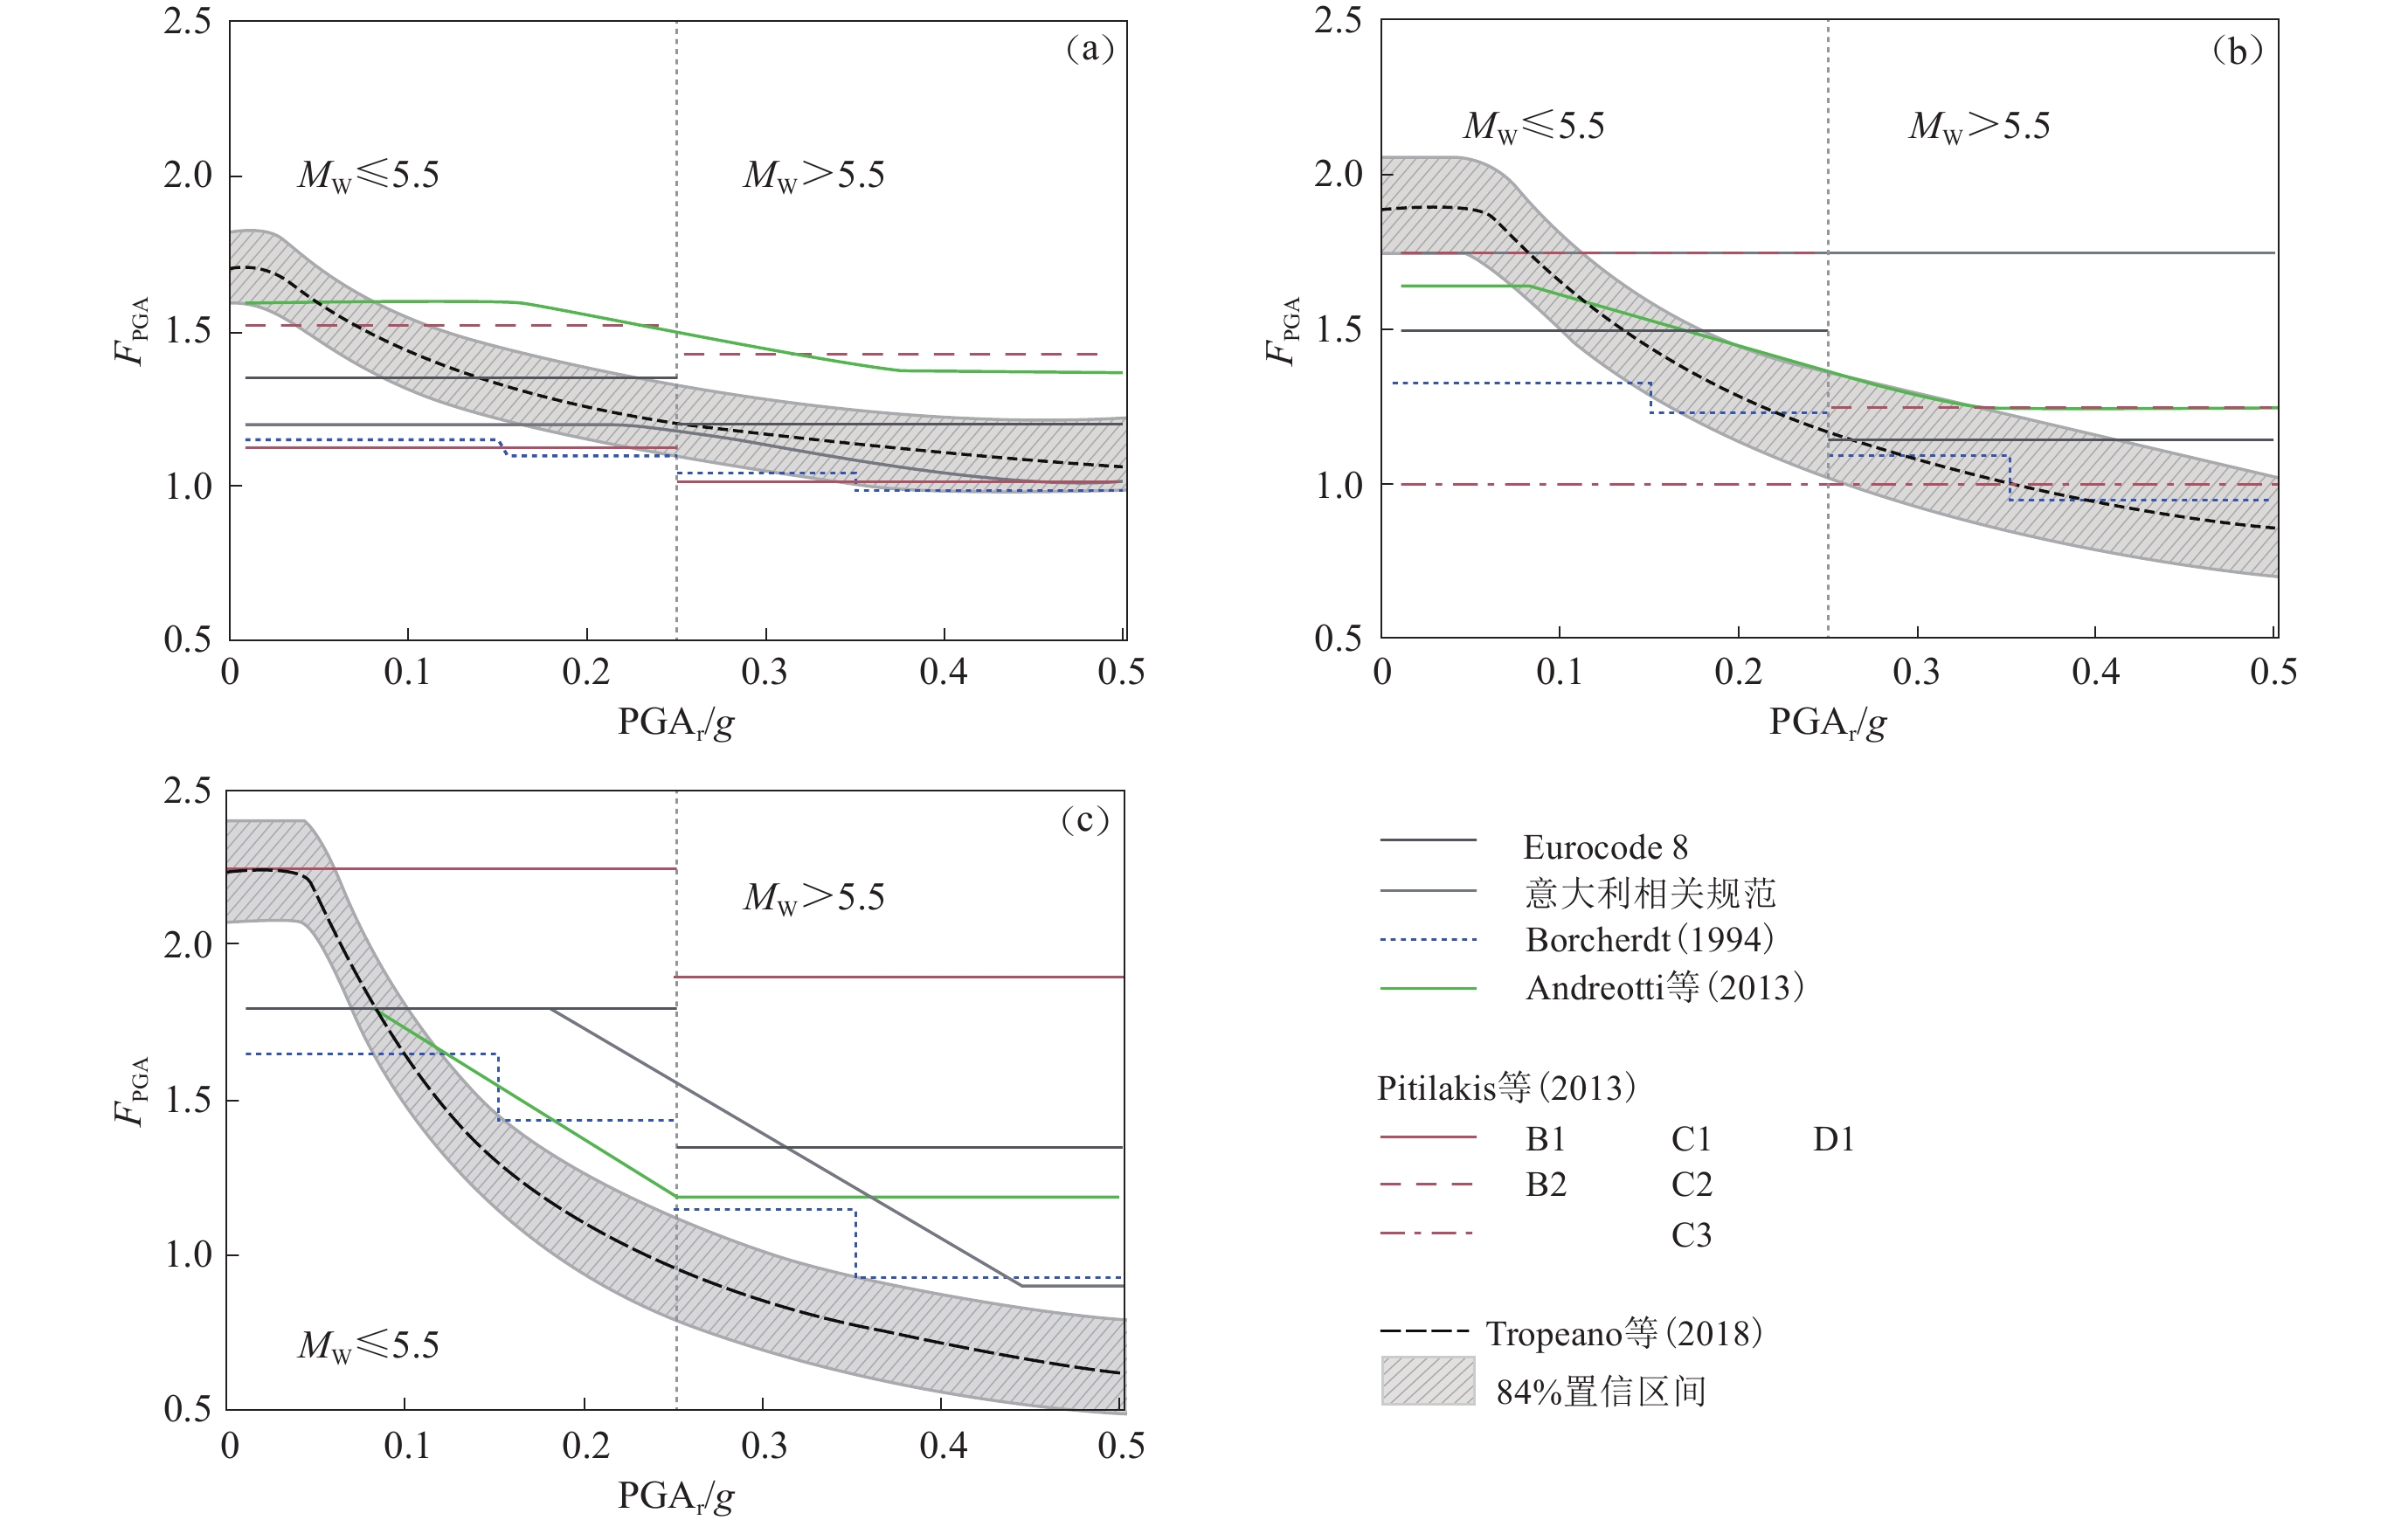
![]()
图 4 建议的场地放大系数FPGA与欧洲规范及其它研究成果的对比(Tropeano et al,2018)
(a) B类场地;(b) C类场地;(c) D类场地
Figure 4. Comparison of the proposed site amplification coefficients FPGA with European code and other research achievements (Tropeano et al,2018)
(a) Site class B;(b) Site class C;(c) Site class D
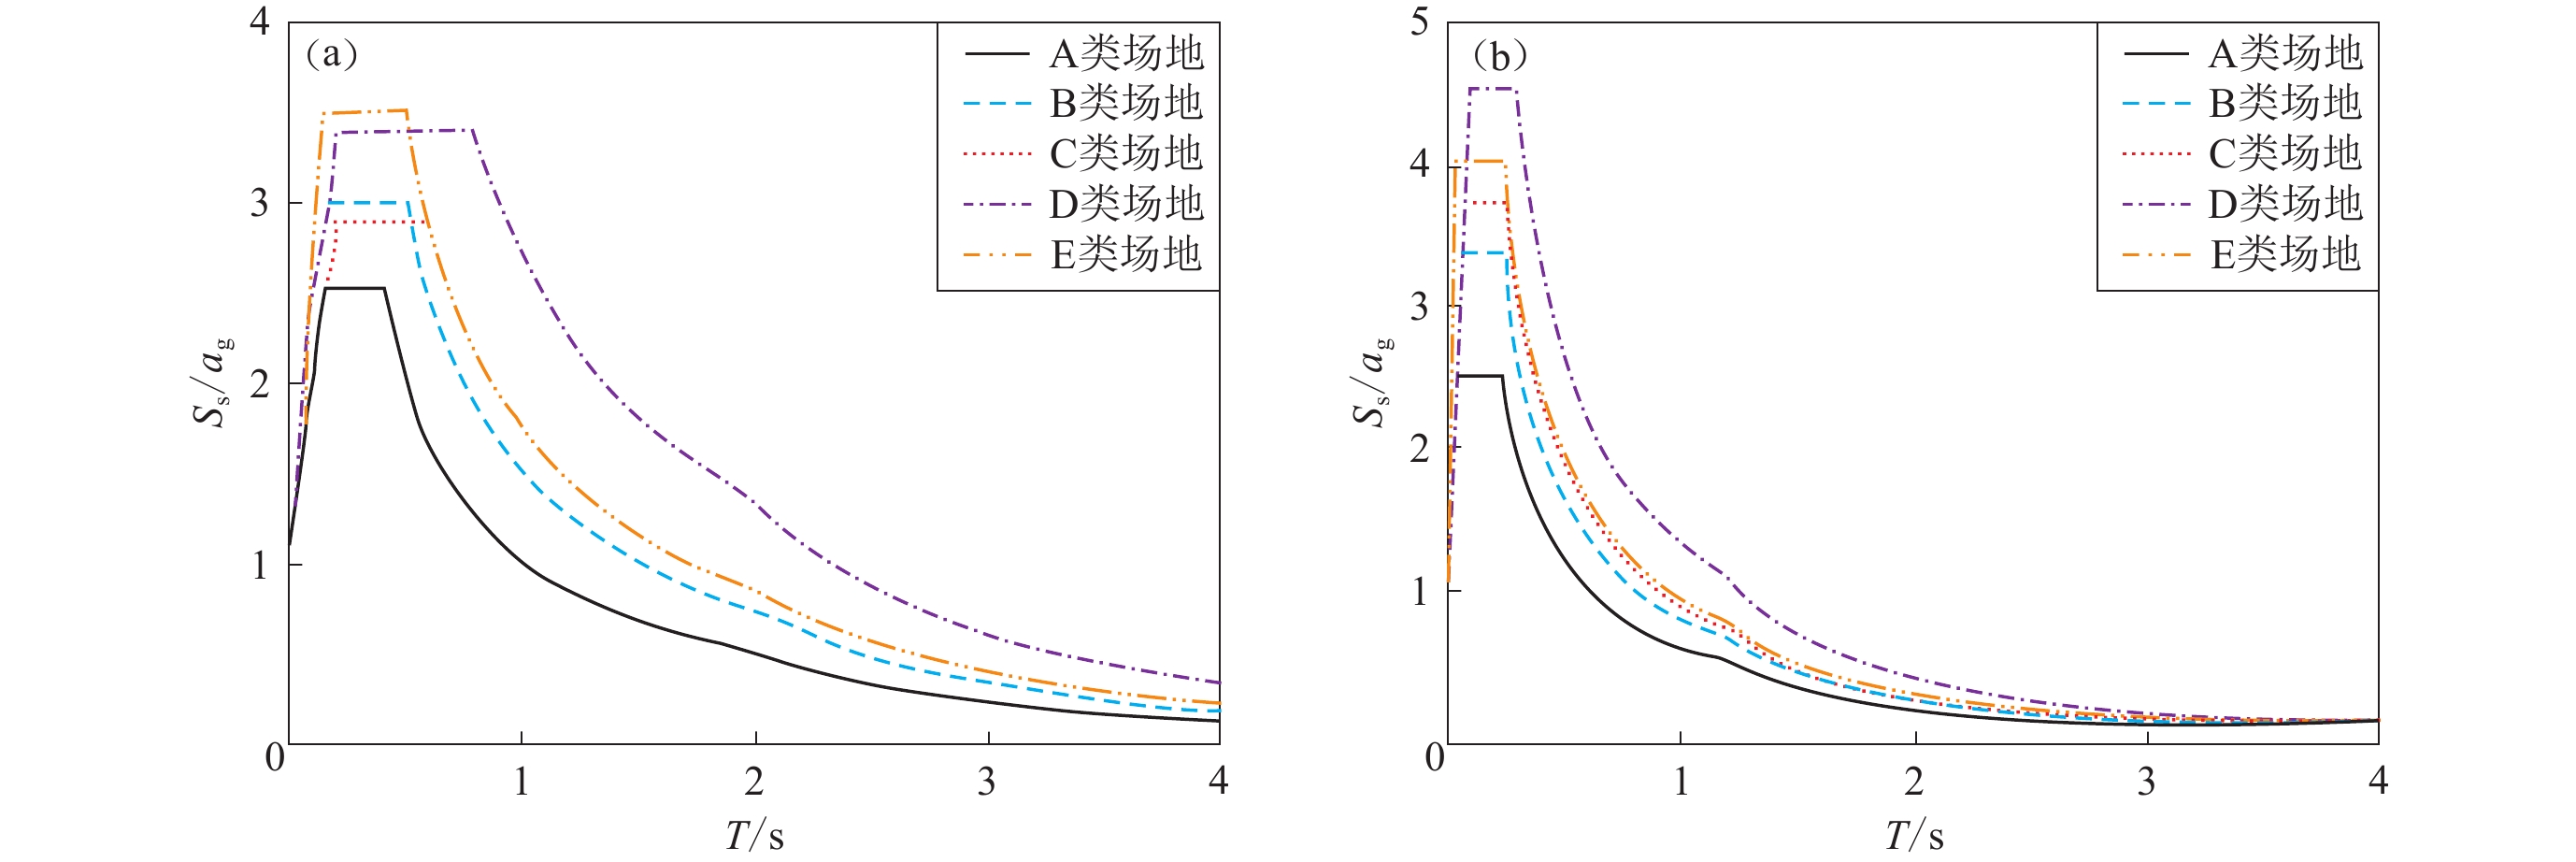
![]()
图 6 Eurocode 8推荐的不同类别场地的弹性反应谱(Ss为场地反应谱,ag为基岩加速度)
Figure 6. Recommended elastic response spectra for different types of sites in Eurocode 8 (Ss is site response spectrum,ag is ground acceleration)
(a) M>5.5;(b) M≤5.5
![]()
图 7 中国现行规范与美国、欧洲规范建议的 软弱土层场地调整系数对比
Figure 7. Comparison of site adjustment coefficient for soft soil layer suggested by current Chinese codes and American and European codes
表 1 不同研究基于数值模拟方法给出的场地调整系数建议值
Table 1 Proposed values of site coefficients given by different researches based on numerical simulation methods
场地类别 不同地震动峰值下的场地系数 来源 0.05g 0.1g 0.15g 0.2g 0.3g 0.4g Ⅰ 1.00 1.00 1.00 1.00 1.00 1.00 李小军和彭清(2001) 1.00 1.00 1.00 1.00 1.00 1.00 吕悦军等(2008) Ⅱ 1.50 1.45 1.40 1.33 1.25 1.18 李小军和彭清(2001) 1.27 1.25 1.23 1.20 1.16 1.11 吕悦军等(2008) Ⅲ 1.10 1.00 0.90 0.80 0.70 0.60 李小军和彭清(2001) 1.22 1.18 1.13 1.08 0.99 0.90 吕悦军等(2008) Ⅳ 0.80 0.70 0.60 0.55 0.50 0.45 李小军和彭清(2001) 1.14 1.07 1.00 0.93 0.75 0.65 吕悦军等(2008)  下载: 导出CSV
表 2 2021年欧洲规范草案建议的场地放大因子(Paolucci et al,2021)
Table 2 Site amplification coefficients proposed in the 2021 European draft code (Paolucci et al,2021)
场地
分类Fα Fβ H800和vS, H相关值 默认值 H800和vS, H相关值 默认值 A 1.0 1.0 1.0 1.0 B ${\left(\dfrac{ {v}_{ {\rm{S} }, H} }{800}\right)}^ {-0.40{r}_{\alpha } }$ $1.3{\text{×} } ( 1-0.1{S}_{ \alpha , RP}/g ) $ ${\left(\dfrac{ {v}_{ {\rm{S} }, H} }{800}\right)}^ {-0.70{r}_{\beta } }$ $1.6{\text{×} } ( 1-0.2{S}_{ \beta , RP}/g ) $ C $1.6{\text{×} } ( 1-0.2{S}_{ \alpha , RP}/g ) $ $2.3{\text{×} } ( 1-0.3{S}_{ \beta , RP}/g ) $ D $1.8{\text{×} } ( 1-0.3{S}_{ \alpha , RP}/g ) $ $3.2{\text{×} } ( 1-{S}_{ \beta , RP}/g ) $ E ${\left(\dfrac{ {v}_{ {\rm{S} }, H} }{800}\right)}^ {-0.40{r}_{\alpha }\frac{H}{30}\left(4-\frac{H}{10}\right)}$ $2.2{\text{×} } ( 1-0.5{S}_{ \alpha , RP}/g ) $ ${\left(\dfrac{ {v}_{ {\rm{S} }, H} }{800}\right)}^ {-0.70{r}_{\beta }\frac{H}{30} }$ $3.2{\text{×} } ( 1-{S}_{ \beta , RP}/g ) $ F $0.9{\left(\dfrac{ {v}_{ {\rm{S} }, H} }{800}\right)}^ {-0.40{r}_{\alpha } }$ $1.7{\text{×} } ( 1-0.3{S}_{ \alpha , RP}/g ) $ $1.25{\left(\dfrac{ {v}_{ {\rm{S} }, H} }{800}\right)}^{-0.70{r}_{\beta } }$ $4.0{\text{×} } ( 1-{S}_{ \beta , RP}/g ) $ 注:${r}_{\alpha }=1-\dfrac{ {S}_{ \alpha , RP}/g}{ {v}_{{\rm{S}}, H}/150}$;$ {r}_{\beta }=1-\dfrac{ {S}_{ \beta , RP}/g}{ {v}_{{\rm{S}}, H}/150}$;α和β分别为地震活动性条件高和低;H为覆盖层厚度;S为反应谱;RP为相关性反应谱。
下载: 导出CSV
表 3 中国不同类别场地调整系数主要研究成果
Table 3 Main research achievements of adjustment coefficients for different types of sites in China
场地类别 不同地震动锋值加速度下的场地调整系数 来源 0.05g 0.1g 0.15g 0.2g 0.3g 0.4g Ⅰ 0.98 0.93 1.00 1.00 1.00 0.90 薄景山(1998) 1.00 1.00 1.00 1.00 1.00 1.00 李小军和彭青(2001) 1.00 1.00 1.00 1.00 1.00 1.00 吕悦军等(2008) 1.00 1.00 1.00 1.00 郭锋等(2011) 0.77 0.96 0.82 0.70 0.87 栾极(2012) 0.50 0.64 0.69 0.50 0.51 郭晓云等(2012) 1.33 0.87 0.86 0.80 1.02 王金元(2013) 1.00 1.00 1.00 1.00 史大成(2013) 0.99 0.88 0.86 0.78 0.92 0.94 李洪达(2015) 0.70 0.75 0.80 0.90 0.90 0.90 崔昊和丁海平(2016) 0.58 0.61 0.70 0.60 0.60 0.63 丁海平和王康(2022) Ⅱ 1.00 1.00 1.00 1.00 1.00 1.00 薄景山(1998) 1.50 1.45 1.40 1.33 1.25 1.18 李小军和彭青(2001) 1.27 1.25 1.23 1.20 1.16 1.11 吕悦军等(2008) 1.80 1.63 1.57 1.46 郭锋等(2011) 1.00 1.00 1.00 1.00 1.00 1.00 栾极(2012) 1.00 1.00 1.00 1.00 1.00 1.00 郭晓云等(2012) 1.00 1.00 1.00 1.00 1.00 王金元(2013) 1.60 1.30 1.20 1.20 史大成(2013) 1.00 1.00 1.00 1.00 1.00 1.00 李洪达(2015) 1.00 1.00 1.00 1.00 1.00 1.00 崔昊和丁海平(2016) 1.00 1.00 1.00 1.00 1.00 1.00 丁海平和王康(2022) Ⅲ 0.99 0.88 0.88 0.88 0.88 0.89 薄景山(1998) 1.10 1.00 0.90 0.80 0.70 0.60 李小军和彭青(2001) 1.22 1.18 1.13 1.08 0.99 0.90 吕悦军等(2008) 1.29 1.25 1.20 1.24 郭锋等(2011) 1.34 1.23 1.10 1.02 1.00 1.01 栾极(2012) 1.66 1.02 0.98 郭晓云等(2012) 1.19 1.17 1.14 1.11 1.65 王金元(2013) 1.80 1.60 1.40 1.30 史大成(2013) 1.40 1.25 1.29 1.11 1.00 1.00 李洪达(2015) 0.90 0.85 0.80 0.70 0.70 0.70 崔昊和丁海平(2016) 1.00 0.73 0.77 0.56 0.71 0.73 丁海平和王康(2022) Ⅳ 0.80 0.70 0.60 0.55 0.50 0.45 李小军和彭青(2001) 1.14 1.07 1.00 0.93 0.75 0.65 吕悦军等(2008) 1.10 1.21 1.24 1.11 郭锋等(2011) 2.80 2.50 2.30 2.10 史大成(2013) 2.00 1.50 1.21 0.89 李洪达(2015) 0.41 0.47 0.45 0.52 0.53 0.40 丁海平和王康(2022)
下载: 导出CSV
表 4 美国及欧洲不同类别场地调整系数主要研究成果
Table 4 Main research achievements of the adjustment coefficient of different types of sites in America and Europe
场地类别 地区 不同地震动峰值加速度下的场地调整系数 来源 ≤0.1g 0.2g 0.3g 0.4g ≥0.5g Fa Fv Fa Fv Fa Fv Fa Fv Fa Fv C 美国 1.40 1.40 1.40 1.40 1.40 1.40 1.40 1.40 1.40 1.40 Hwang等(1997) 美国 1.46 1.32 1.31 1.28 1.23 1.25 1.17 1.24 Rodriguez-Marek等(1999) 美国 1.23 1.80 1.16 1.80 1.10 1.80 1.04 1.80 0.99 1.80 Joyner和Boore (2000) 美国 1.62 1.96 1.54 1.86 1.46 1.76 1.38 1.66 1.29 1.56 Borcherdt (2002) 美国 1.31 1.80 1.23 1.75 1.19 1.74 1.16 1.72 1.14 1.70 Stewart等(2003) 美国 1.36 1.62 1.29 1.56 1.24 1.54 1.22 1.52 1.20 1.51 Choi和Stewart (2005) 欧洲 1.21 1.39 1.17 1.34 1.14 1.32 1.12 1.31 1.10 Sandikkaya等(2013) 美国 1.37 1.57 1.33 1.56 1.31 1.56 1.29 1.55 1.27 1.48 Borcherdt (2014) D 美国 2.00 2.60 1.70 2.60 1.50 2.70 1.30 2.80 1.10 2.80 Hwang等(1997) 美国 1.81 2.04 1.61 1.94 1.50 1.89 1.42 1.85 Rodriguez-Marek等(1999) 美国 1.51 1.32 1.35 1.32 1.20 1.32 1.07 1.32 0.98 1.32 Joyner和Boore (2000) 美国 2.06 2.62 1.88 2.43 1.71 2.23 1.54 2.04 1.36 1.84 Borcherdt (2002) 美国 1.63 2.39 1.58 2.35 1.56 2.34 1.54 2.33 1.52 2.32 Stewart等(2003) 美国 1.81 2.60 1.47 2.14 1.27 1.92 1.19 1.74 1.13 1.66 Choi和Stewart (2005) 欧洲 1.37 2.22 1.13 1.88 1.01 1.81 0.94 1.74 0.89 Sandikkaya等(2013) 美国 1.68 2.35 1.47 2.25 1.34 2.19 1.24 2.14 1.16 1.97 Borcherdt (2014) 欧洲 1.90 3.80 1.60 3.30 1.40 3.00 1.20 2.80 1.00 2.70 Pitilakis等(2019) E 美国 2.60 3.00 2.20 3.10 1.90 3.30 1.70 3.40 1.50 3.60 Hwang等(1997) 欧洲 1.20 2.48 0.94 2.00 0.82 1.92 0.75 1.85 0.70 Sandikkaya等(2013) 美国 1.87 3.38 1.31 2.83 1.02 2.52 0.84 2.31 0.72 2.08 Borcherdt (2014) 欧洲 1.60 1.30 1.60 1.20 1.50 1.20 1.50 1.20 1.50 1.20 Pitilakis等(2019)
下载: 导出CSV
表 5 日本相关抗震设计规范中场地调整系数
$ {F}_{{\rm{a}}} $ 与场地类别的关系Table 5 The relationship between site influence factor
$ {F}_{{\rm{a}}} $ and site classification in Japanese railway code场地类别 G0 G1 G2 G3 G4 G5 G6 G7 SL1 0.80 1.00 1.20 1.40 1.48 1.60 1.36 1.12 SL2 (远场) 0.80 1.00 1.27 1.36 1.45 1.27 1.09 0.91 SL2 (近场) 0.80 1.00 1.18 1.06 0.94 0.82 0.71 0.59
下载: 导出CSV
-
薄景山. 1998. 场地分类和设计反应谱调整方法研究(博士后研究报告)[R]. 哈尔滨: 中国地震局工程力学研究所: 55–58. Bo J S. 1998. Site Classification and Design Response Spectrum Adjustment Method (Postdoctoral Research Report)[R]. Harbin: Institute of Engineering Mechanics, China Earthquake Administration: 55–58 (in Chinese).
崔昊,丁海平. 2016. 基于KiK-net强震记录的场地调整系数估计[J]. 地震工程与工程振动,36(4):147–152. doi: 10.13197/j.eeev.2016.04.147.cuih.017 Cui H,Ding H P. 2016. Estimation of site coefficient based on KiK-net strong-motion seismograph network[J]. Earthquake Engineering and Engineering Vibration,36(4):147–152 (in Chinese).
丁海平,王康. 2022. 基于反演基岩地震波的场地调整系数估计[J]. 地震工程与工程振动,42(1):25–33. doi: 10.13197/j.eeed.2022.0103 Ding H P,Wang K. 2022. Estimation of site coefficient based on inversion of bedrock input[J]. Earthquake Engineering and Engineering Vibration,42(1):25–33 (in Chinese).
窦立军. 2001. 场地条件与设计地震动[D]. 哈尔滨: 中国地震局工程力学研究所: 20–21. Dou L J. 2001. Site Conditions and Design Ground Motion[D]. Harbin: Institute of Engineering Mechanics, China Earthquake Administration: 20–21 (in Chinese).
耿淑伟. 2005. 抗震设计规范中地震作用的规定[D]. 哈尔滨: 中国地震局工程力学研究所: 67–68. Geng S W. 2005. Regulation of Seismic Action in Earthquake Resistant Design Code[D]. Harbin: Institute of Engineering Mechanics, China Earthquake Administration: 67–68 (in Chinese).
郭锋,吴东明,许国富,伋雨林. 2011. 场地条件对抗震设计反应谱最大值的影响[J]. 土木工程与管理学报,28(1):69–72. doi: 10.3969/j.issn.2095-0985.2011.01.015 Guo F,Wu D M,Xu G F,Ji Y L. 2011. Effect of site condition on the maximum value of seismic design response spectrum[J]. Journal of Civil Engineering and Management,28(1):69–72 (in Chinese).
郭晓云,薄景山,巴文辉. 2012. 汶川地震不同场地反应谱平台值统计分析[J]. 地震工程与工程振动,32(4):54–62. doi: 10.13197/j.eeev.2012.04.006 Guo X Y,Bo J S,Ba W H. 2012. Statistical analysis of peak flat values of response spectra in different site conditions based on Wenchuan strong ground motions[J]. Earthquake Engineering and Engineering Vibration,32(4):54–62 (in Chinese).
蒋通,邢海灵. 2007. 水平土层地震反应分析考虑频率相关性的等效线性化方法[J]. 岩土工程学报,29(2):218–223. doi: 10.3321/j.issn:1000-4548.2007.02.011 Jiang T,Xing H L. 2007. An equivalent linear method considering frequency-dependent soil properties for seismic response analysis[J]. Chinese Journal of Geotechnical Engineering,29(2):218–223 (in Chinese).
李洪达. 2015. 基于NGA-West2数据的场地系数研究[D]. 哈尔滨: 哈尔滨工业大学: 59–60. Li H D. 2015. Site Coefficients From NGA-West2 Data[D]. Harbin: Harbin Institute of Technology: 59–60 (in Chinese).
李瑞山,袁晓铭. 2019. 场地放大系数的理论解答[J]. 岩土工程学报,41(6):1066–1073. Li R S,Yuan X M. 2019. Theoretical solution of site amplification coefficient[J]. Chinese Journal of Geotechnical Engineering,41(6):1066–1073 (in Chinese).
李小军,彭青. 2001. 不同类别场地地震动参数的计算分析[J]. 地震工程与工程振动,21(1):29–36. doi: 10.3969/j.issn.1000-1301.2001.01.005 Li X J,Peng Q. 2001. Calculation and analysis of earthquake ground motion parameters for different site categories[J]. Earthquake Engineering and Engineering Vibration,21(1):29–36 (in Chinese).
李小军. 2013. 地震动参数区划图场地条件影响调整[J]. 岩土工程学报,35(增刊):21–29. Li X J. 2013. Adjustment of seismic ground motion parameters considering site effects in seismic zonation map[J]. Chinese Jour- nal of Geotechnical Engineering,35(S2):21–29 (in Chinese).
卢滔. 2003. 响嘡台阵场地特征及其反应的分析[D]. 哈尔滨: 中国地震局工程力学研究所: 75–77. Lu T. 2003. Analysis of Site Characteristics and Reaction of the Boomed Array in Xiangtang[D]. Harbin: Institute of Engineering Mechanics, China Earthquake Administration: 75–77 (in Chinese).
栾极. 2012. 设计反应谱场地放大系数和动力放大系数的研究[D]. 武汉: 华中科技大学: 30–31. Luan J. 2012. Study on Site Amplification Coefficient and Dynamic Amplification Coefficient of Seismic Design Response Spectrum[D]. Wuhan: Huazhong University of Science and Technology: 30–31 (in Chinese).
吕红山,赵凤新. 2007. 适用于中国场地分类的地震动反应谱放大系数[J]. 地震学报,29(1):67–76. doi: 10.3321/j.issn:0253-3782.2007.01.008 Lü H S,Zhao F X. 2007. Site coefficients suitable to China site category[J]. Acta Seismologica Sinica,29(1):67–76 (in Chinese).
吕悦军,彭艳菊,兰景岩,孟小红. 2008. 场地条件对地震动参数影响的关键问题[J]. 震灾防御技术,3(2):126–135. doi: 10.3969/j.issn.1673-5722.2008.02.003 Lü Y J,Peng Y J,Lan J Y,Meng X H. 2008. Some key problems about site effects on seismic ground motion parameters[J]. Technology for Earthquake Disaster Prevention,3(2):126–135 (in Chinese).
齐鑫,肖遥. 2012. 下辽河地区典型土层地震反应时域和频域方法对比[J]. 地震工程与工程振动,32(1):23–29. doi: 10.13197/j.eeev.2012.01.003 Qi X,Xiao Y. 2012. Comparison of seismic responses of typical soil layers in Liaohe River plain by using time domain method and frequency domain method[J]. Earthquake Engineering and Engineering Vibration,32(1):23–29 (in Chinese).
荣棉水,李小军,卢滔,黄雅虹,吕悦军. 2013. 对含厚软表层海域工程场地设计地震动参数确定的一点建议[J]. 地震学报,35(2):262–271. doi: 10.3969/j.issn.0253-3782.2013.02.012 Rong M S,Li X J,Lu T,Huang Y H,Lü Y J. 2013. Suggestion on determination of design ground motion parameters for offshore engineering sites with deep soft surface layers[J]. Acta Seismologica Sinica,35(2):262–271 (in Chinese).
史大成. 2013. 区域性场地地震动放大研究及应用[D]. 哈尔滨: 中国地震局工程力学研究所: 86–87. Shi D C. 2013. Study on Ground Motion Amplification of Regional Site and Application[D]. Harbin: Institute of Engineering Mechanics, China Earthquake Administration: 86–87 (in Chinese).
王金元. 2013. 抗震设计规范中竖向地震作用规定的研究[D]. 哈尔滨: 哈尔滨工业大学: 35–36. Wang J Y. 2013. Study on Vertical Earthquake Action Stipulated in Seismic Design Specification[D]. Harbin: Harbin Institute of Technology: 35–36 (in Chinese).
闫静茹,张郁山,郝明辉. 2020. 山东省不同场地PGA放大影响研究[J]. 地震研究,43(3):569–575. doi: 10.3969/j.issn.1000-0666.2020.03.020 Yan J R,Zhang Y S,Hao M H. 2020. Study on amplification effect of peak ground acceleration based on different sites in Shandong Province[J]. Journal of Seismological Research,43(3):569–575 (in Chinese).
赵艳,郭明珠,李化明,王文仲. 2009. 对比分析中国有关场地条件对设计反应谱最大值的影响[J]. 地震地质,31(1):186–196. doi: 10.3969/j.issn.0253-4967.2009.01.017 Zhao Y,Guo M Z,Li H M,Wang W Z. 2009. Contrast analysis of effect of site condition on the maximum of design response spectra[J]. Seismology and Geology,31(1):186–196 (in Chinese).
中华人民共和国国家质量监督检验检疫总局, 中国国家标准化管理委员会. 2016. GB18306—2015 中国地震动参数区划图[S]. 北京: 中国标准出版社: 240. General Administration of Quality Supervision, Inspection and Quarantine of the People’s Republic of China, China National Standardization Administration. 2016. Seismic Ground Motion Parameters Zonation Map of China[S]. Beijing: Standards Press of China: 240 (in Chinese).
Aboye S A,Andrus R D,Ravichandran N,Bhuiyan A H,Martin J R,Harman N E. 2014. A new seismic site coefficient model based on conditions in the South Carolina coastal plain[J]. Bull Seismol Soc Am,104(6):2866–2883. doi: 10.1785/0120140005
Andreotti G, Lai C G, Francesca B, Scandella L. 2013. New soil factors for the ItalianBuilding Code (NTC08) derived from 1D fully stochastic ground response analyses[C]//Proceedings XV Symp. Roma: Italian National Association of Earthquake Engineering: 1–12.
Borcherdt R D. 1994. Estimates of site-dependent response spectra for design:Methodology and justification[J]. Earthq Spectra,10(4):617–653. doi: 10.1193/1.1585791
Borcherdt R D. 2002. Empirical evidence for site coefficients in building code provisions[J]. Earthq Spectra,18(2):189–217. doi: 10.1193/1.1486243
Borcherdt R D, Glassmoyer G, Dietel C, Westerlund R E. 2005. Integrated surface and borehole strong-motion, soil-response arrays in San Francisco, California: Empirical measurements of low-strain site coefficients at site class E and D soil sites[G]//Directions in Strong Motion Instrumentation. Dordrecht: Springer: 55.
Borcherdt R D. 2014. Implications of next generation attenuation ground motion prediction equations for site coefficients used in earthquake resistant design[J]. Earthq Eng Struct Dyn,43(9):1343–1360. doi: 10.1002/eqe.2400
Choi Y,Stewart J P. 2005. Nonlinear site amplification as function of 30 m shear wave velocity[J]. Earthq Spectra,21(1):1–30. doi: 10.1193/1.1856535
Crouse C B,McGuire J W. 1996. Site response studies for purpose of revising NEHRP seismic provisions[J]. Earthq Spectra,12(3):407–439. doi: 10.1193/1.1585891
Dobry R, Ramos R, Power M S. 1999. Site Factors and Site Categories in Seismic Codes: Technical Report MCEER-99-0010[R]. New York: Department of Civil and Environmental Engineering, Rensselaer Polytechnic Institute: 1−81.
European Committee for Standardization. 2003. CEN-EN 1998-1 Eurocode 8: Design of Structures for Earthquake Resistance-Part 1: General Rules, Seismic Actions and Rules for Buildings[S]. Brussels: European Committee for Standardization: 19–30.
Hwang H H M,Lin H J,Huo J R. 1997. Site coefficients for design of buildings in eastern United States[J]. Soil Dyn Earthq Eng,16(1):29–40. doi: 10.1016/S0267-7261(96)00031-0
Idriss H M. 1990. Response of soft soil sites during earthquakes[C]//Proceedings Memorial Symposium to Honor Professor H B Seed. Berkeley: BiTech Publisher: 273–289.
Idriss H M. 1991. Earthquake ground motions at soft sites[C]//Proceedings of the Second International Conference on Recent Advances in Geotechnical Earthquake Engineering and Soil Dynamics. St. Louis: University of Missouri-Rolla: 2265–2273.
Joyner W B, Boore D M. 2000. Recent developments in earthquake ground-motion estimation[C]//Proc. of Sixth International Conference on Seismic Zonation. California: Earthquake Engineering Research Institute: 3–4.
Moon S W,Hashash Y M A,Park D. 2017. USGS hazard map compatible depth-dependent seismic site coefficients for the Upper Mississippi Embayment[J]. KSCE J Civil Eng,21(1):220–231. doi: 10.1007/s12205-016-0681-4
Paolucci R,Aimar M,Ciancimino A,Dotti M,Foti S,Lanzano G,Mattevi P,Pacor F,Vanini M. 2021. Checking the site categorization criteria and amplification factors of the 2021 draft of Eurocode 8 Part 1-1[J]. Bull Seismol Soc Am,19(11):4199–4234.
Pitilakis K,Riga E,Anastasiadis A,Fotopoulou S,Karafagka S. 2019. Towards the revision of EC8:Proposal for an alternative site classification scheme and associated intensity dependent spectral amplification factors[J]. Soil Dyn Earthq Eng,126:105137. doi: 10.1016/j.soildyn.2018.03.030
Régnier J,Bonilla L F,Bard P Y,Bertrand E,Hollender F,Kawase H,Sicilia D,Arduino P,Amorosi A,Asimaki D,Boldini D,Chen L,Chiaradonna A,Demartin F,Elgamal A,Falcone G,Foerster E,Foti S,Garini E,Gazetas G,Gélis C,Ghofrani A,Giannakou A,Gingery J,Glinsky N,Harmon J,Hashash Y,Iai S,Kramer S,Kontoe S,Kristek J,Lanzo G,Lernia A D,Lopez‐caballero F,Marot M,Mcallister G,Mercerat E D,Moczo P,Montoya‐Noguera S,Musgrove M,Nieto‐ferro A,Pagliaroli A,Passeri F,Richterova A,Sajana S,D’avila M P S,Shi J,Silvestri F,Taiebat M,Tropeano G,Vandeputte D,Verrucci L. 2018. PRENOLIN:International benchmark on 1D nonlinear site-response analysis:Validation phase exercise[J]. Bull Seismol Soc Am,108(2):876–900.
Rodriguez-Marek A, Bray J D, Abrahamson N. 1999. Characterization of Site Response General Categories, Pacific Earthquake Engineering Research Center Report[R]. Berkeley: Pacific Gas and Electric Company: 75–84.
Sandikkaya M A,Akkar S,Bard P Y. 2013. A nonlinear site‐amplification model for the next Pan-European ground-motion prediction equations[J]. Bull Seismol Soc Am,103(1):19–32. doi: 10.1785/0120120008
Seyhan E,Stewart J P. 2014. Semi-empirical nonlinear site amplification from NGA-West2 data and simulations[J]. Earthq Spectra,30(3):1241–1256. doi: 10.1193/063013EQS181M
Silva W, Darragh R, Gregor N, Martin G, Abrahamson N, Kircher C. 2000. Reassessment of Site Coefficients and Near-fault Factors for Building Code Provisions[R]. Reston, Virginia: U.S. Geological Survey (USGS).
Society of Civil Engineerings. 2000. Earthquake Resistance Design Codes in Japan[S]. Tokyo: The Publication Committee of Earthquake Resistant Design Codes of Civil Engineering Structures in Japan: 57.
Stewart J P,Liu A H,Choi Y. 2003. Amplification factors for spectral acceleration in tectonically active regions[J]. Bull Seismol Soc Am,93(1):332–352. doi: 10.1785/0120020049
Sun J, Idriss I M. 1992. User’s Manual for SHAKE91: A Computer Program for Conducting Equivalent Linear Seismic Response Analyses of Horizontally Layered Soil Deposits[M]. California: University of California: 1–2.
Tropeano G,Soccodato F M,Silvestri F. 2018. Re-evaluation of code-specified stratigraphic amplification factors based on Italian experimental records and numerical seismic response analyses[J]. Soil Dyn Earthq Eng,110:262–275. doi: 10.1016/j.soildyn.2017.12.030
-
期刊类型引用(5)
1. 丁海平,张铭哲. 地震动空间相干函数模型中拟合参数的修正. 地震学报. 2022(03): 501-511 .  本站查看
本站查看
2. 朱园园,丁海平. 地震波面波空间相干性规律研究. 震灾防御技术. 2021(03): 467-475 . 百度学术
3. 丁海平,朱越,李昕. 基于AR模型的相干函数有效频段范围的确定. 地震工程与工程振动. 2020(01): 30-38 . 百度学术
4. 丁海平,李昕. 参数和非参数方法计算相干函数的比较. 地震工程与工程振动. 2020(03): 11-19 . 百度学术
5. 丁海平,朱越,于彦彦. 基于能量的相干函数有效频段范围的选取. 地震工程与工程振动. 2019(02): 35-45 . 百度学术
其他类型引用(5)


计量
- 文章访问数: 459
- HTML全文浏览量: 275
- PDF下载量: 162
- 被引次数: 10
