

Removing tilt noise from the vertical component data of ocean bottom seismograph:A case study on the data from the Pankun test in the South China Sea
-
摘要:
基于水平分量和垂直分量噪声数据之间的相关性,可以通过水平到垂直分量的传递函数去除垂直分量的倾斜噪声。本文以2019—2020年磐鲲海底地震仪南海测试的数据为例,描述了该方法的原理和过程,并对比了去除倾斜噪声前后的地震波形以及瑞雷波的频散特征。结果表明:倾斜噪声的去除明显提高了海底地震仪的低频段地震波形的信噪比,使得地震面波更有利于海洋岩石圈深部结构成像;此外,尽管磐鲲海底地震仪的调平系统使地震计的倾角(1.0°)远小于其容倾角(2.5°),在底流作用下,海底地震仪还是产生了明显的倾斜噪声。因此,地震仪调平系统的性能对海底地震仪的数据质量有着非常重要的影响。
Abstract:Based on the correlations between the noise data of the horizontal and the vertical components, we can remove the tilt noise from the vertical component by using the transfer function of the horizontal-to-vertical component. Using the data from the 2019−2020 Pankun OBS South China Sea test, this paper describes the theory and process of this method. It compares the seismograms before and after removing the tilt noise and highlights the improvement of the dispersions of Rayleigh surface waves. The results show that removing tilt noise can improve the signal-to-noise ratio of seismograms for the OBS data in the low-frequency range, resulting in surface waves more conducive to imaging the deep structure of the oceanic lithosphere. This study also shows that although the tilt angle (1.0°) of the seismometer of Pankun OBS is much smaller than the tolerance of the tilt angle of the instrument (2.5°), the bottom currents still generate a significant level of tilt noise on OBS data. Therefore, the leveling system of the instrument is a crucial component affecting the OBS data quality.
-
Keywords:
- ocean bottom seismograph (OBS) /
- seismic noise /
- tilt noise /
- removing noise
-
引言
相对于陆地,海洋的地震观测要困难得多,而海洋面积占地球表面积71%,这极大限制了全球的天然地震观测。近30年来,尽管海底地震仪(ocean bottom seismograph,缩写为OBS)的应用在很大程度上弥补了海底地震观测这一空缺(Moore et al,1981;Collins et al,2001;Stephen et al,2003),但OBS数据相对陆地台站通常表现出更高的噪声水平,尤其是在对反演海洋地下深部结构非常重要的低频段(Webb,1988,1998;Webb,Crawford,1999)。海洋的复杂环境特别是各种水波,包括底流、潮汐、内波、表面水波、海洋生物等在内的各种因素共同导致了OBS的高噪声数据。降低OBS数据的噪声水平、提高其记录地震波形的信噪比对于地震学及海洋地球物理学的发展具有重要意义。
一方面,可以依靠设计和研发更高性能的OBS来提高海底地震数据的质量。例如:将传感器模块和仪器本体分离的分体式OBS技术(Duennebier et al,1981);将传感器模块浅埋入海底沉积层的技术(Wooding et al,2001;Shiobara et al,2013);屏蔽OBS地震传感器(即给地震传感器增加外部屏障,使水流不能直接作用于传感器)的技术(刘丹等,2022)等。这些技术的进步无疑推动了OBS的发展,使得一些大型被动源OBS观测计划得以实施。分体式设计使得地震传感器模块相对独立,可降低仪器本体噪声对地震数据的干扰。这一设计现已经被广泛采用,成功的被动源OBS观测计划,如Cascadia Initiative (Toomey et al,2014),RHUM-RUM (Stähler et al,2016)和ORCA (Eilon et al,2022)等都是应用这种类型的仪器。利用重物或遥控无人潜水器(remote operated vehicle,缩写为ROV)将地震传感器埋入沉积层虽然可以显著降低OBS的噪声水平,但同时大大增加了布放成本,因此这种技术目前只适用于单个OBS实验(如:Wooding et al,2001;Shiobara et al,2013),难以应用于大型被动源OBS观测台阵。利用自埋式机器人技术,使OBS的传感器模块可以自动浅埋入沉积层的自埋式OBS具有广阔的前景,可以实现在成本可控的前提下有效提高OBS的数据质量,但目前,该技术还尚未成熟。实验研究显示,给地震传感器增加外部保护壳几乎可以完全屏蔽水流对地震传感器的影响,是一种低成本且比较有效的降噪技术。
另一方面,可以利用数据处理方法去除OBS数据的噪声,提高地震信号的信噪比,但目前这种方法仅限于去除OBS垂直分量上的噪声。OBS的低频噪声有两个主要来源:一个是底流作用导致的倾斜噪声(tilt noise),底流会导致OBS水平分量产生低频(<0.1 Hz)噪声,当传感器尚未完美调平时,水流产生的噪声会从水平分量“泄漏”到垂直分量;另一个是次重力波(infragravity waves)对海底作用产生的屈服噪声(compliance noise),当海洋表面水波的波长超过水深时,长周期的水波可以穿透水层造成海底的垂直运动进而导致OBS数据上的屈服噪声。因此屈服噪声的高频极限与水深相关,可以通过一个简单的公式$f{\text{≈}} \sqrt{{g}/ ( {2\pi d} ) }$来近似计算(Bell et al,2015)。目前普遍使用的去除OBS噪声的数据处理方法也是针对这两种噪声,即分别利用水平、垂直噪声数据和压力、垂直噪声数据来计算水平到垂直分量以及压力到垂直分量的传递函数,并分别去除垂直分量上的倾斜噪声与屈服噪声,从而提高垂直分量上地震信号的信噪比,得到更高质量的地震波形。这种方法已被广泛应用于最近的科学实验中(Bell et al,2016;Bowden et al,2016;Lin et al,2016;Agius et al,2017;Tian,Ritzwoller,2017;Cai et al,2018;Doran,Laske,2019;Janiszewski et al,2019)。An等(2021)的研究表明,OBS水平分量的低频(<0.1 Hz)噪声存在一个几乎不变的主导方向,建议通过旋转水平分量数据来有效降低垂直主导方向上的噪声水平。
基于上述问题,本文拟利用2019—2020年磐鲲OBS南海测试的数据,采用Bell等(2015)的方法去除海底地震仪垂直分量上的倾斜噪声,以提高垂直分量上地震波形的信噪比,为海洋地下深部结构反演等研究提供可靠数据基础。
1. 数据和方法
1.1 数据
本文使用2019—2020年磐鲲OBS在南海测试(图1)的数据。磐鲲海底地震仪(OBS)是南方科技大学自主研发的分体式宽频带OBS,关于2019—2020年南海测试和磐鲲OBS更详细的介绍可参考刘丹等(2022)、Wang等(2022)和Liu 等(2023)的文章。在用于测试的6台仪器(5台返回了有效数据,另1台也成功回收)中,只有台站K02产生了明显的倾斜噪声,因此本文的分析是基于台站K02在南海深水区(深度为3 896 m)自2019年10月至2020年5月期间的连续7个月的观测数据。
1.2 方法
在海底底流的作用下,OBS会产生水平方向上的噪声,而如果仪器倾斜,噪声会从水平分量“泄漏”到垂直分量。为了去除倾斜噪声,需要计算水平与垂直分量之间的传递函数。传递函数作为频率的函数显示了从一个分量传递到另一个分量的相移和比例系数。如果传递函数的相移为0,比例系数为常数且与频率不相关,那么去除倾斜噪声就可以简化为旋转地震计的坐标系,即将垂直分量旋转到重力的方向。然而,传递函数存在频率相关性,因此,使用传递函数去除倾斜噪声的方法更加可靠。另外,OBS在海底的倾斜特征可能会随着时间发生变化,为了使去除倾斜噪声的效果最优,需要至少每天计算一个传递函数(Bell et al,2015)。
本文研究使用Bell等(2015)的方法来计算传递函数。这一方法来源于Bendat和Piersol (1986)的理论。假设$ x ( t ) $和$ y ( t ) $均为具有正态分布误差的平稳随机过程(即地震仪记录中的理想噪声数据),将$ x ( t ) $和$ y ( t ) $分解为$ {n} $个子过程,则互谱密度函数${G}_{ xy} ( f ) \mathrm{可定}\mathrm{义}$为
$$ {G}_{ xy} ( f ) =\frac{1}{{n}}\sum\limits _{i=1}^{{n}}{X}_{i}^{*} ( f ) {Y}_{i} ( f ) ,$$ (1) 式中,$ f $为谱频率,$ X ( f ) $和$ Y ( f ) $分别为$ x ( t ) $和$ y ( t ) $的傅里叶变换,*表示共轭。将X和Y分解为实部和虚部,分别定义实部和虚部的互谱密度函数$ {C}_{xy} ( f ) $和$ {Q}_{ xy} ( f ) $为:
$$ {C}_{xy} ( f ) =\frac{1}{{n}}\sum\limits _{i=1}^{{n}} ( {X}_{{\rm{R}}}{Y}_{{\rm{R}}}+{X}_{{\rm{I}}}{Y}_{{\rm{I}}} ) ,$$ (2) $$ {Q}_{xy} ( f ) =\frac{1}{{n}}\sum\limits _{i=1}^{{n}} ( {X}_{{\rm{R}}}{Y}_{{\rm{I}}}-{X}_{{\rm{I}}}{Y}_{{\rm{R}}} ) {\text{.}} $$ (3) 定义$ x ( t ) $相对于自身的谱密度函数为$ {G}_{xx} $,则X到Y的最优线性传递函数$ {H}_{xy} ( f ) $为:
$$ {H}_{xy} ( f ) =\frac{{G}_{xy} ( f ) }{{G}_{xx} ( f ) } {\text{.}} $$ (4) 结合上述内容可以得到描述复传递函数的三个参数,即:增益系数A,相关性γ2和相位ϕ。其中,增益系数表示传递函数的振幅;相关性给出了$ x ( t ) $在指定频率与$ y ( t ) $匹配的程度,它是相关系数的平方,表示可以从$ x ( t ) $线性预测出$ y ( t ) $的幂的部分;相位则表示$ x ( t ) $与$ y ( t ) $之间的相移。描述复传递函数的增益系数、相关性和相位三个参数可表示如下:
$$ {A}_{xy} ( f ) =\frac{\left|{G}_{xy} ( f ) \right|}{{G}_{xx} ( f ) } ,$$ (5) $$ {\gamma }_{xy}^{2} ( f ) =\frac{{\left|{G}_{xy} ( f ) \right|}^{2}}{{G}_{xx} ( f ) {G}_{yy} ( f ) } ,$$ (6) $$ {\phi }_{xy} ( f ) =\mathrm{arctan}\frac{{Q}_{xy} ( f ) }{{C}_{xy} ( f ) } {\text{.}} $$ (7) 利用传递函数,可以计算出从水平分量“泄漏”到垂直分量的噪声,从而自垂直分量中去除这部分噪声。在早期的噪声去除方法(Crawford,Webb,2000)中,先后对两个水平分量各自“泄漏”到垂直分量的噪声进行去除。Bell等(2015)改进了这一方法,首先旋转水平分量以找到与垂直分量具有最大相关性的水平方向,接着利用旋转的水平分量一次性去除垂直分量的倾斜噪声。这种方法在最大相关性的方向上给出了地震计倾斜的物理方向,而倾斜角度可以通过计算倾斜频段上增益系数的反正切得到,并且最大化相关性可以将传递函数中的不确定性降至最低。
2. 处理过程
传递函数量化了两个分量在频域上的增益系数、相关性和相位关系。传递函数的计算依赖于信号平稳的统计特性,因此在计算传递函数前需要剔除地震等瞬变信号。通过在频域上对多个噪声时间窗中计算的增益系数、相关性和相位关系进行平均,可以得到合适的传递函数。选择噪声数据的方法包括:使用较长的时间窗口,使地震等瞬变信号占据较短的时间窗长度(Yang et al,2012);利用地震目录选择相对没有地震发生的时间窗口(Bell et al,2015);手动挑选时间窗口(Bell et al,2015);利用程序自动剔除含有瞬变信号的窗口(Janiszewski et al,2019)等。本文采用Janiszewski等(2019)的方法选择噪声数据,因为地震目录并不能完全描述OBS记录中的瞬变信号,例如一些较小的近震不会出现在地震目录上,但它们会对平稳的噪声信号造成干扰。
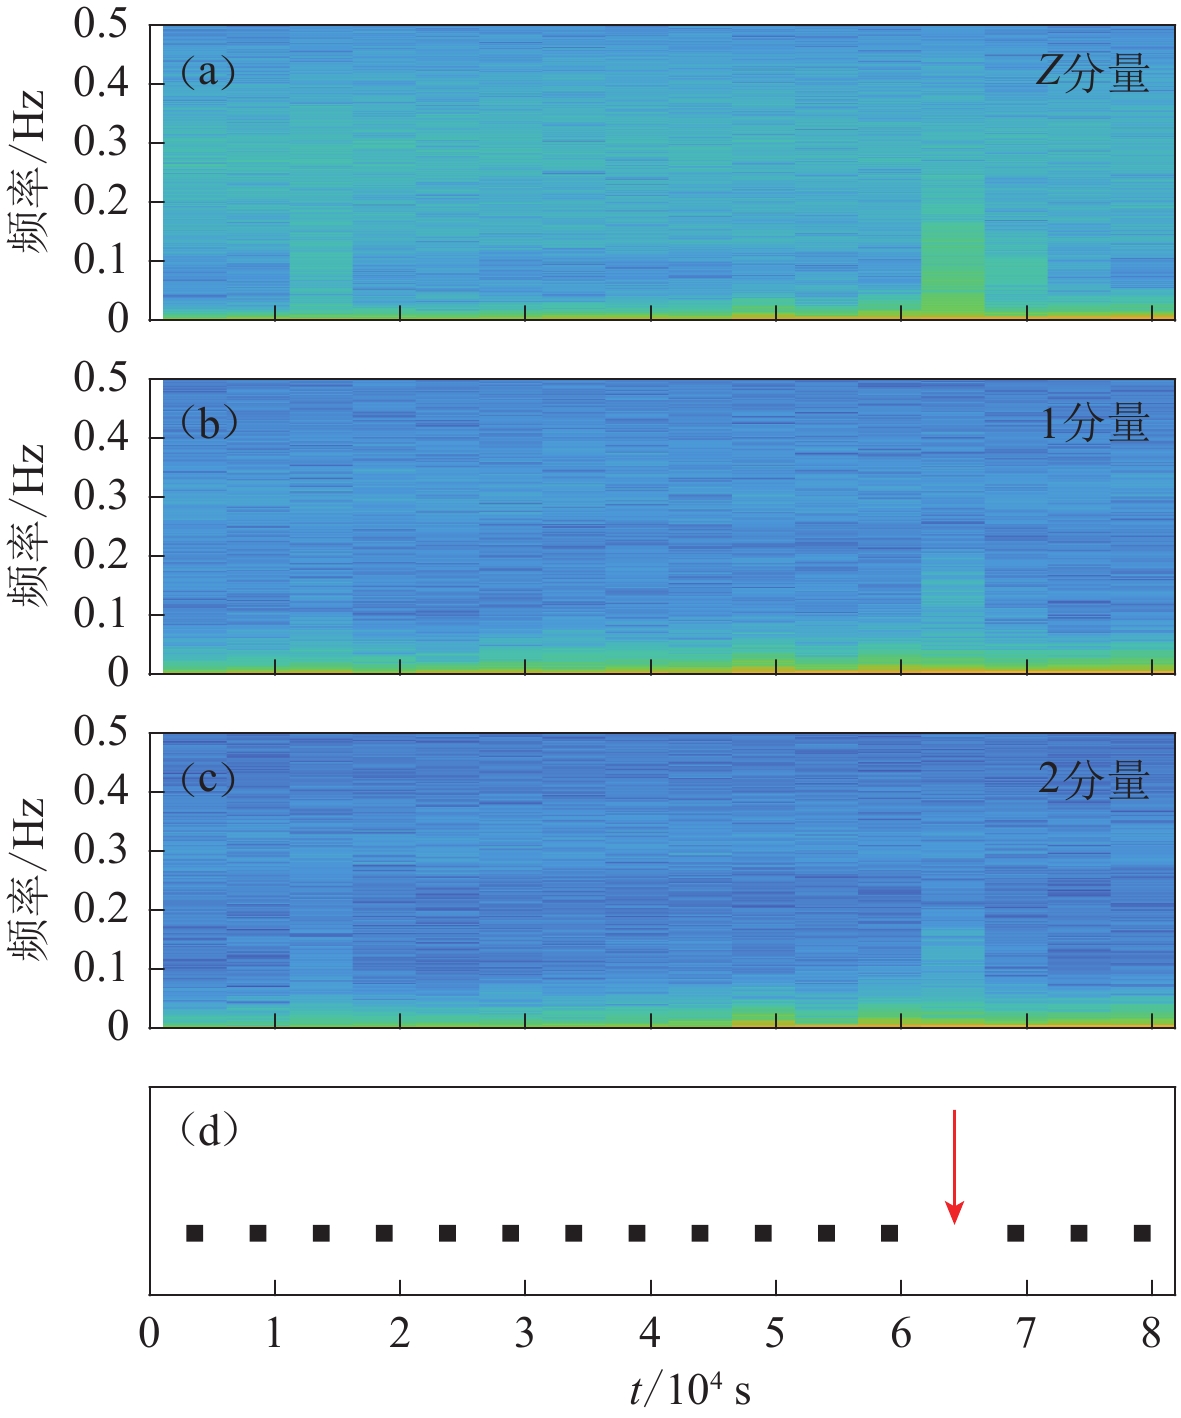
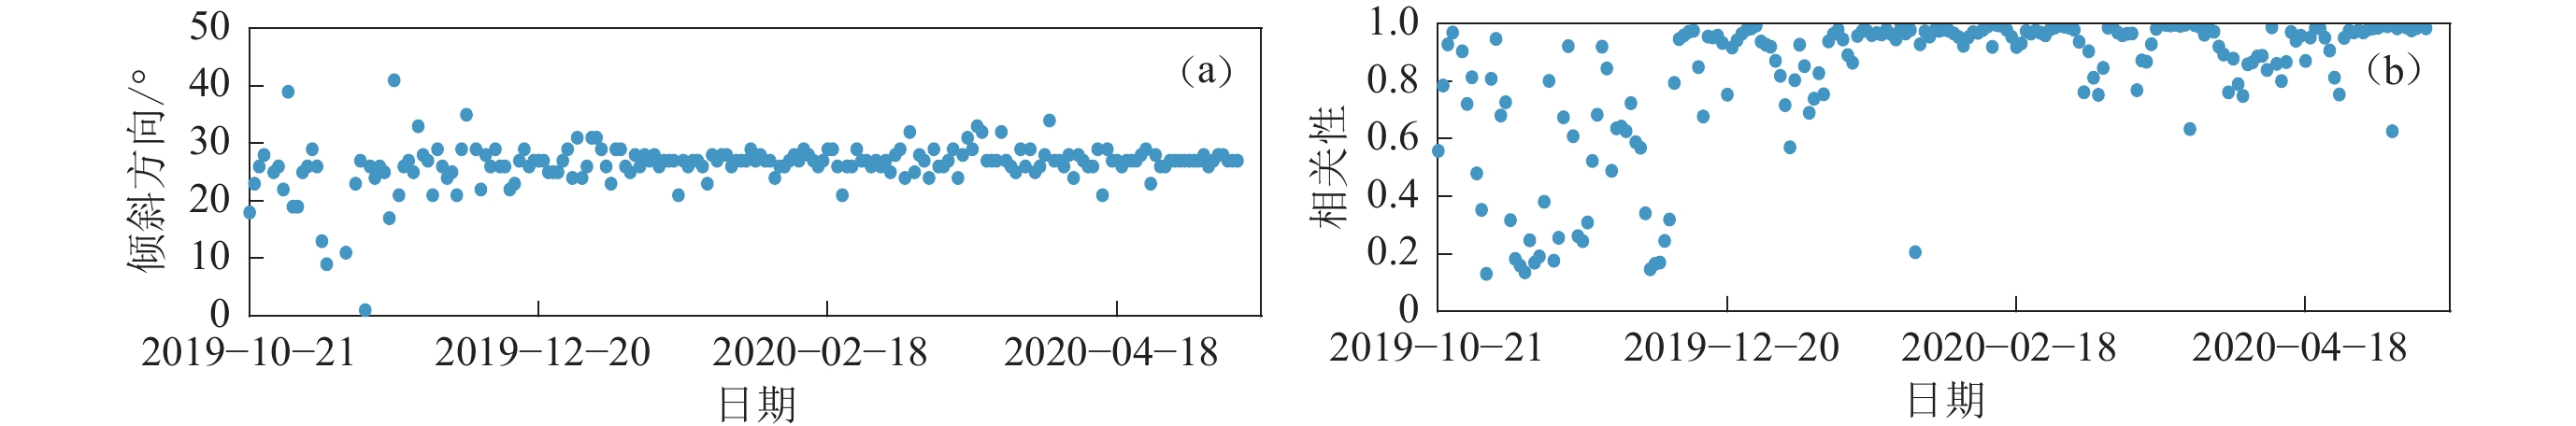
选择噪声数据:首先需去除原始数据的仪器响应,设置时间窗口长度为7 200 s,相邻时间窗重叠30%,基于每天的噪声数据设置阈值以去除能量相对较高的噪声窗口(图2);然后,利用Bell等(2015)的方法对水平分量(1和2分量)进行旋转并计算与垂直分量(Z分量)的相关性,具有最大相关性的水平分量(H分量)的方向即为地震计倾斜的方向。对每天的数据重复此处理过程,结果如图3所示,可以看出,台站K02地震计的倾斜方向在布设期间一直很稳定,大约在水平分量1顺时针旋转27°的方向。
![]() 图 2 2020年3月18日垂直(a)和水平(b,c)分量的频谱及噪声时间窗选择(d)图(d)中的方块表示窗口被接受,而方块的缺失(箭头所示)表示窗口未通过基于日平均值设置的阈值Figure 2. Spectrogram for the vertical (a) and horizontal (b,c) components,and the noise time windows selection (d) on 18th March,2020A square in fig. (d) indicates that the window is accepted, while the absence of a square (indicated by the arrow) indicates that the window does not pass the threshold set based on the daily average
图 2 2020年3月18日垂直(a)和水平(b,c)分量的频谱及噪声时间窗选择(d)图(d)中的方块表示窗口被接受,而方块的缺失(箭头所示)表示窗口未通过基于日平均值设置的阈值Figure 2. Spectrogram for the vertical (a) and horizontal (b,c) components,and the noise time windows selection (d) on 18th March,2020A square in fig. (d) indicates that the window is accepted, while the absence of a square (indicated by the arrow) indicates that the window does not pass the threshold set based on the daily average![]() 图 3 台站K02布设期间水平与垂直分量的最大相关性方向(a)和对应的相关大小(b)图(a)中的倾斜方向为相对水平分量1顺时针转过的角度Figure 3. Maximum coherence direction (a) and corresponding coherence value (b) of the horizontal to vertical component during station K02 deploymentThe tilt direction in fig.(a) represents the degrees turned clockwise relative to the horizontal component 1
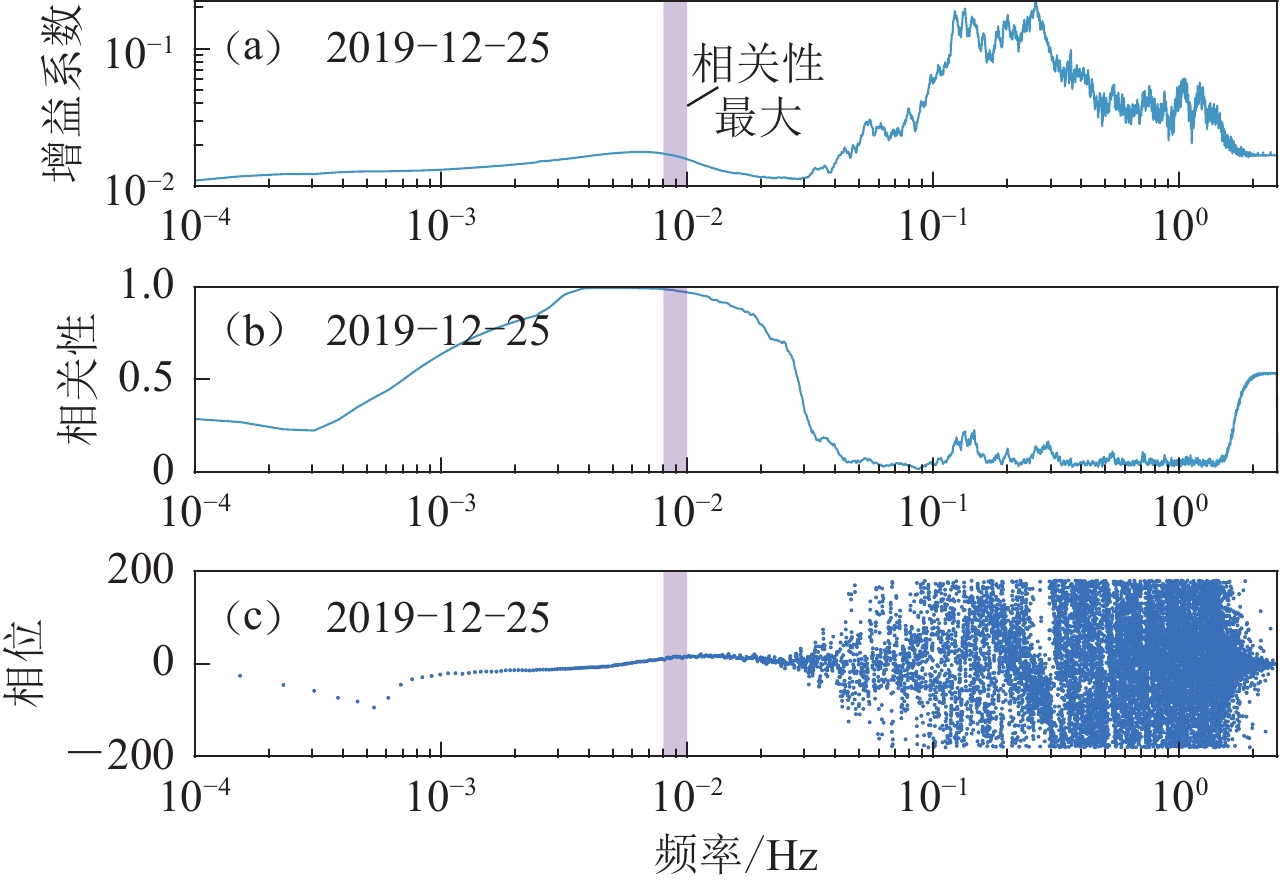
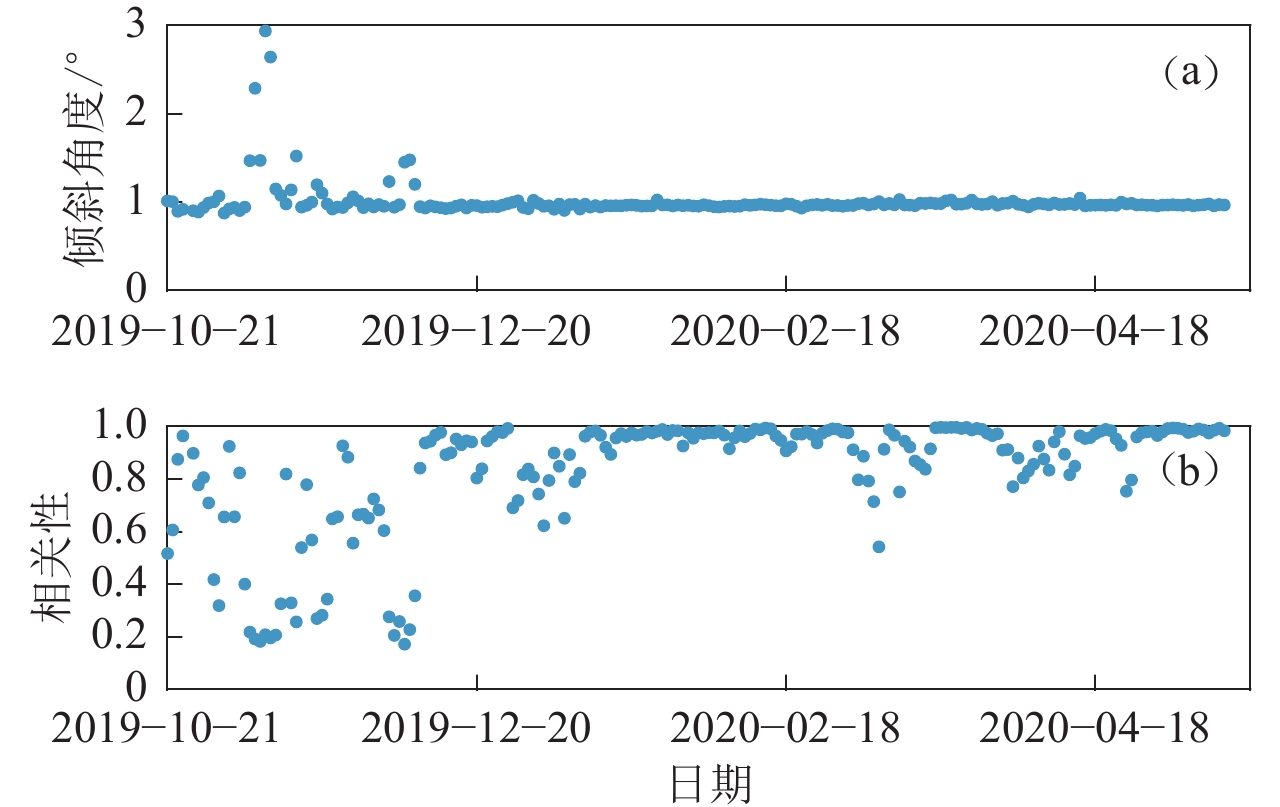
图 3 台站K02布设期间水平与垂直分量的最大相关性方向(a)和对应的相关大小(b)图(a)中的倾斜方向为相对水平分量1顺时针转过的角度Figure 3. Maximum coherence direction (a) and corresponding coherence value (b) of the horizontal to vertical component during station K02 deploymentThe tilt direction in fig.(a) represents the degrees turned clockwise relative to the horizontal component 1OBS在布设期间的倾斜特征可能会持续变化,对每天的噪声数据计算传递函数。利用图3中得到的H分量计算水平到垂直分量传递函数的增益系数、相关性和相位,过程示例如图4所示。为了使处理过程更加严谨,考虑到地震计的频带宽度(100 Hz—120 s),暂不考虑频率低于0.008 Hz的数据。在相关性最大的倾斜频段(0.008—0.01 Hz)上,增益系数基本恒定,相移近似为0,与倾斜效应一致。计算倾斜频段上增益系数的反正切得到倾斜角度,对每天的数据重复此过程即可得到布设期间台站的倾斜特征(图5)。可以看出,布设初期台站的倾斜角度出现一些小的变化,可能反映了OBS在海底软质沉积层中的不均匀沉降。在随后的绝大部分时间里台站K02的倾斜角度一直稳定在1°左右,对应水平与垂直分量的相关性在大部分时间里均较高,说明计算结果相对可靠。
![]() 图 4 水平到垂直分量传递函数的增益系数(a)、相关性(b)和相位(c)Figure 4. Admittance (a),coherence (b) and phase (c) of the horizontal to vertical component transfer function
图 4 水平到垂直分量传递函数的增益系数(a)、相关性(b)和相位(c)Figure 4. Admittance (a),coherence (b) and phase (c) of the horizontal to vertical component transfer function![]() 图 5 台站K02布设期间的倾斜角度(a)和其对应的相关性(b)Figure 5. Tilt angle (a) and corresponding coherence value (b) during station K02 deployment
图 5 台站K02布设期间的倾斜角度(a)和其对应的相关性(b)Figure 5. Tilt angle (a) and corresponding coherence value (b) during station K02 deployment3. 结果
Peterson (1993)根据全球地震台网75个宽频带陆地地震台站的地震数据,挑选出了近
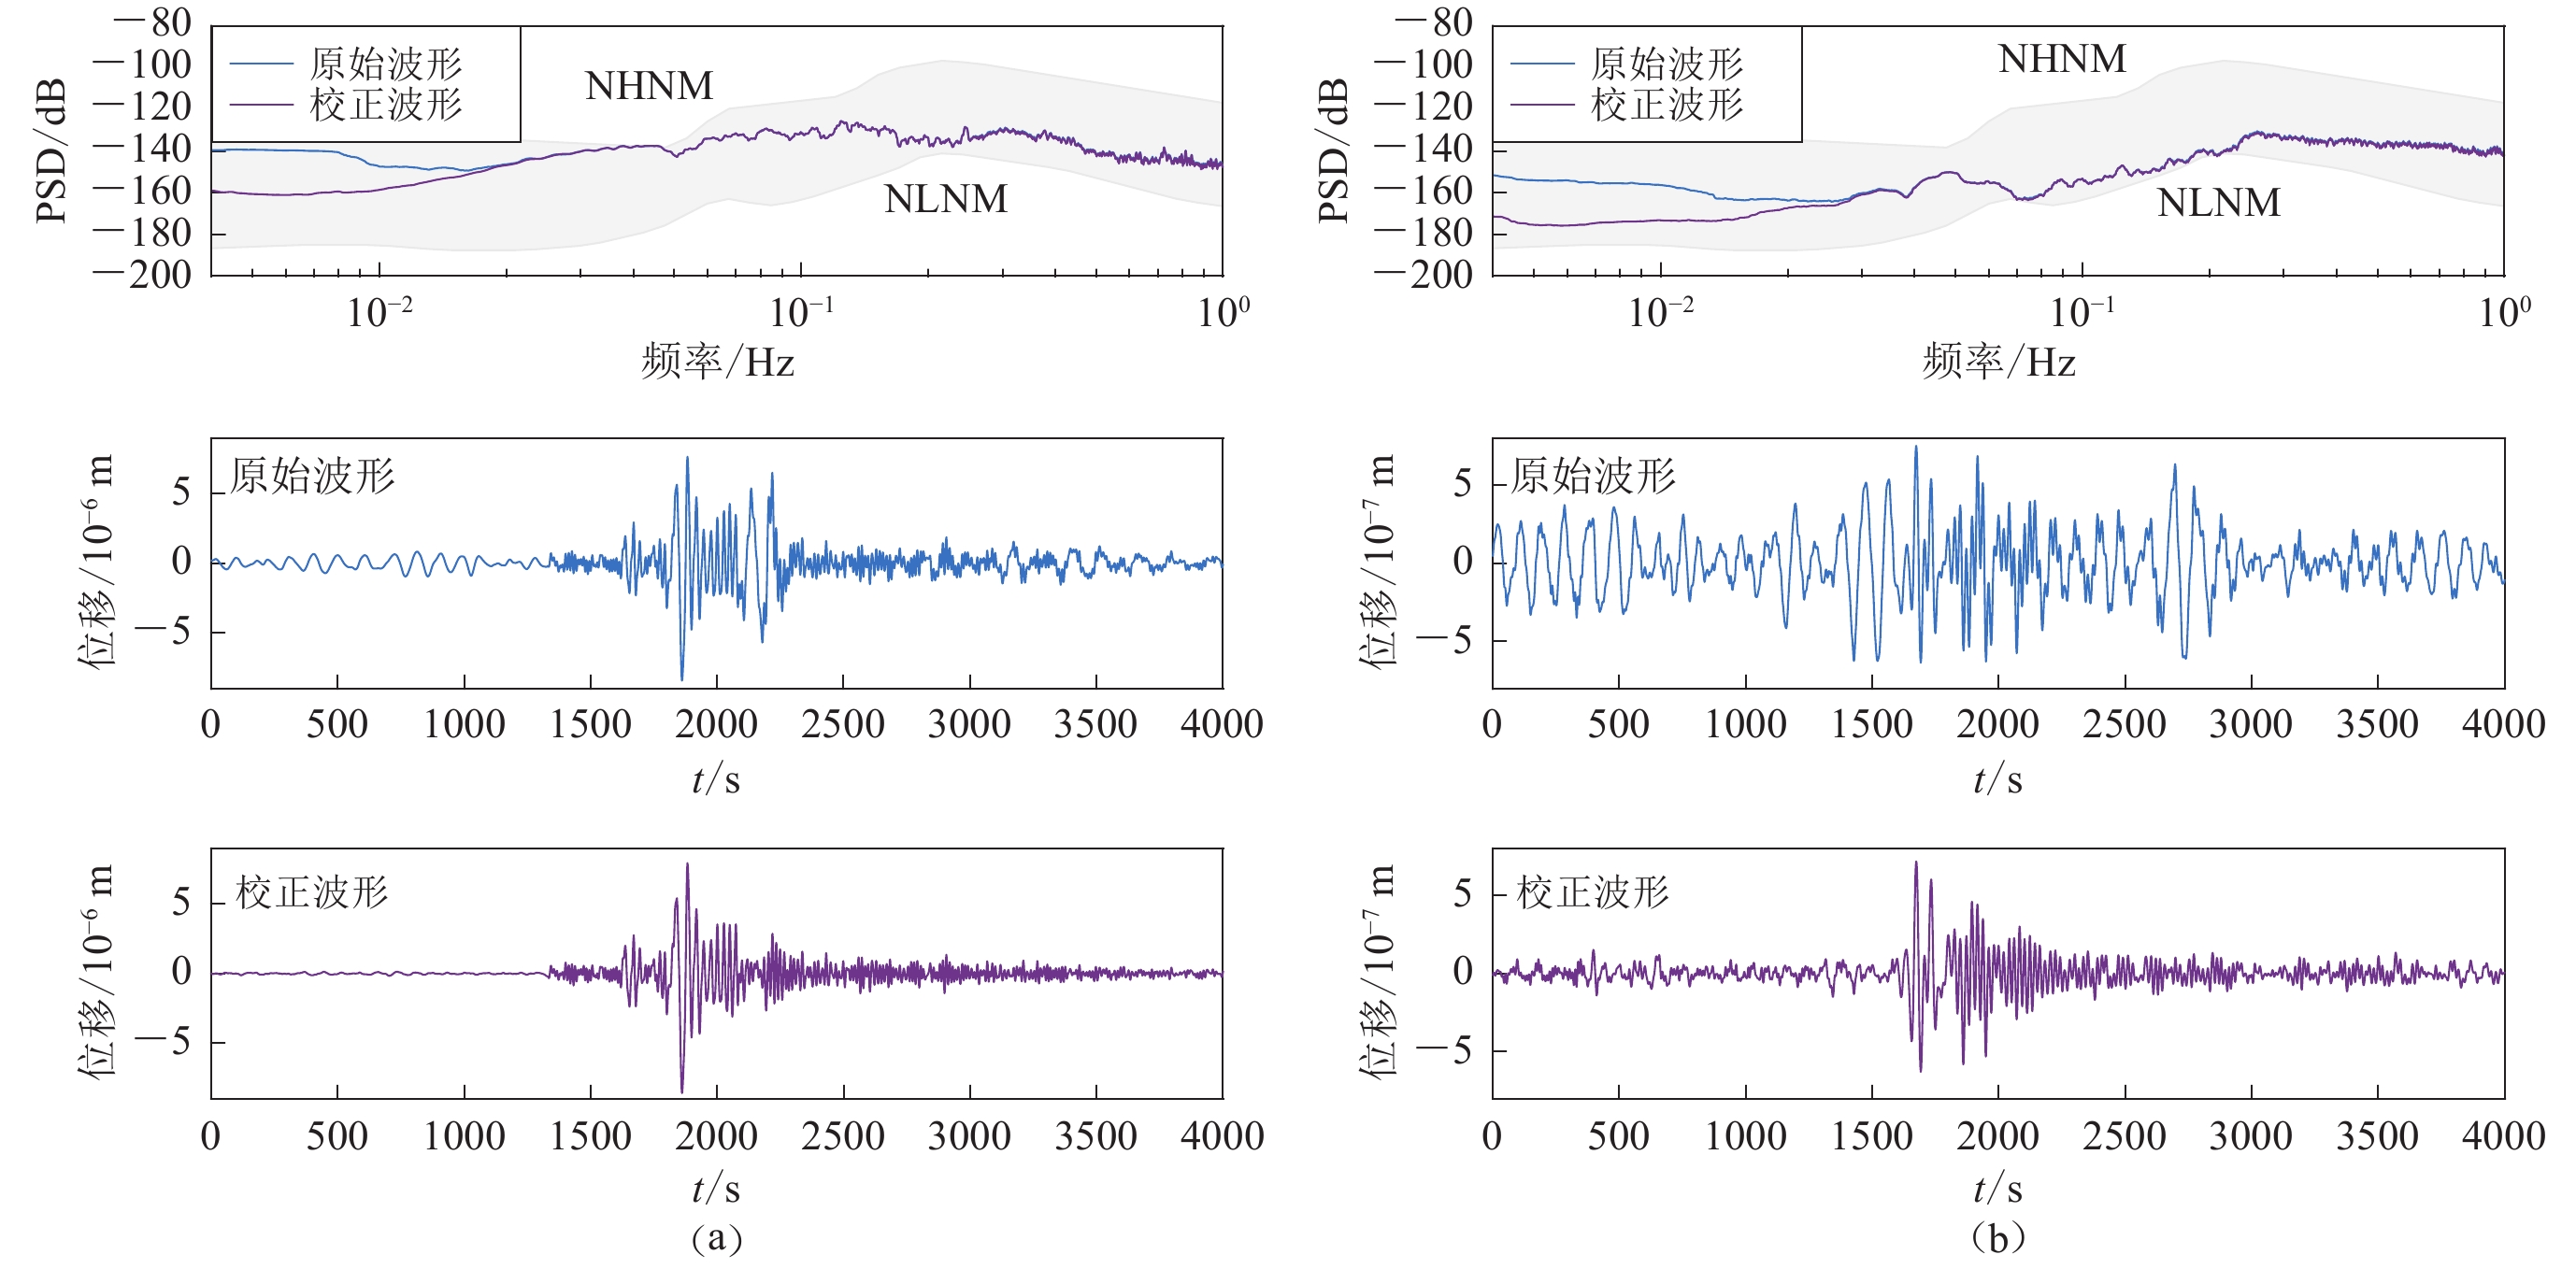
2000 条相对平静的噪声记录并分析了它们的噪声功率谱密度(power spectral density,缩写为PSD),给出了全球陆地台站的新高噪声模型(new high noise model,缩写为NHNM)和新低噪声模型(new low noise model,缩写为NLNM),如今这一模型已成为衡量地震台站噪声水平的重要依据。将传递函数应用于对应的水平分量地震数据,并将传递的那一部分噪声从垂直数据中去除,得到倾斜校正的地震波形。某两个地震波形去除倾斜噪声前后的对比,如图6所示。
![]() 图 6 去除倾斜噪声前后波形(滤波至0.01—0.1 Hz)及其功率谱密度 (PSD) 对比(a) 2020年3月18日巴厘岛南部附近发生的MW6.2地震;(b) 2019年12月25日东太平洋海隆南部附近发生的MW6.1地震Figure 6. Comparison of waveforms (filtered at 0.01−0.1 Hz) and its PSDs before and after tilt noise removed(a) MW6.2 earthquake occurred near the south of Bali on March 18,2020;(b) MW6.1 earthquake occurred near the southern East Pacific Rise on December 25,2019
图 6 去除倾斜噪声前后波形(滤波至0.01—0.1 Hz)及其功率谱密度 (PSD) 对比(a) 2020年3月18日巴厘岛南部附近发生的MW6.2地震;(b) 2019年12月25日东太平洋海隆南部附近发生的MW6.1地震Figure 6. Comparison of waveforms (filtered at 0.01−0.1 Hz) and its PSDs before and after tilt noise removed(a) MW6.2 earthquake occurred near the south of Bali on March 18,2020;(b) MW6.1 earthquake occurred near the southern East Pacific Rise on December 25,2019图6a所示为台站K02记录的一个发生在巴厘岛附近的MW6.2近震,在原始数据中就可以看到较为清晰的地震波形,但仍受到明显的长周期噪声的干扰。经过倾斜噪声校正后,长周期噪声的干扰几乎被完全去除了,在地震发生前的相对安静时期波形振幅在0附近无明显波动,去除倾斜噪声后的地震波形几乎达到了与附近陆地台站相当的波形质量(图7)。图6b是台站K02记录的一个发生在东太平洋海隆附近的MW6.1较远地震,它的振幅比几乎同样震级的近震(图6a)小了一个数量级,在原始波形中几乎看不到地震信号,但进行倾斜噪声校正后,各震相变得较为清晰,这表明去除倾斜噪声可以提高OBS对远震的探测能力。同时,从去除倾斜噪声前后地震数据的功率谱密度曲线可以看出,倾斜噪声主要存在于低频段(<0.03 Hz),去除倾斜噪声后,地震波形的PSD曲线在低频段均有不同程度的降低,表明去除倾斜噪声可以提高OBS记录的地震波形在低频段的信噪比。
![]() 图 7 巴厘岛附近MW6.2地震和台站位置(a)及去除倾斜噪声后垂直分量波形与附近陆地台站对比(b)(滤波至0.01—0.1 Hz)Figure 7. The MW6.2 earthquake near Bali and station locations (a) and comparison of vertical component waveforms after tilt noise removed with nearby land stations (b)(filtered at 0.01−0.1 Hz)
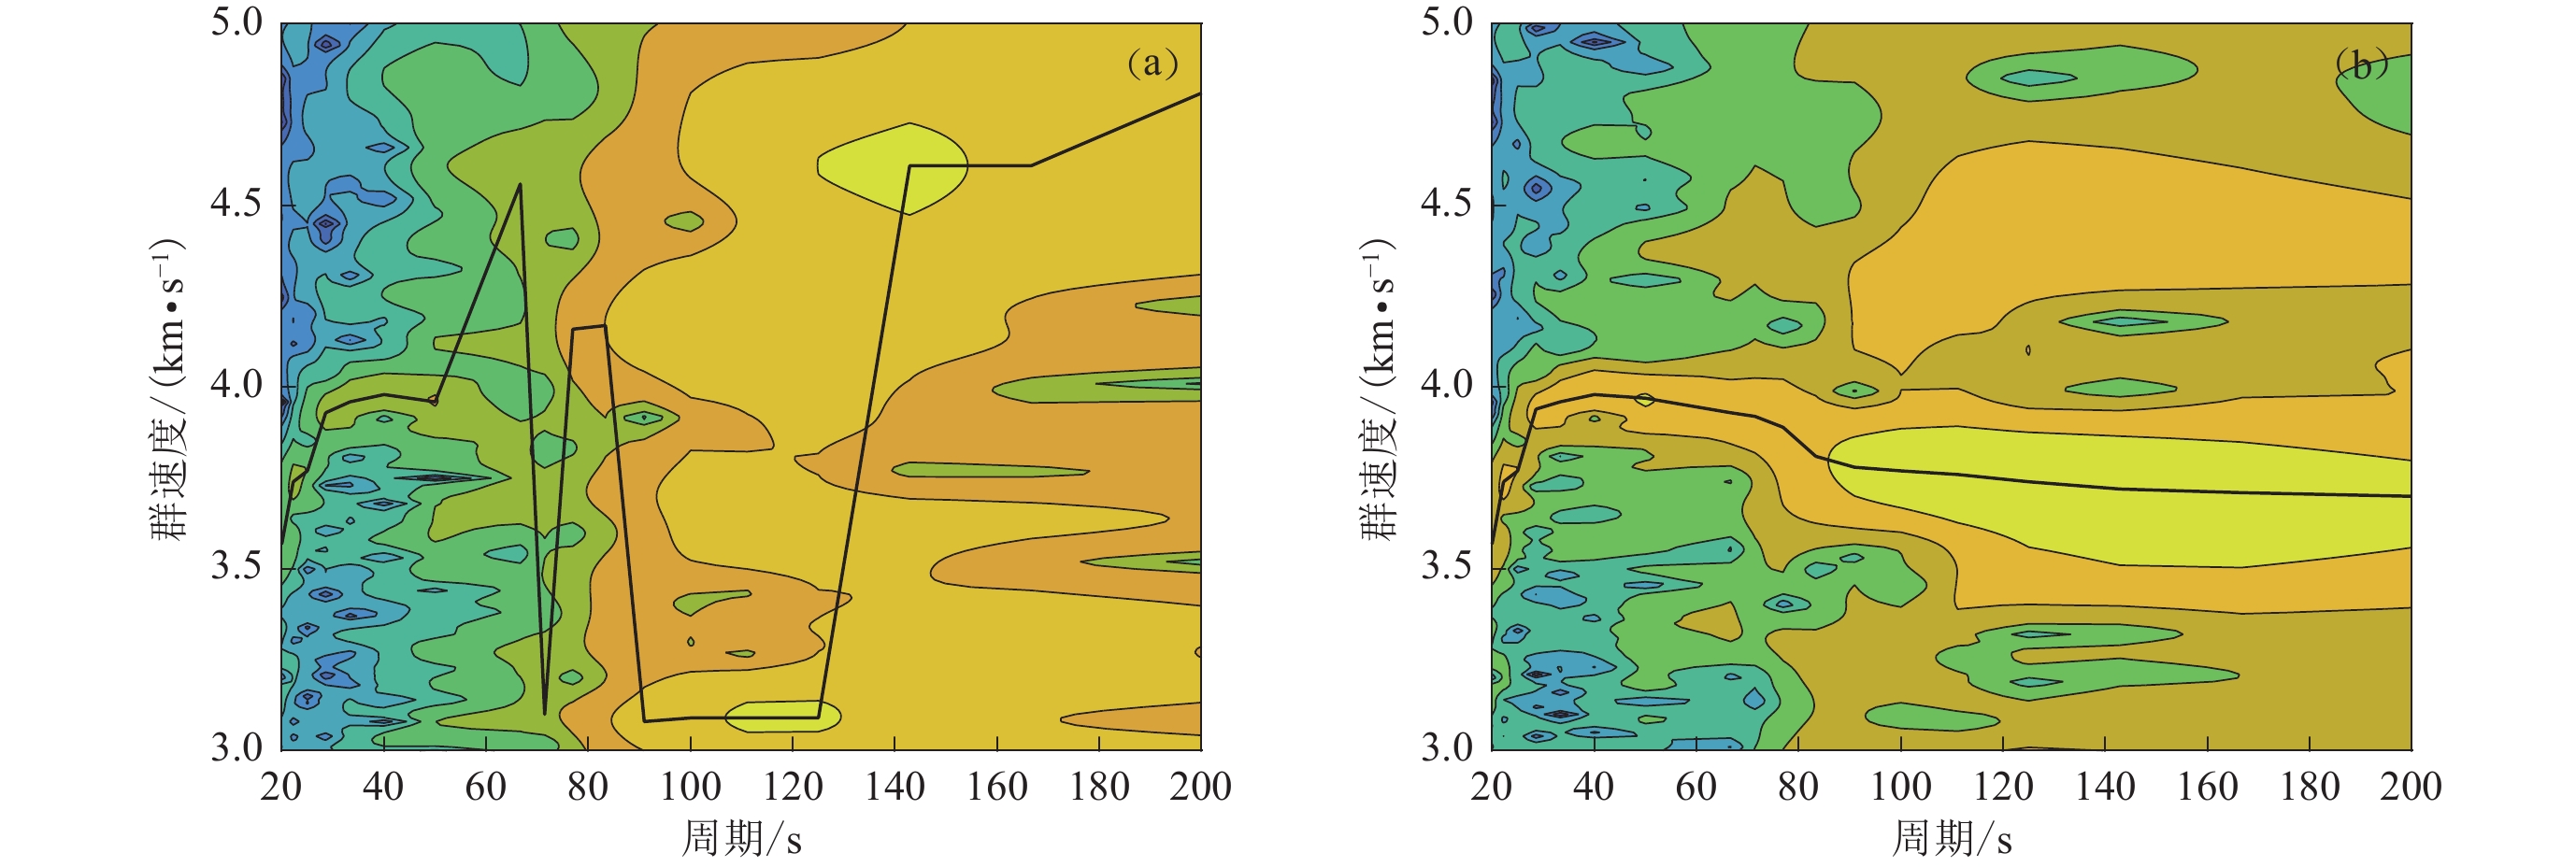
图 7 巴厘岛附近MW6.2地震和台站位置(a)及去除倾斜噪声后垂直分量波形与附近陆地台站对比(b)(滤波至0.01—0.1 Hz)Figure 7. The MW6.2 earthquake near Bali and station locations (a) and comparison of vertical component waveforms after tilt noise removed with nearby land stations (b)(filtered at 0.01−0.1 Hz)由于海底地震台站比陆地台站稀疏得多,远震体波在海洋岩石圈深部结构成像中的作用受到较大限制,而地震面波横跨海盆传播,因此地震面波尤其是低频面波对于洋壳和海洋岩石圈的探测至关重要。我们对台站K02接收到的部分地震做了群速度的频率−时间分析得到其频散曲线,图8给出了一个地震波形(图6b中的地震)去除倾斜噪声前后的瑞雷波频散特征。可以看出,在去除倾斜噪声前,频散曲线(图8a)受到噪声影响无法反映海洋岩石圈的结构变化特征;而去除倾斜噪声后,典型的、平滑的频散曲线(图8b)呈现出面波群速度随岩石圈及上地幔结构在深度方向上的变化规律;所以,去除倾斜噪声可以提高OBS记录的低频面波数据质量,使其更有利于进行海洋岩石圈的速度结构成像。
![]() 图 8 原始地震波形(a)与去除倾斜噪声后的地震波形(b)的频散特征Figure 8. Dispersion characteristics of the raw seismic waveform (a) and the seismic waveform after tilt noise removed (b)
图 8 原始地震波形(a)与去除倾斜噪声后的地震波形(b)的频散特征Figure 8. Dispersion characteristics of the raw seismic waveform (a) and the seismic waveform after tilt noise removed (b)4. 讨论与结论
4.1 地震计倾斜角度对倾斜噪声的影响
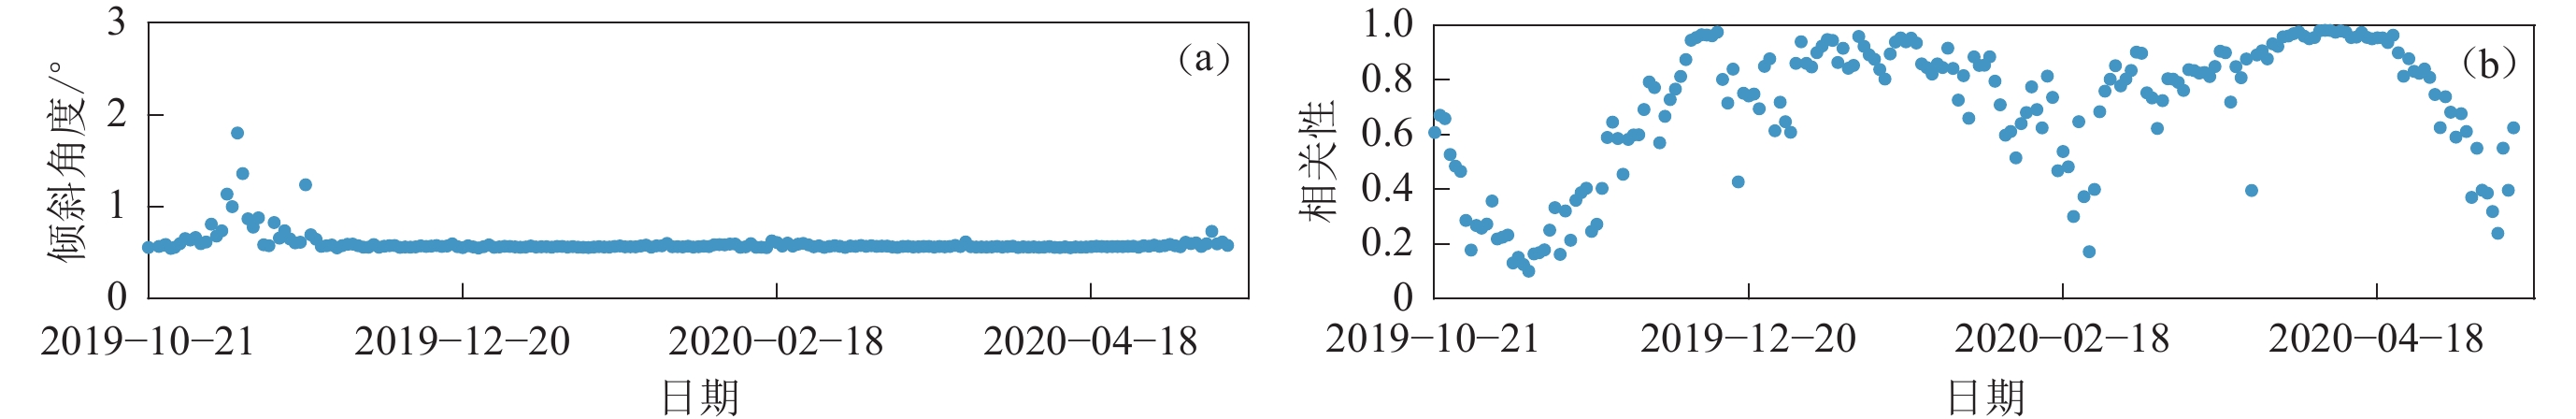
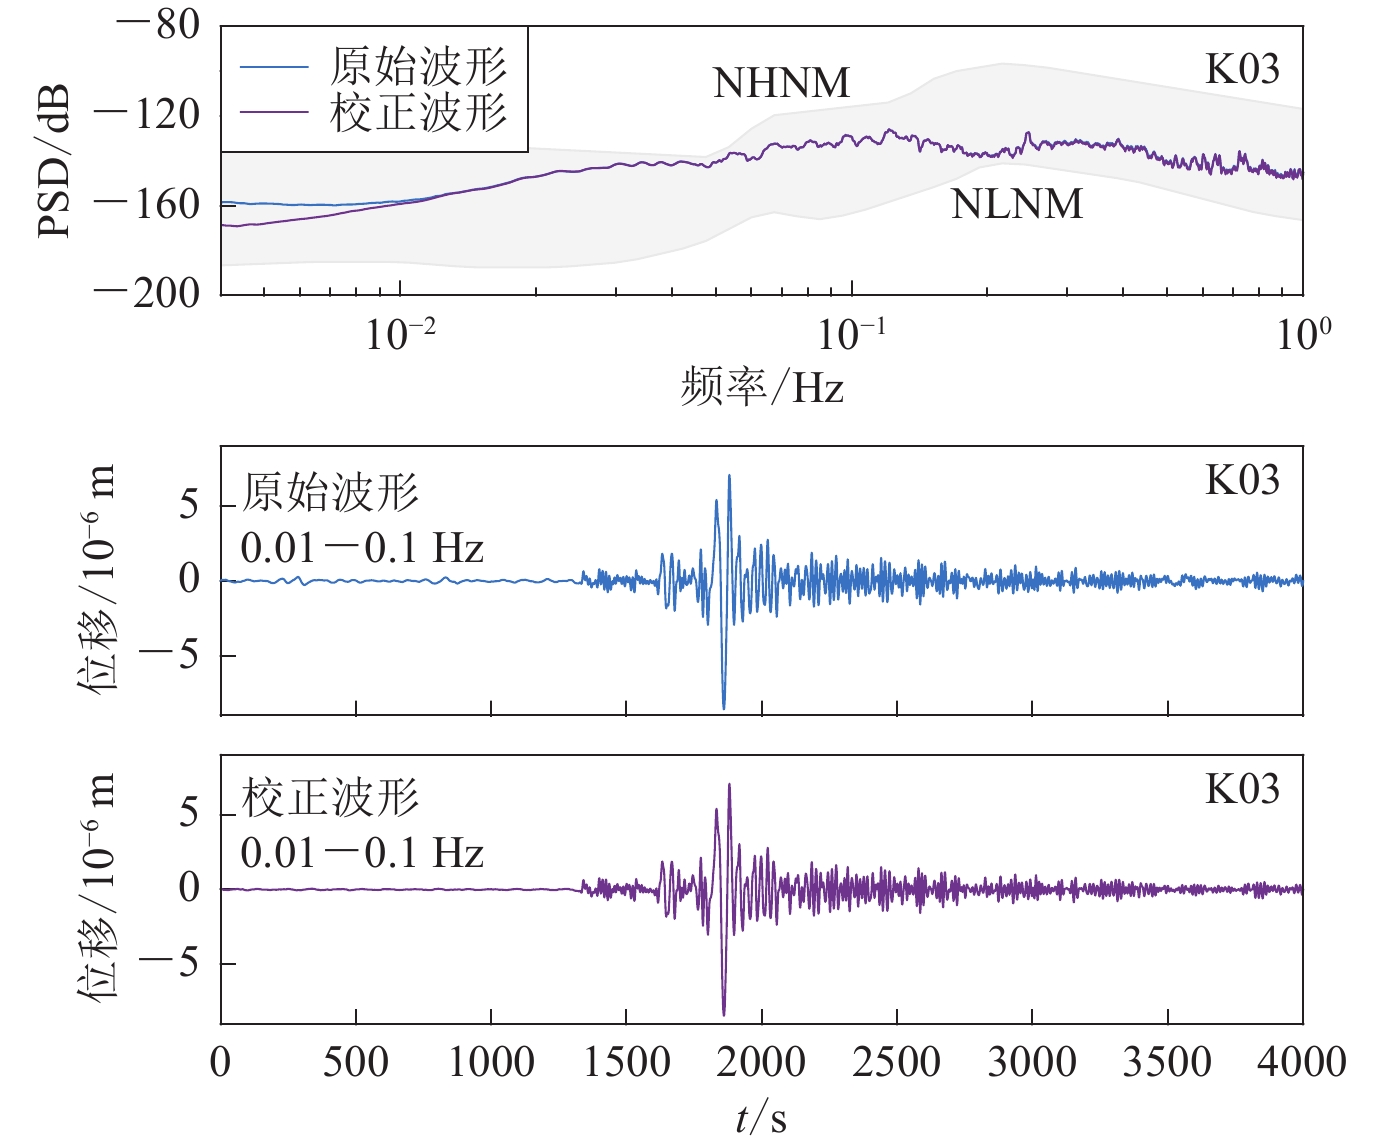
地震计的倾斜角度对OBS垂直分量数据的倾斜噪声有着很大影响。台站K03与台站K02具有相似的倾斜特征(图9),但台站K03的倾斜角度(约0.5°)要小于台站K02 (约1.0°)。如图10所示,台站K03的数据并未表现出明显的倾斜噪声。另一台站K08,其水平分量和垂直分量噪声的相关性一直小于0.4 (刘丹等,2022),表明这一台站的地震计没有倾斜,其数据也未受到倾斜噪声的影响。由于这几台OBS布放在同一海区的相近位置(图1),受到底流等因素的影响相似,因此它们的倾斜噪声水平取决于地震计的倾斜角度,当倾斜角度约小于0.5°时,其倾斜噪声水平就很微弱,可以忽略不计。
![]() 图 9 台站K03布设期间的倾斜角度(a)及对应的相关性大小(b)Figure 9. Tilt angle (a) and corresponding coherence value (b) during station K03 deployment
图 9 台站K03布设期间的倾斜角度(a)及对应的相关性大小(b)Figure 9. Tilt angle (a) and corresponding coherence value (b) during station K03 deployment![]() 图 10 巴厘岛附近MW6.2地震去除倾斜噪声前后波形及其功率谱密度(PSD)对比Figure 10. Comparison of the waveforms and its PSDs before and after tilt noise removed of the MW6.2 earthquake occurred near Bali
图 10 巴厘岛附近MW6.2地震去除倾斜噪声前后波形及其功率谱密度(PSD)对比Figure 10. Comparison of the waveforms and its PSDs before and after tilt noise removed of the MW6.2 earthquake occurred near Bali上述分析表明OBS的调平精度严重影响了仪器的数据质量。在OBS布放初期地震计调平并锁紧后,由于海底的复杂环境OBS很可能会再次倾斜,例如,地震计在海底沉积物中逐渐发生不均匀沉降。因此,对于实际观测的OBS来说,除了精准的调平系统以外,还需要定期监测地震计的倾斜角度,当倾斜角度超过设定阈值时重新调平是降低OBS数据倾斜噪声的有效方案(刘丹等,2022;Liu et al,2023)。
4.2 海底底流对倾斜噪声的影响
屏蔽OBS的地震计模块,使得底流不直接作用于地震计,可以大大降低OBS数据的噪声水平(Bell et al,2015),最近作者的OBS水槽实验也证实了这一点。而南科大的磐鲲正是这种将地震计屏蔽在其内部的OBS,磐鲲OBS的地震计不应受到底流的影响。然而,通过对台站K02的分析,磐鲲OBS还是产生了较为明显的倾斜噪声。
这一现象产生的原因可能是由于底流与实际海底之间相互作用并不像刚性基底水槽中那样简单。实验室水槽中的水流厚度较低,且水流速度在各深度基本相同,而实际海底会形成厚度为几米到几十米的底流边界湍流层。因此,海底底流中的地震计会记录两个分量,一个是水流直接作用在地震计上绕流产生的波动,另一个是地震计附近更大范围内湍流产生的波动。越接近海底,底流流速越低,因此OBS记录的因绕流产生的波动较小,但与海底边界层中的湍流涡旋相关的波动不会朝着海底逐渐减小,因此,海底地震仪记录到的压力波动可能占主要地位(Webb,1988)。对于磐鲲OBS来说,绕流产生的噪声基本被完全屏蔽了,但湍流涡旋在地震计周边产生的压力波动并没有降低,这种压力波动可能通过海底或者屏蔽空间内的水体传至地震计,产生了较明显的倾斜噪声。
此外,底流一直被认为是倾斜噪声的重要来源,但尚无观测数据证明底流是倾斜噪声的唯一来源。当仪器发生倾斜时,其它因素导致的水平噪声也有可能“泄漏”至垂直分量从而产生倾斜噪声,例如,次重力波也会产生水平分量的噪声(Webb,1998)。因此,磐鲲OBS的倾斜噪声来源也可能是底流之外的其它因素。
若要进一步研究倾斜噪声与海底底流的关系,还需要在OBS附近同时观测海底底流以及设置地震计有无屏蔽的对照实验。
4.3 结论
受多个因素影响,OBS的地震计在海底并不总是能够实现理想的调平(如Liu et al,2014;Hung et al,2019),在底流作用下,OBS数据中常常含有不同程度的倾斜噪声。利用旋转的水平分量(H分量)与垂直分量(Z分量)之间的传递函数可以得到OBS的倾斜特征,并且可以在很大程度上去除垂直分量上的倾斜噪声,提高OBS的数据质量,尤其可以提高地震波形在低频段的信噪比。
对于原始记录中震相较为清晰的地震事件,去除倾斜噪声可以进一步提高地震波形的信噪比,使其达到与附近陆地台站相当的波形质量。而对于在原始记录中震相不够清晰的地震事件,去除倾斜噪声可以大幅提高地震波形的质量,使得地震波形震相较为清晰,其瑞雷波的频散特征更有利于进行深部岩石圈和上地幔的速度结构成像。
尽管去除倾斜噪声可以提高OBS记录的垂直分量地震波形的信噪比,但是对于水平分量上的噪声却无能为力。如何提高OBS水平分量数据的信噪比,是一个更大的挑战。这需要通过OBS与海底更好地耦合,降低底流对OBS的影响等技术问题的解决来实现。未来OBS数据质量的进一步提高离不开技术的进步,而高质量的OBS数据也会持续推动地震学和海洋地球物理学的进一步发展。
-
![]()
图 2 2020年3月18日垂直(a)和水平(b,c)分量的频谱及噪声时间窗选择(d)
图(d)中的方块表示窗口被接受,而方块的缺失(箭头所示)表示窗口未通过基于日平均值设置的阈值
Figure 2. Spectrogram for the vertical (a) and horizontal (b,c) components,and the noise time windows selection (d) on 18th March,2020
A square in fig. (d) indicates that the window is accepted, while the absence of a square (indicated by the arrow) indicates that the window does not pass the threshold set based on the daily average
![]()
图 3 台站K02布设期间水平与垂直分量的最大相关性方向(a)和对应的相关大小(b)
图(a)中的倾斜方向为相对水平分量1顺时针转过的角度
Figure 3. Maximum coherence direction (a) and corresponding coherence value (b) of the horizontal to vertical component during station K02 deployment
The tilt direction in fig.(a) represents the degrees turned clockwise relative to the horizontal component 1
![]()
图 4 水平到垂直分量传递函数的增益系数(a)、相关性(b)和相位(c)
Figure 4. Admittance (a),coherence (b) and phase (c) of the horizontal to vertical component transfer function
![]()
图 5 台站K02布设期间的倾斜角度(a)和其对应的相关性(b)
Figure 5. Tilt angle (a) and corresponding coherence value (b) during station K02 deployment
![]()
图 6 去除倾斜噪声前后波形(滤波至0.01—0.1 Hz)及其功率谱密度 (PSD) 对比
(a) 2020年3月18日巴厘岛南部附近发生的MW6.2地震;(b) 2019年12月25日东太平洋海隆南部附近发生的MW6.1地震
Figure 6. Comparison of waveforms (filtered at 0.01−0.1 Hz) and its PSDs before and after tilt noise removed
(a) MW6.2 earthquake occurred near the south of Bali on March 18,2020;(b) MW6.1 earthquake occurred near the southern East Pacific Rise on December 25,2019
![]()
图 7 巴厘岛附近MW6.2地震和台站位置(a)及去除倾斜噪声后垂直分量波形与附近陆地台站对比(b)(滤波至0.01—0.1 Hz)
Figure 7. The MW6.2 earthquake near Bali and station locations (a) and comparison of vertical component waveforms after tilt noise removed with nearby land stations (b)(filtered at 0.01−0.1 Hz)
![]()
图 8 原始地震波形(a)与去除倾斜噪声后的地震波形(b)的频散特征
Figure 8. Dispersion characteristics of the raw seismic waveform (a) and the seismic waveform after tilt noise removed (b)
![]()
图 9 台站K03布设期间的倾斜角度(a)及对应的相关性大小(b)
Figure 9. Tilt angle (a) and corresponding coherence value (b) during station K03 deployment
-
刘丹,杨挺,黎伯孟,吴越楚,王宜志,黄信锋,杜浩然,王建,陈永顺. 2022. 分体式宽频带海底地震仪的研制、测试和数据质量分析[J]. 地球物理学报,65(7):2560–2572. Liu D,Yang T,Le B M,Wu Y C,Wang Y Z,Huang X F,Du H R,Wang J,Chen Y S. 2022. Seismometer-detached broadband ocean bottom seismograph (OBS):Development,test,and data quality analysis[J]. Chinese Journal of Geophysics,65(7):2560–2572 (in Chinese).
Agius M R,Rychert C A,Harmon N,Laske G. 2017. Mapping the mantle transition zone beneath Hawaii from PS receiver functions:Evidence for a hot plume and cold mantle downwellings[J]. Earth Planet Sci Lett,474:226–236. doi: 10.1016/j.jpgl.2017.06.033
An C,Cai C,Zhou L,Yang T. 2021. Characteristics of low-frequency horizontal noise of ocean-bottom seismic data[J]. Seismol Res Lett,93(1):257–267. doi: 10.1785/0220200349
Bell S W,Forsyth D W,Ruan Y Y. 2015. Removing noise from the vertical component records of ocean-bottom seismometers:Results from year one of the Cascadia Initiative[J]. Bull Seismol Soc Am,105(1):300–313. doi: 10.1785/0120140054
Bell S,Ruan Y Y,Forsyth D W. 2016. Ridge asymmetry and deep aqueous alteration at the trench observed from Rayleigh wave tomography of the Juan de Fuca plate[J]. J Geophys Res:Solid Earth,121(10):7298–7321. doi: 10.1002/2016JB012990
Bendat J S, Piersol A G. 1986. Random Data: Analysis and Measurement Procedures[M]. 2nd ed. Hoboken, New Jersey: John Wiley and Sons.
Bowden D C,Kohler M D,Tsai V C,Weeraratne D S. 2016. Offshore southern California lithospheric velocity structure from noise cross-correlation functions[J]. J Geophys Res:Solid Earth,121(5):3415–3427. doi: 10.1002/2016JB012919
Cai C,Wiens D A,Shen W S,Eimer M. 2018. Water input into the Mariana subduction zone estimated from ocean-bottom seismic data[J]. Nature,563(7731):389–392. doi: 10.1038/s41586-018-0655-4
Collins J A,Vernon F L,Orcutt J A,Stephen R A,Peal K R,Wooding F B,Spiess F N,Hildebrand J A. 2001. Broadband seismology in the oceans:Lessons from the ocean seismic network pilot experiment[J]. Geophys Res Lett,28(1):49–52. doi: 10.1029/2000GL011638
Crawford W C,Webb S C. 2000. Identifying and removing tilt noise from low-frequency (<0.1 Hz) seafloor vertical seismic data[J]. Bull Seismol Soc Am,90(4):952–963. doi: 10.1785/0119990121
Doran A K,Laske G. 2019. Seismic structure of marine sediments and upper oceanic crust surrounding Hawaii[J]. J Geophys Res:Solid Earth,124(2):2038–2056. doi: 10.1029/2018JB016548
Duennebier F K,Blackinton G,Sutton G H. 1981. Current-generated noise recorded on ocean bottom seismometers[J]. Mar Geophys Res,5(1):109–115. doi: 10.1007/BF00310316
Eilon Z C,Gaherty J B,Zhang L,Russell J,McPeak S,Phillips J,Forsyth D W,Ekström G. 2022. The Pacific OBS research into convecting asthenosphere (ORCA) experiment[J]. Seismol Res Lett,93(1):477–493. doi: 10.1785/0220210173
Hung T D,Yang T,Le B M,Yu Y Q. 2019. Effects of failure of the ocean-bottom seismograph leveling system on receiver function analysis[J]. Seismol Res Lett,90(3):1191–1199. doi: 10.1785/0220180276
Janiszewski H A,Gaherty J B,Abers G A,Gao H,Eilon Z C. 2019. Amphibious surface-wave phase-velocity measurements of the Cascadia subduction zone[J]. Geophys J Int,217(3):1929–1948. doi: 10.1093/gji/ggz051
Liu C G,Hua Q F,Pei Y L,Yang T,Xia S H,Xue M,Le B M,Huo D,Liu F,Huang H B. 2014. Passive-source ocean bottom seismograph (OBS) array experiment in South China Sea and data quality analyses[J]. Chinese Science Bull,59(33):4524–4535. doi: 10.1007/s11434-014-0369-4
Liu D,Yang T,Wang Y,Wu Y,Huang X. 2023. Pankun:A New Generation of Broadband Ocean Bottom Seismograph[J]. Sensors,23(11):4995. doi: 10.3390/s23114995
Lin P Y P,Gaherty J B,Jin G,Collins J A,Lizarralde D,Evans R L,Hirth G. 2016. High-resolution seismic constraints on flow dynamics in the oceanic asthenosphere[J]. Nature,535(7613):538–541. doi: 10.1038/nature18012
Moore R D,Dorman L M,Huang C Y,Berliner D L. 1981. An ocean bottom,microprocessor based seismometer[J]. Mar Geophys Res,4(4):451–477. doi: 10.1007/BF00286039
Peterson J R. 1993. Observations and Modeling of Seismic Background Noise[R]. Albuquerque: U. S. Geological Survey.
Shiobara H,Kanazawa T,Isse T. 2013. New step for broadband seismic observation on the seafloor:BBOBS-NX[J]. IEEE J Oceanic Eng,38(2):396–405. doi: 10.1109/JOE.2012.2222792
Stähler S C,Sigloch K,Hosseini K,Crawford W C,Barruol G,Schmidt-Aursch M C,Tsekhmistrenko M,Scholz J R,Mazzullo A,Deen M. 2016. Performance report of the RHUM-RUM ocean bottom seismometer network around La Réunion,western Indian Ocean[J]. Adv Geosci,41:43–63. doi: 10.5194/adgeo-41-43-2016
Stephen R A, Spiess F N, Collins J A, Hildebrand J A, Orcutt J A, Peal K R, Vernon F L, Wooding F B. 2003. Ocean seismic network pilot experiment[J]. Geochem Geophys Geosyst, 4(10). doi: 10.1029/2002gc000485.
Tian Y,Ritzwoller M H. 2017. Improving ambient noise cross-correlations in the noisy ocean bottom environment of the Juan de Fuca plate[J]. Geophys J Int,210(3):1787–1805. doi: 10.1093/gji/ggx281
Toomey D R,Allen R M,Barclay A H,Bell S W,Bromirski P D,Carlson R L,Chen X W,Collins J A,Dziak R P,Evers B,Forsyth DW,Gerstoft P,Hooft E E E,Livelybrooks D,Lodewyk J A,Luther D S,McGuire J J,Schwartz S Y,Tolstoy M,Tréhu A M,Weirathmueller M,Wilcock W S D. 2014. The Cascadia initiative:A sea change in seismological studies of subduction zones[J]. Oceanography,27(2):138–150. doi: 10.5670/oceanog.2014.49
Wang Y Z,Yang T,Wu Y C,Liu D,Huang X F,Wang J,Zhong W X,Shou H T,Zhou Y,Chen Y S. 2022. A new broad-band ocean bottom seismograph and characteristics of the seismic ambient noise on the South China Sea seafloor based on its recordings[J]. Geophys J Int,230(1):684–695. doi: 10.1093/gji/ggac092
Webb S C. 1988. Long-period acoustic and seismic measurements and ocean floor currents[J]. IEEE J Oceanic Eng,13(4):263–270. doi: 10.1109/48.9239
Webb S C. 1998. Broadband seismology and noise under the ocean[J]. Rev Geophys,36(1):105–142. doi: 10.1029/97RG02287
Webb S C,Crawford W C. 1999. Long-period seafloor seismology and deformation under ocean waves[J]. Bull Seismol Soc Am,89(6):1535–1542. doi: 10.1785/BSSA0890061535
Wooding F B,Peal K R,Collins J A. 2001. Seafloor seismometer burial[J]. Sea Technol,42(8):10–13.
Yang Z H, Sheehan A F, Collins J A, Laske G. 2012. The character of seafloor ambient noise recorded offshore New Zealand: Results from the MOANA ocean bottom seismic experiment[J]. Geochem Geophys Geosyst, 13(10). doi: 10.1029/2012gc004201.
-
期刊类型引用(1)
1. 刘丹,杨挺,吴越楚,王宜志,林俊国. 应用于宽频带海底地震仪的低频差分压力传感器的研制. 地球物理学报. 2025(04): 1367-1380 .  百度学术
百度学术
其他类型引用(0)
 下载:
下载:


计量
- 文章访问数: 679
- HTML全文浏览量: 247
- PDF下载量: 196
- 被引次数: 1
