

Relative motions between cross-fault sites resultd from the 1999 MW7.6 Taiwan Chi-Chi earthquake
-
摘要:
为了获得近断层地震动准确的残余位移信息,提出了一种变步长网格搜索地震动基线校正方法。首先基于1999年我国台湾MW7.6集集地震强震动数据,探讨了近断层地震动的位移特征,然后通过地震动时程初始时刻的校正获得了集集地震多组上、下盘台站之间的相对运动时程数据,分析了分别靠近断层上、下盘场地之间相对运动的位移时程特征。结果显示:近断层地震动的滑冲效应显著,断层的平均滑冲速度可高达1.4 m/s;断层两盘间的相对运动类似于近断层地震动的运动特征,且幅值更大;近断层的残余位移约是断层两盘间最大相对位移的80%.
-
关键词:
- 1999年集集MW7.6地震 /
- 近断层地震动 /
- 跨断层场地 /
- 相对运动 /
- 断层作用
Abstract:In order to obtain more accurate residual displacement information generated by near-fault ground motion, this paper proposed a variable step-grid search method for ground motion baseline correction. The core of this method lies in preserving and accurately reflecting the residual displacement information of faults, and solving the problem of extremely low computational efficiency in traditional grid search methods when there are many digital seismic sampling points. Based on the strong ground motion data of the 1999 MW7.6 Chi-Chi earthquake in Taiwan region, this paper uses the variable step-grid search method for ground motion baseline correction to conduct in-depth research on the ground motion displacement characteristics near faults. By accurately correcting the initial moment of ground motion time history, this study successfully obtained relative ground motion time history data between multiple sets of the hanging and foot wall stations in the Chi-Chi earthquake. And based on this data, the displacement time history characteristics of the relative motion between the hanging and foot wall sites near the fault were analyzed. The research results indicate that the fling-step effect of ground motion is particularly significant in the Chi-Chi earthquake. The maximum displacement and residual displacement of near fault ground motion exceed 8 m and 6 m, respectively, and the average sliding velocity of the fault is as high as 1.4 m/s, fully demonstrating the strong destructive force of the earthquake. This poses challenges to the numerical simulation of fault rupture and related experimental researches. In addition, the relative motion between fault walls also exhibits similar motion characteristics to near fault ground motion, and its amplitude is larger. Therefore, the relative motion data between earthquake fault walls can refer to the time history of near fault ground motion as the input basis for engineering design and analysis. In addition, the residual displacement of the fault is about 80% of the maximum relative displacement between the fault walls. This study provides important information on residual displacement of fault ground motion, which is of great significance to the researches on fields such as earthquake engineering, earthquake warning, and disaster assessment.
-
引言
夏垫断裂位于北京东南偏南的廊坊市附近,是该地区的主要活动断层,具有发生强震的危险,而这些地震会对北京市及其周边的人口稠密地区构成威胁(黄秀铭等,1991;焦青,邱泽华,2006;Zhang,Wang,2017)。已有研究表明夏垫断裂为大厂隐伏盆地的边界控制性断裂,是由从古近纪伸展变形到新近纪以来压剪构造环境下的应变动态变化所致,现在仍处于活动状态(冉勇康等,1997;徐锡伟等,2005;吴晶等,2007)。该断裂走向北东—北东东,呈上陡下缓的趋势,构造性质属于正断层,从深部到浅部倾角逐渐减小(江娃利等,2000;张先康等,2002;赵金仁等,2004;何付兵等,2013;雍凡等,2014;李赫等,2020))。夏垫断裂南北向长约120 km,向西南方向延伸至文安,可能与霸县—束鹿—邯郸断裂带发生相互作用,这些断裂与夏垫断裂一起构成夏垫断裂带(杨晓平等,2012;冉志杰等,2013;李赫等,2020)。
在夏垫断裂上开展的钻井和探槽开挖研究结果(张晚霞等,1995)显示夏垫断裂呈东南盘下降、西北盘抬升的正断倾滑性质,兼有右旋走滑分量。高景华等(2007)通过浅层地震勘探成功地探测到夏垫断裂的南段及其上断点,为隐伏夏垫断裂的地质构造、区域活动性特点等的进一步研究提供了可靠的依据。长期研究显示夏垫断裂两侧的灾害状况差异极大,产生的差异源于地层结构、沉积物高度和反射波能量等方面(高振寰,1979;Sun et al,1998;赵金仁等,2004;刘保金等,2009;毛昌伟等,2010;杨晓平等,2012),因此,从纵向和横向上来看震源区均处于地壳结构差异明显的接触带上,该接触带进而也可能成为孕育大地震的有利区域(Li et al,2012;Yu et al,2019)。同样,力学研究结果也表明,夏垫断裂是未来可能发生强震的关键之地(Stein et al,1997;Harris,2000;沈正康等,2004;Robinson,Zhou,2005;Liu et al,2007;Karakostas et al,2013)。
关于夏垫断裂未来活动性方面的研究主要有:高景华等(2008)经由探测试验得到夏垫断裂在1679年三河—平谷地震震源西南方向约3 km处的活动性减弱;肖修来等(2017)基于G-R关系利用最小二乘法对华北地区和三河—平谷地区的地震复发周期进行时间扫描计算,计算结果表明两地区的地震活动性自1976年唐山地震以来趋于稳定;余中元等(2020)采用时间相依的布朗模型、随机特征滑动模型和通用模型对断层破裂源上特征型地震活动的时间相依特征开展研究,其结果也表明夏垫断裂在未来三十年内发生强震活动的可能性较低。虽然强震发生的可能性较低意味着夏垫断裂的活动性较弱,但强震复发间隔和同震位移均有很大的不确定性,所以夏垫断裂的地震危险性仍然有必要进一步分析。
为了评估夏垫断裂潜在的地震危险性,诸多科研人员针对夏垫断裂开展了多方面的研究,包括其复杂的断裂行为、对大地震分布的控制以及与潜在地震风险评估的内在关系,还有该断裂的构造演化历史、地壳上地幔速度结构、地球化学特征以及断裂形成和变形机制(高清武,李霓,1998;刘博研等,2007;刘保金等,2009;雍凡等,2014;张培震等,2014;Wang et al,2014)。与此同时,夏垫断裂活动构造的几何结构特征和运动学、其最新活动期、全新世的古地震活动、晚第四纪的构造变形和分段以及强震模拟和地震危险性预测方面的研究也在展开(冉勇康等,1997;张先康等,2002;邓起东等,2003;徐锡伟等,2005;张培震等,2014;Wang et al,2014)。此外,前人还通过二十世纪九十年代分布在夏垫断裂带上的东六合屯村、潘各庄村和齐辛庄村的沟渠进行了地震危险性分析参数的研究(冉勇康等,1997;江娃利等,2000)。这些研究对于夏垫断裂所在地区的地震危险性分析和未来地震活动预测都具有重要意义。
本文拟在上述研究的基础上,利用多震源、多破裂方式对夏垫断裂开展地震动模拟,分析通州城区和北京中心城区可能发生的地震动灾害,为首都圈地震危险性分析提供理论支撑。
1. 方法
随机有限断层法广泛应用于地震动预测模型的构建中,其基本思想是将一个断层分成N个可视为点源的子断层,最终按照一定的时间延迟将各子断层的地震动模拟结果叠加起来即可得到整个大断层的模拟地震动效应(Beresnev,Atkinson,1997)。针对传统的随机有限断层法的模拟结果仅在高频部分可靠,Zhou和Chang (2019)提出了NNSIM (non-uniform stress and non-uniform window function simulation method)随机有限断层法,该方法与传统的随机有限断层法的不同主要在于:一是用不同源时间函数替换每个点源特定的时间函数,从而提高了低频模拟部分结果的可靠性;二是加入变化的应力降,以减少单个应力降在模拟过程中所产生的影响,使最终的模拟结果更加接近于实际情况。
NNSIM随机有限断层法沿用传统随机有限断层法的叠加思想,先把整个断层分为N个子断层,并将每个子断层看作一个点源,按照特定破裂模式和速度下的时间顺序,分别叠加子断层的模拟结果,从而得到有限断层破裂的的地震动效应。
$$ a ( t ) =\sum _{i=1}^{n_{\rm{l}}}\sum _{j=1}^{n_{\rm{w}}}{a}_{ij} ( t+\Delta {t}_{ij} ) \text{,}$$ (1) 式中:nl和nw分别表示断层在长和宽两个方向上划分的子断层个数,∆tij为第ij个子断层点源到观测点的相对延时,aij (t)是在第
$ ij $ 个子断层上用随机点源法计算得到的地震加速度,a(t)为大断层在观测点的模拟加速度。计算第ij个子源产生的地震动aij (t)时,需要使用非均匀拐角频率(Zhou,Chang,2019),第ij个子源的角频率为$$ {f}_{ij}=4.9{\text{×}} {10}^{6}\beta {\sqrt[3]{{\frac{{\Delta {\sigma _{ij}}}}{{{M_{0ij}}}}}}} ,$$ (2) 式中,∆σij和M0ij分别表示第ij个子断层的应力降和地震矩,其中下标ij表示各子源的地震矩和应力降不相同。Δσij由Andrews (1980)的位错与应力降之间的数学关系式计算得到。NNSIM方法的详情请参阅之前相关研究(周红,2018;Zhou,Chang,2019;周红等,2021)。
2. 多震源设定
我们在前人研究(高孟潭等,2002;潘波等,2006,2009;刘博研等,2007;付长华等,2012;巴振宁等,2022)的基础上,将此次研究区域选取为夏垫断裂中间部分,该部分总长度约为80 km,宽度约为25 km。选取MW7.9,MW7.8和MW7.5等三个震级,每个震级均分别按照多震源、多破裂的方式进行模拟。Somerville等(1999)指出震级大于M7.5时进行地震动模拟应当设置两个凹凸体,本文依此均设置两个凹凸体进行模拟。各震级的破裂模式按照Somerville等(1999)的震源设定方式来确定。具体设定方法如下:① 凹凸体为两个;② 两个凹凸体面积占总破裂面积的22%;③ 凹凸体破裂地震矩占总破裂地震矩的44%;④ 宏观震中处于主凹凸体之外;⑤ 主凹凸体面积占总破裂面积的17.5%。按照上面的震源设定方式,将夏垫断层均分成80个子断层,每个断层为5 km×5 km。按照凹凸体面积比例,得出主凹凸体的大小为350 km2,对应14个子断层,次凹凸体大小为90 km2,对应4个子断层,凹凸体位错为平均位错的两倍,其余62个子断层为背景位错。设置主凹凸体与次凹凸体在80个子断层上充分排列组合,且主、次凹凸体所对应的子断层不能重合,也不位于最边缘,按照这种分布方式,用排列组合的方法计算得到满足条件的破裂方式共有180种。本研究中断层模型兼顾走滑与倾滑的性质(向宏发等,1988;张先康等,2002),断层中每个凹凸体的埋深受倾角的影响不尽相同,设置顶点的埋深为1 km。
3. 夏垫断裂MW7.8和MW7.9地震的强地震动分析
夏垫断裂上发生于1679年的三河—平谷地震应该是弱MW7.9或强MW7.8的一次巨震。因此我们有必要评估如果夏垫断裂上再次发生这样的巨震会引起怎样的强地面运动,又会导致何等破坏。
如何评估夏垫断裂上未来可能发生的MW7.9和MW7.8地震的地震动?由于任何一次特定破裂模式的震源所激发的强地面运动不足以代表某一震级地震产生的地震动,而仅能代表特定破裂模式本身产生的地震动,因此对于某个震级引起的地震动变化,需要引用多破裂模式总体讨论该震级地震所产生的地震动变化。利用Zhou和Chang (2019)提出的NNSIM随机有限断层法,按照Somerville等(1999)的震源设定方式,最大凹凸体中心位于宏观震中之外,我们限定最大凹凸体在宏观震中的西南,这样对于夏垫断裂上可能的MW7.9和MW7.8复发地震的地震动,满足该限制条件的设定破裂模式共180种。下面我们将讨论这180种破裂模式的总体效果。
对于地表每个场点,分别模拟MW7.9和MW7.8地震的每个破裂模式产生的地震动。根据地震矩、应力降等参数的计算可以得到每个场点对应的振幅谱,基于该振幅谱的反傅里叶变换得到场点的地震动时程,然而由于所需相位谱是随机产生的,因此每个场点的地震动时程都需要经过多次计算才能得到比较可信的峰值。考虑到计算量,我们选取5次计算。这样,同一个震级下每个场点得到180×5个模拟结果,即900个加速度和速度记录。取每条加速度峰值(PGA)和速度峰值(PGV)或者反应谱为研究对象,讨论其空间分布特征。这里以PGA为例,每个场点900个PGA,分别取这900个PGA值的50%,60%,70%和80%分布概率所对应的PGA值即为某一震级50%,60%,70%和80%分位数的PGA值,其中50%分位数的PGA代表该场点的地震动相对较小,80%分位数的PGA代表该场点的地震动比较高,该震级大部分地震激发的地震动小于该值。
图1为MW7.8震级的四个分位数所对应的PGA分布,402 cm/s2等值线对应于Ⅸ烈度,分数位从50%增至60%,70%和80%时,Ⅸ烈度范围逐渐加大,相对应的面积分别为6.92万km2,7.23万km2,7.67万km2和11.6万km2。从图1c和1d可见:作为北京副中心的通州城区,其PGA接近831 cm/s2,对应于Ⅹ烈度圈;北京处于195 cm/s2线上,靠近Ⅺ烈度圈。图2为对应MW7.9地震50%,60%,70%和80%分位数所对应的PGA空间分布,可见:对应的Ⅸ烈度圈内的面积从10.3万km2依次增加至10.7万km2,11.2万km2,最后增至11.9万km2;Ⅺ烈度圈(图2中内红线)也有明显的增加;通州城区的PGA达到了1 000 cm/s2,在Ⅹ烈度圈里。
![]() 图 1 MW7.8地震多破裂模式下50%,60%,70%和80%分位数的地震动峰值(PGA)分布Figure 1. Distribution of 50%,60%,70% and 80% quantile PGAs at MW7.8 by multiple rupture patterns
图 1 MW7.8地震多破裂模式下50%,60%,70%和80%分位数的地震动峰值(PGA)分布Figure 1. Distribution of 50%,60%,70% and 80% quantile PGAs at MW7.8 by multiple rupture patterns![]() 图 2 MW7.9地震多破裂模式下50%,60%,70%和80% 分位数的PGA分布Figure 2. Distribution of 50%,60%,70% and 80% quantile PGAs at MW7.9 by multiple rupture patterns
图 2 MW7.9地震多破裂模式下50%,60%,70%和80% 分位数的PGA分布Figure 2. Distribution of 50%,60%,70% and 80% quantile PGAs at MW7.9 by multiple rupture patterns![]() 图 2 MW7.9地震多破裂模式下50%,60%,70%和80%分位数的PGA分布Figure 2. Distribution of 50%,60%,70% and 80% quantile PGAs at MW7.9 by multiple rupture patterns
图 2 MW7.9地震多破裂模式下50%,60%,70%和80%分位数的PGA分布Figure 2. Distribution of 50%,60%,70% and 80% quantile PGAs at MW7.9 by multiple rupture patterns4. 夏垫断裂MW7.5地震多破裂模式下的强地震动场分析
4.1 夏垫断裂多断层多破裂模式下的地震动分布
夏垫断裂真实的走向至今还不确定,多数研究成果显示夏垫断裂的总体走向处于30°—60°之间。为了使本文的讨论结果更具有代表性和普遍性,我们在多破裂模式下总体讨论MW7.5地震产生的地震动变化,再在模拟中加入走向因素,针对走向为30°,45°,55°的三条断层,研究其强地面运动的分布特征。对于每组走向断层,断层长度仍然设定为破裂长度为80 km,宽度为25 km,子断层大小为5 km×5 km。对于多震源设定部分,我们取消凹凸体位置的限制,再按照排列组合的计算方法,得出每条断层发生破裂的可能方式共有294种。
三个走向下的断层在294种破裂方式下模拟的地震动也按50%,60%,70%和80%分位数筛选,对应的地震动分布如图3—5所示。从图中显然可见地震动分布呈现如下特征:① 50%,60%,70%,80%分位数地震动均环绕断层呈近似椭圆分布;② 80%分位数地震动对应的Ⅸ度烈度圈较50%分位数地震动对应的Ⅺ度烈度圈明显增大,即分位数越大,地震动所对应的Ⅸ度烈度圈的范围越大;③ 对于通州城区而言,在断层走向为30°,45°和55°三种情况下,30°走向断层距离Ⅸ度烈度圈最近;④ 同样分位数PGA在三种断层走向下,30°走向在北京中心城区处产生的地震动峰值最大;⑤ 不管哪个走向,均在70%和80%分位数时才会产生较为明显的大于750 cm/s2的加速度,这说明分位数增高时在同一走向条件下,PGA值会随之增大。
![]() 图 3 断层走向为30°时50%,60%,70%和80%分位数下的地震动PGA分布Figure 3. PGA distribution of ground motion at 50%,60%,70% and 80% quartile due to the fault with strike 30°
图 3 断层走向为30°时50%,60%,70%和80%分位数下的地震动PGA分布Figure 3. PGA distribution of ground motion at 50%,60%,70% and 80% quartile due to the fault with strike 30°![]() 图 4 断层走向为45°时50%,60%,70%和80%分位数下的地震动PGA分布Figure 4. PGA distribution of ground motion at 50%,60% ,70% and 80% quartile due to the fault with strike 45°
图 4 断层走向为45°时50%,60%,70%和80%分位数下的地震动PGA分布Figure 4. PGA distribution of ground motion at 50%,60% ,70% and 80% quartile due to the fault with strike 45°![]() 图 5 断层走向为55°时50%,60%,70%和80%分位数下的地震动PGA分布Figure 5. PGA distribution of ground motion at 50%,60%,70%和80% quartile due to the fault with strike 55°
图 5 断层走向为55°时50%,60%,70%和80%分位数下的地震动PGA分布Figure 5. PGA distribution of ground motion at 50%,60%,70%和80% quartile due to the fault with strike 55°将三个走向断层的加速度合在一起进行综合评价,仍采用分位数方法,得到图6所示的50%,60%,70%和80%分位数的PGA分布图。相较于图3—5,变化主要表现在:① 等值线变宽,如402 cm/s2对应的Ⅸ烈度圈等值线有明显的加宽;② 由于断层南端不动,而北端发生移动,因此等值线形状由围绕断层较均匀的椭圆变成一头细一头粗的梨形,即等值线形状由于不同走向断层的加入而发生了变化,且变得更为复杂;③ 合成后的等值线值与走向为30°时的结果相差明显,说明30°走向时断层对地震动的影响占比较大;④ 此时通州城区位于402 cm/s2 PGA等值线附近,即靠近Ⅸ烈度圈。
![]() 图 6 三个走向的加速度合成后50%,60%,70%和80%分位数的下地震动PGA分布Figure 6. Distribution of PGAs of the synthesis records at 50%,60%,70% and 80% quartiles for the faults with three strikes
图 6 三个走向的加速度合成后50%,60%,70%和80%分位数的下地震动PGA分布Figure 6. Distribution of PGAs of the synthesis records at 50%,60%,70% and 80% quartiles for the faults with three strikes4.2 夏垫断裂MW7.5仿真地震破裂模式下地震动分布
Wang等①针对夏垫断裂利用滑动摩擦准则模拟了MW7.5地震的仿真破裂过程,本文将其计算结果作为发震震源,依然采用NNSIM随机有限断层法,按照第二节中的震源设定方式开展了MW7.5的地表地震动模拟。图7为模拟的加速度峰值及其反应谱分布,图8为速度峰值及其对应的反应谱分布,图中断层(黄色线框)为非规则曲面,其几何形态更接近实际断层面。对于加速度(图7),我们选择长周期(T=3 s)、中周期(T=1 s)和短周期(T=0.2 s)的反应谱作为代表以呈现加速度反应谱(pseudo-acceleration response spectrum,即 PSA)的空间分布,由图7显然可见:① 随着周期变短,PSA最大值减小,短周期(T=0.2 s)的PSA最大值超过了1 000 cm/s2,长周期(T=3 s)的PSA最大值小于100 cm/s2;② 在距离断层垂直距离20 km范围内,短周期(T=0.2 s)的PSA均超过了1 000 cm/s2,距离断层垂直距离50 km范围内短周期(T=0.2 s)的PSA均超过了400 cm/s2。图7d的PGA分布显示,仿真破裂产生了两个峰值区域(最内红圈),PGA超过750 cm/s2,Ⅸ烈度圈(第二红圈,对应402 cm/s2)的形态随内红圈变换,呈现为两头大中间小的形态;通州在Ⅸ烈度圈内,PGA达到500 cm/s2;北京中心的PGA达到160 cm/s2。
![]() 图 7 模拟MW7.5加速度峰值及其对应的不同周期T的反应谱分布Figure 7. The distribution of simulated acceleration peaks and response spectra with different period T for MW7.5
图 7 模拟MW7.5加速度峰值及其对应的不同周期T的反应谱分布Figure 7. The distribution of simulated acceleration peaks and response spectra with different period T for MW7.5![]() 图 8 模拟MW7.5速度峰值及其对应的不同周期T的反应谱分布Figure 8. Distribution of the simulated velocity peaks and response spectra with different period T for MW7.5
图 8 模拟MW7.5速度峰值及其对应的不同周期T的反应谱分布Figure 8. Distribution of the simulated velocity peaks and response spectra with different period T for MW7.5图8为模拟的MW7.5速度峰值及其对应的速度反应谱(pseudo-velocity response spectrum,即PSV)分布,可见:长周期(T=3 s)、中周期(T=1 s)和短周期(T=0.2 s)的速度反应谱PSV大致为围绕断层变化的椭圆,断层南端PSV变化大于断层北端,表现为等值线变化剧烈;中周期(T=1 s)的PSV最大值大于长周期(T=3 s)和短周期(T=0.2 s)的PSV最大值,其最大值大于100 cm/s;PGV的空间变化最为复杂,有明显的上盘效应,表现为PGV等值线向渤海方向延伸;通州的PGV约为25 cm/s,北京中心处的PGV小于10 cm/s。图7和图8显示对于模拟的MW7.5地震,其地面地震动分布复杂,Ⅸ烈度圈(图7第二红线圈)大致距离断层40—50 km。
5. 讨论与结论
夏垫断裂是影响北京地区及首都圈地震安全的最重要的断裂带,1679年曾经发生过MW8.0巨震,对北京地区产生了极为严重的破坏。本文通过全破裂模式设定震源,模拟了夏垫断裂发生强震在首都圈产生的地面运动及分布特征,可以为首都圈及其附近区域的地震预测及防震减灾工作提供参考,主要结论如下:
1) 多震级、多破裂模式的地震动模拟提供了震区各场点的地震动变化范围,较一次地震的模拟结果更可信,其模拟结果显示:夏垫断裂发生MW≥7.5地震时,地面运动Ⅸ烈度圈的范围较大,首都圈可能遭受严重的破坏,而通州城区位于Ⅸ烈度圈内,受破坏程度可能更为严重;夏垫断裂发生MW<7.9地震时,北京中心城区位于Ⅷ烈度圈外,发生MW7.9时,其位于Ⅷ烈度圈内,遭受严重破坏的可能性明显加大;
2) 基于摩擦准则提供的仿真断层破裂过程震源,可以提供更复杂的震源变化。基于仿真震源与设定震源的模拟结果量级一致,两结果可以相互印证、互为补充。
-
![]()
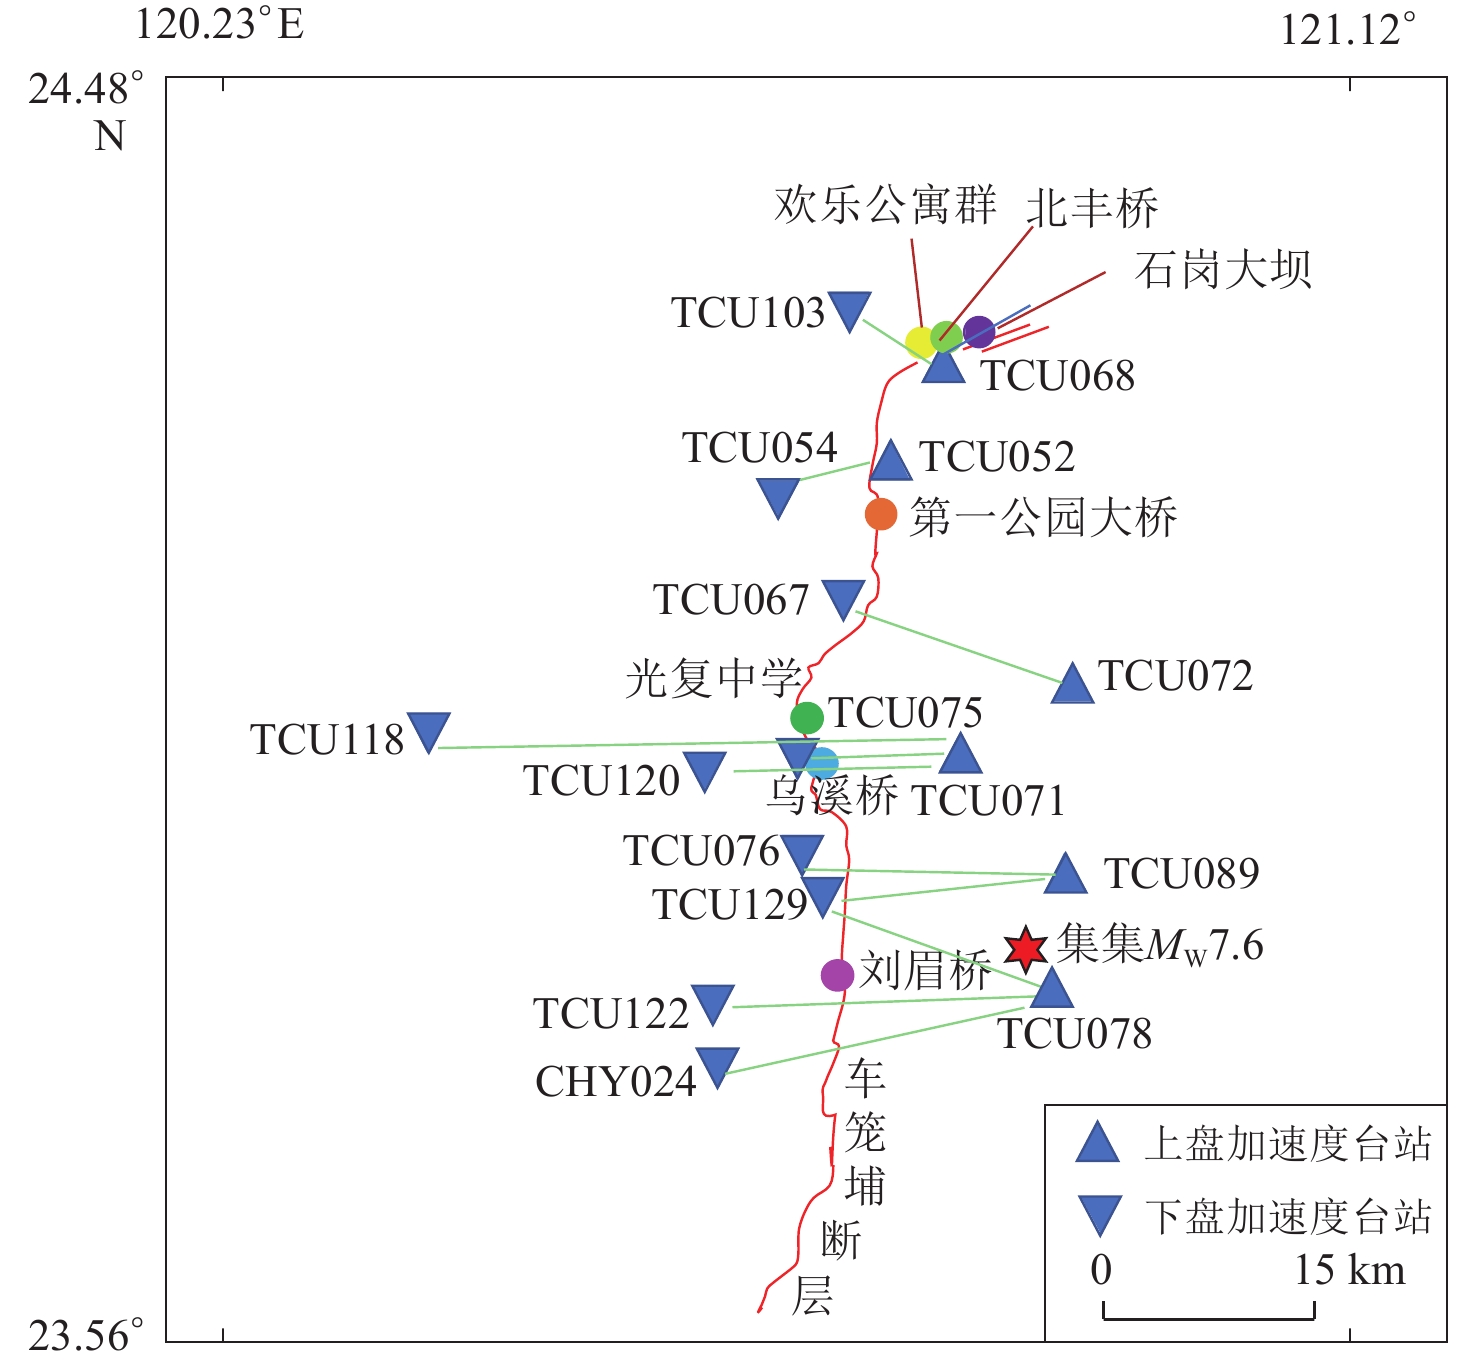
图 1 1999年9月21日台湾集集MW7.6地震断层和台站分布示意图
Figure 1. Schematic diagram of the fault and stations distribution of the MW7.6 Chi-Chi earthquake in Taiwan on 21 September 1999
![]()
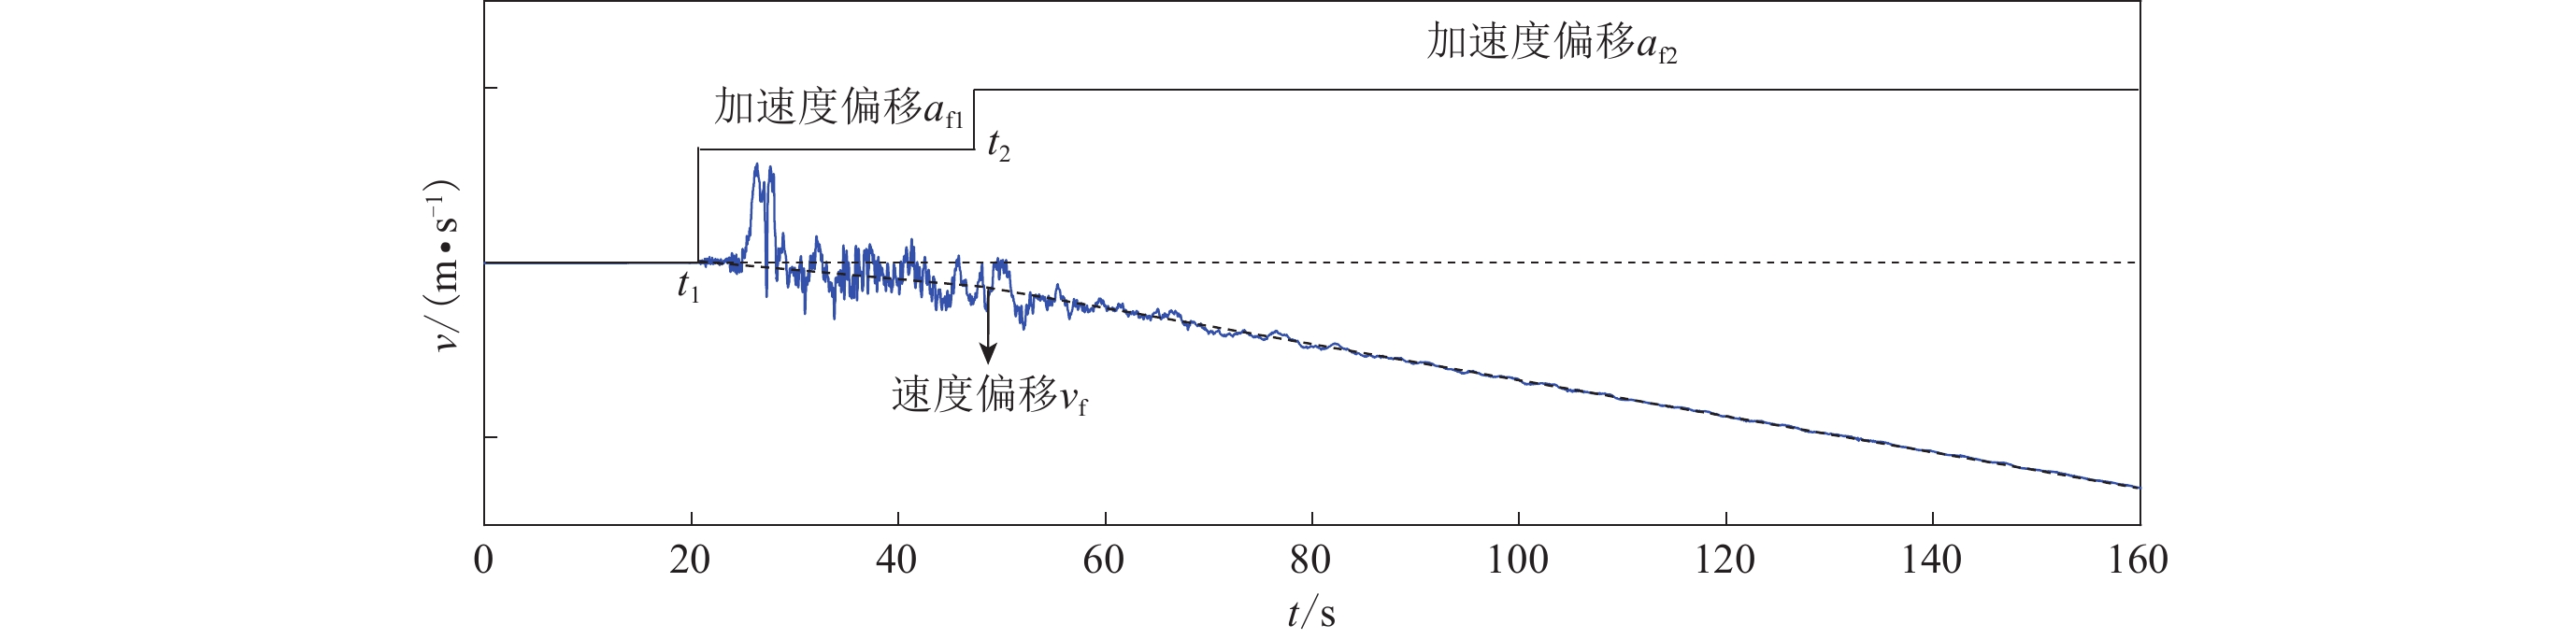
图 2 速度时程基线校正示意图
Figure 2. Schematic diagram of baseline correction for velocity time history
![]()
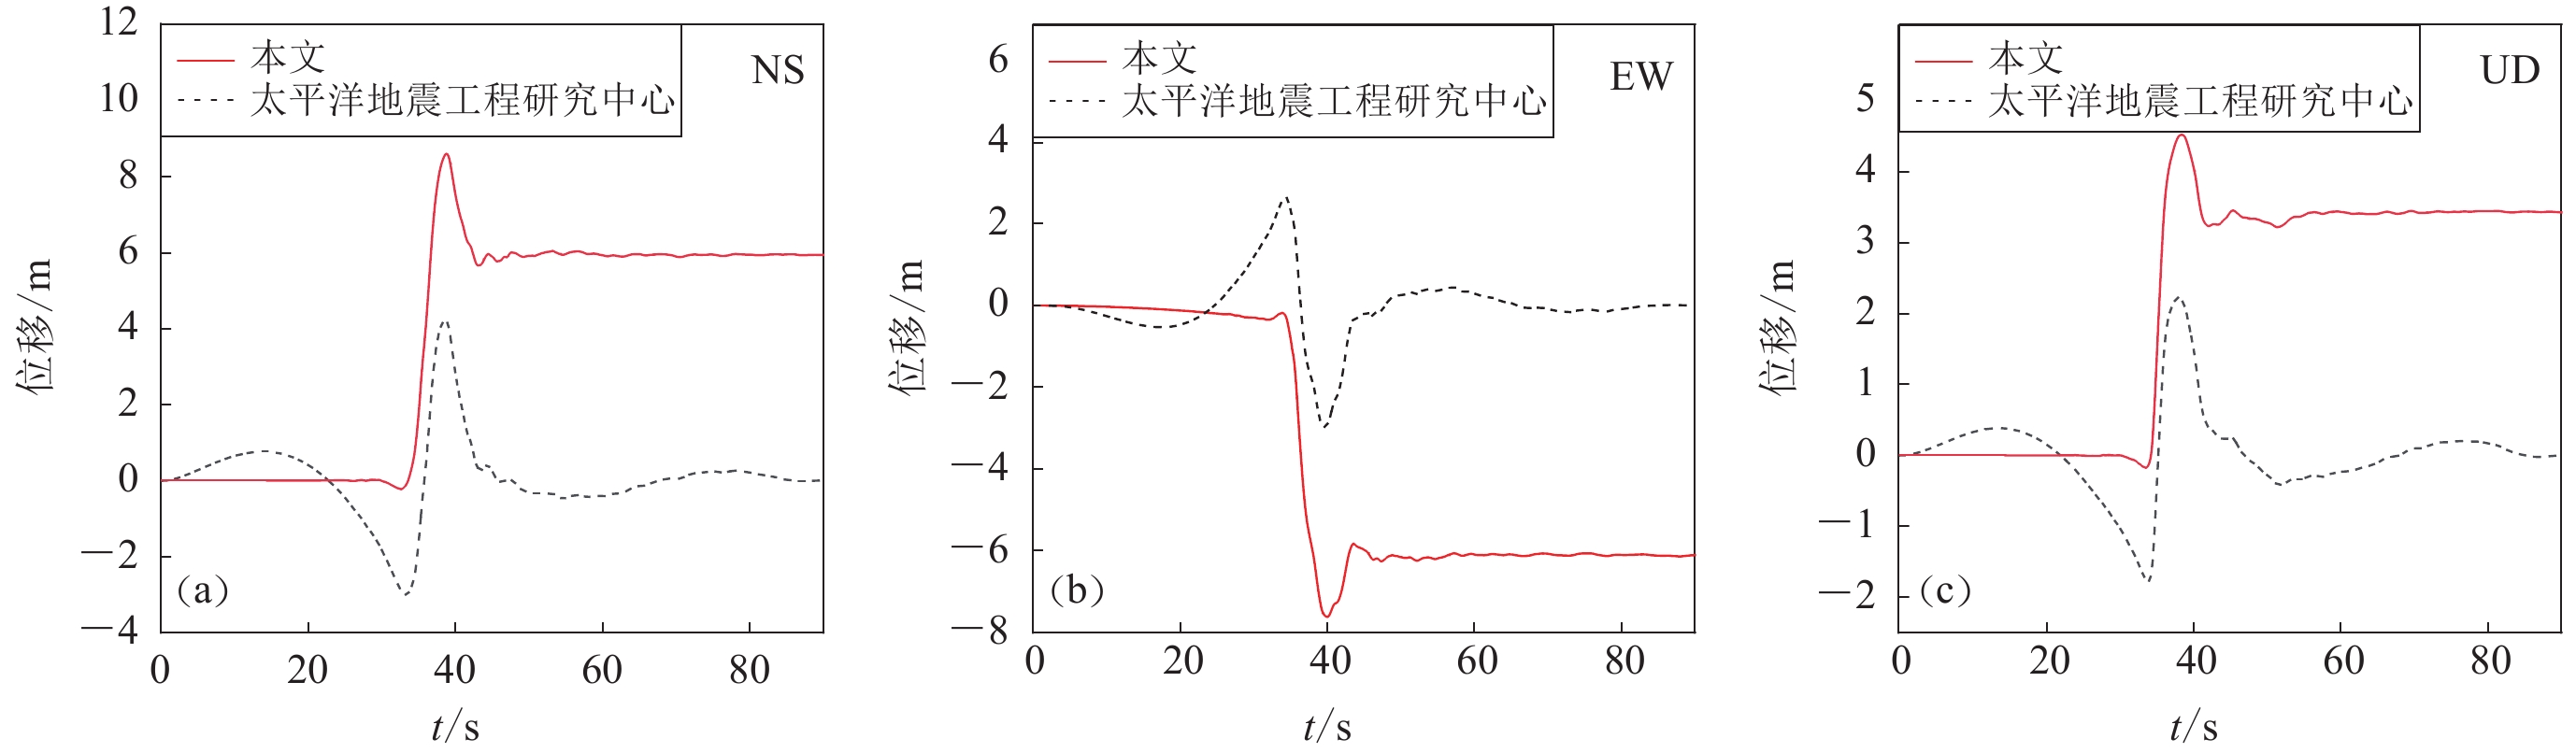
图 3 本文方法与太平洋地震工程研究中心方法处理的TCU068台站近断层地震动位移时程比较
(a) NS分量;(b) EW 分量;(c) UD 分量
Figure 3. Comparison of near fault ground motion displacement time histories of the station TCU068 processed by the method proposed in this study with those from Pacific Earthquake Engineering Research Center
(a) NS component;(b) EW component;(c) UD component
![]()
图 4 上盘台站强震动记录三分量EW (左),NS (中),UD (右)分量的位移时程
蓝线表示位移的最值,红线表示位移初始值或最终值,下图同
Figure 4. Displacement time histories of EW (left),NS (middle) and UD (right) components of strong ground motion records at the hanging wall stations
The blue line indicates the extreme displacement,and the red line indicates the initial or final displacement,the same below (c) TCU072;(d) TCU071;(e) TCU089;(f) TCU078
![]()
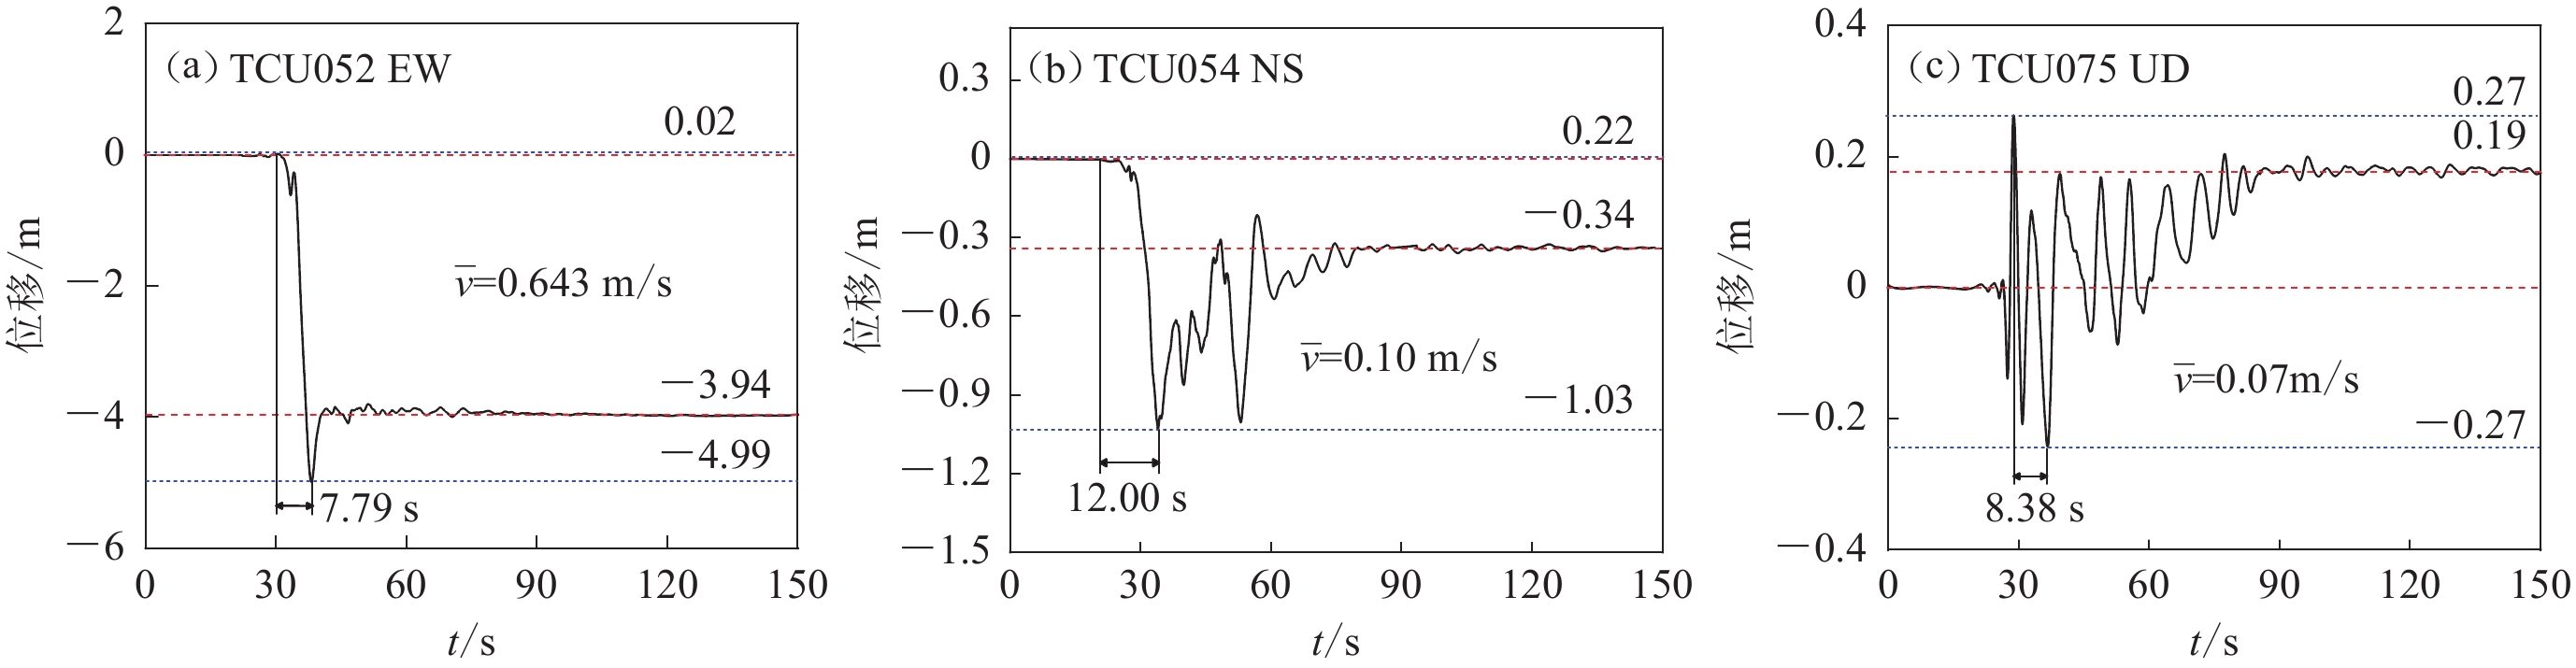
图 5 强震动位移时程形态典型特征
(a) TCU052台站EW分量;(b) TCU054台站NS分量;(c) TCU075台站UD分量
Figure 5. Typical characteristics of strong ground motion displacement time histories
(a) EW component at the station TCU052;(b) NS component at the station TCU054;(c) UD component at the station TCU075
![]()
图 6 六对上、下盘台站的EW (左),NS (中)和UD (右)分量的相对位移时程
Figure 6. The relative displacement time history of EW (left),NS (middle),and UD (right) components of the six pairs of the hanging wall and footwall stations
(e) TCU089-TCU076;(f) TCU078-TCU122
![]()
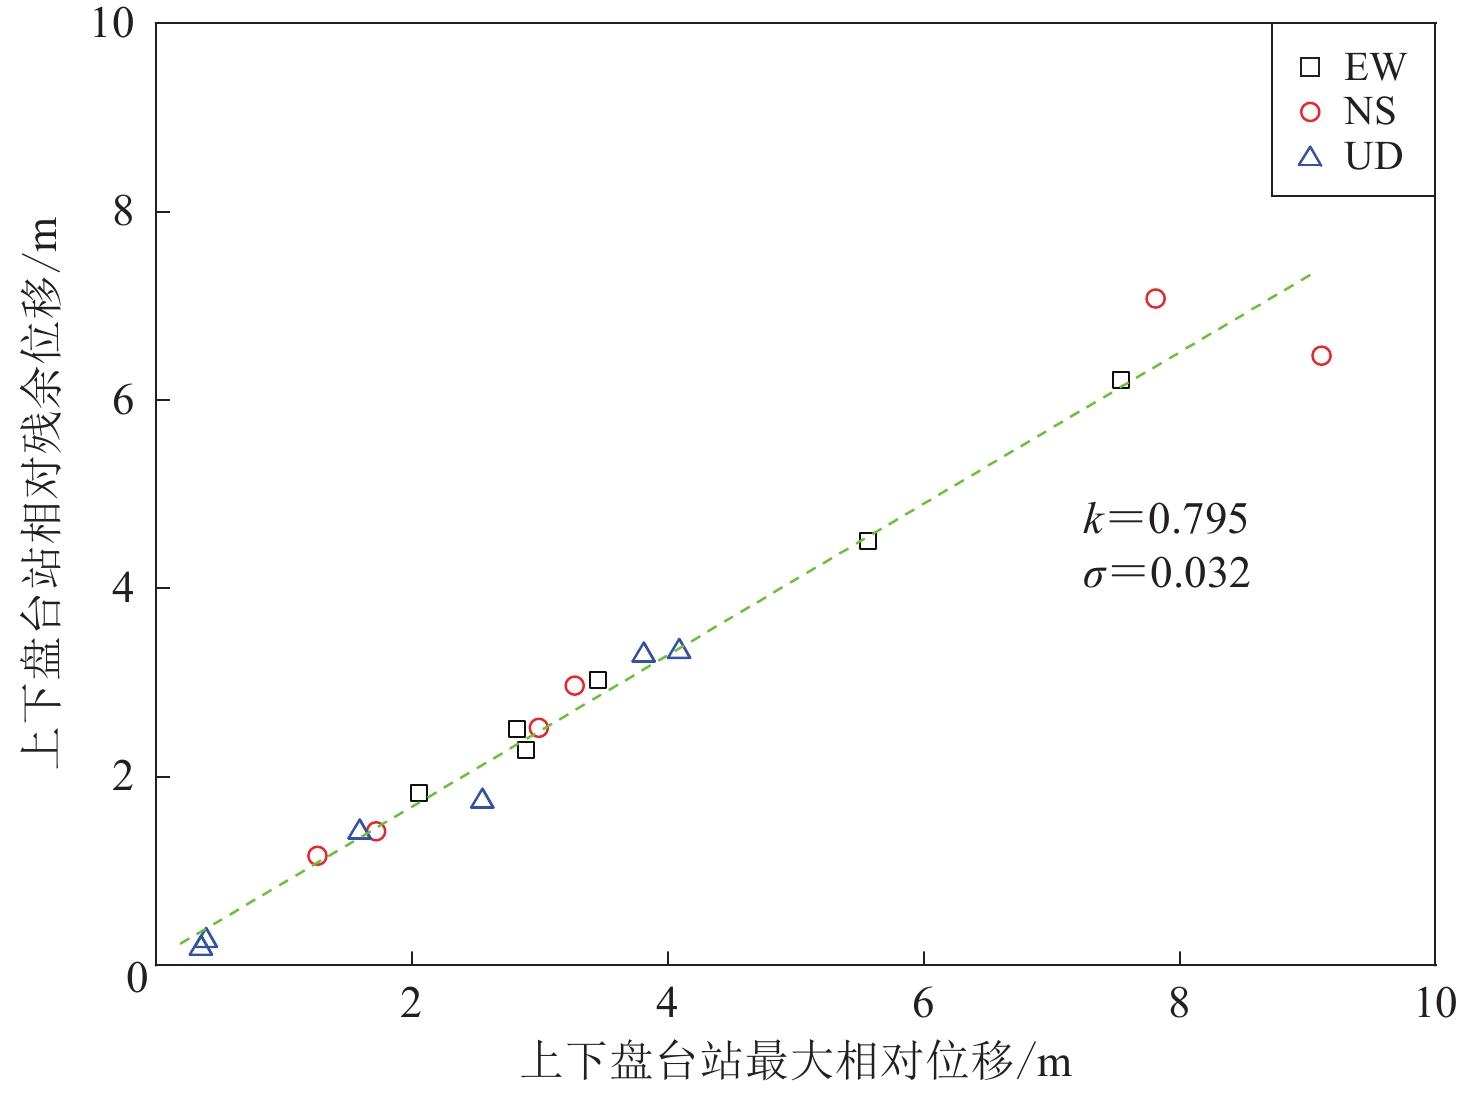
图 7 上下盘台站最大相对位移与相对残余位移关系
Figure 7. Relationship between maximum relativedisplacement and relative residual displacement of hanging wall and footwall stations
![]()
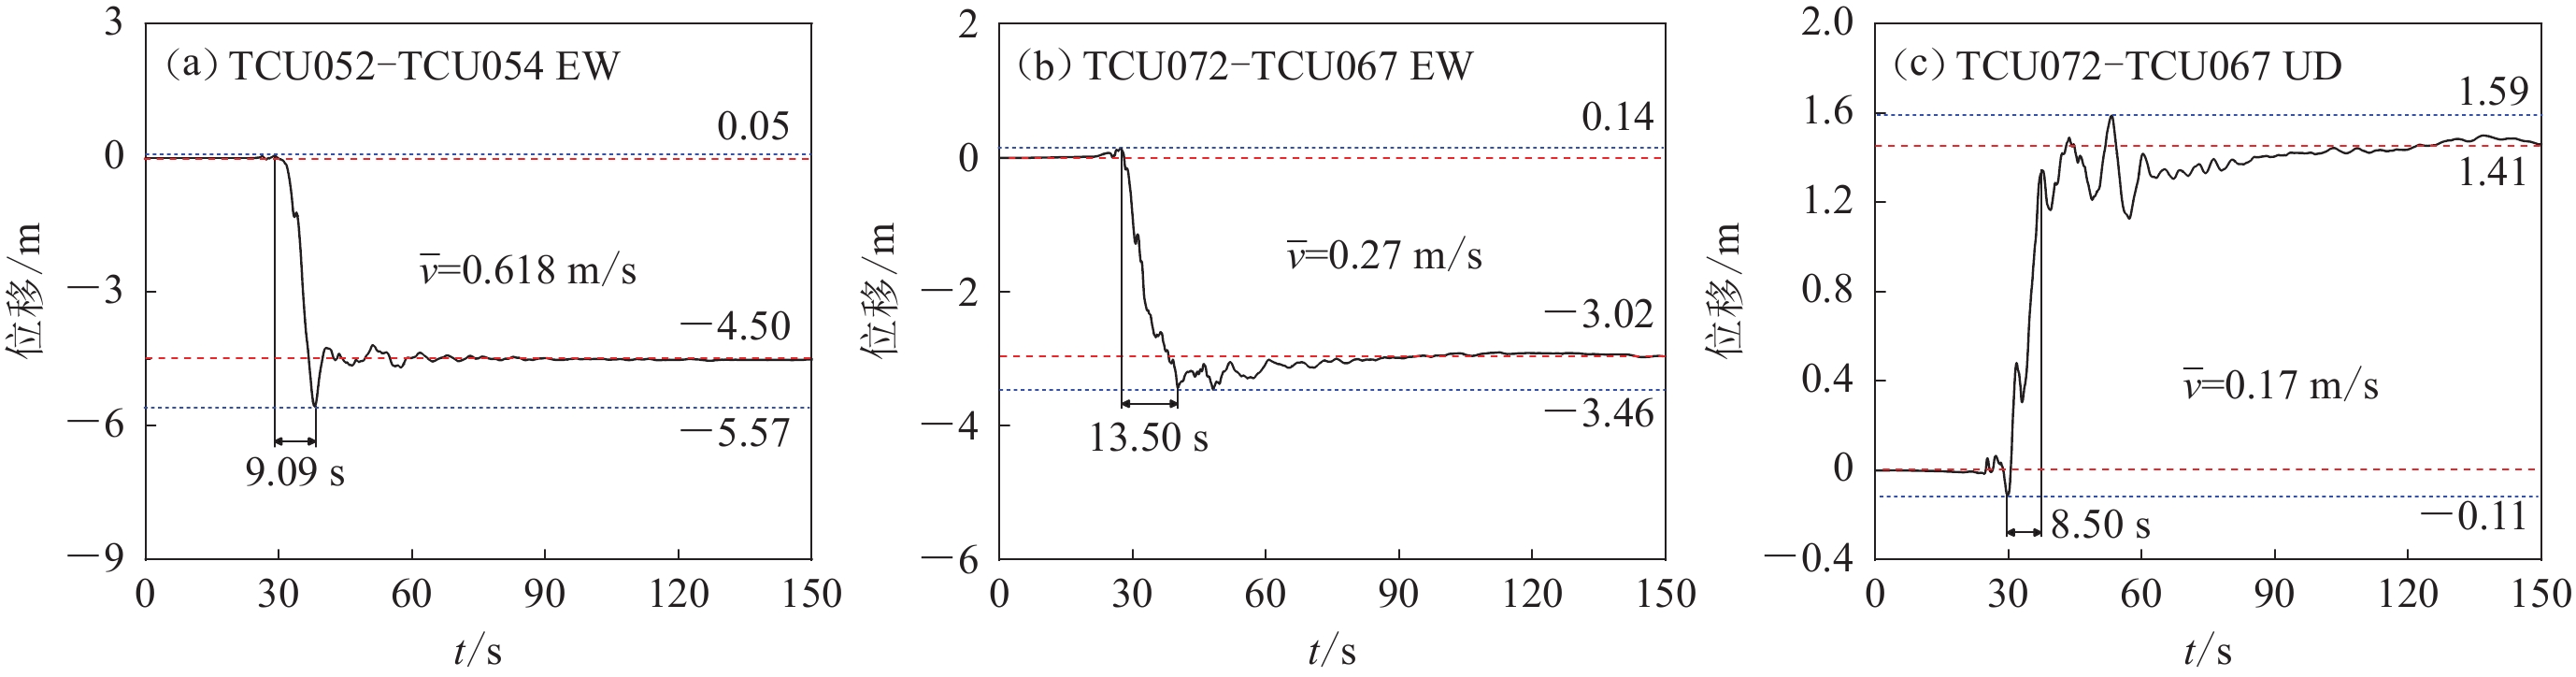
图 8 上、下盘台站强震动相对位移时程典型特征
(a) TCU052-TCU054台站的EW分量;(b) TCU072-TCU067台站的EW分量;(c) TCU072-TCU067台站的UD分量
Figure 8. Typical characteristics of relative displacement time history of strong ground motion records at hanging wall and footwall stations
(a) EW component of the station TCU052-TCU054;(b) EW component of the station TCU072-TCU067;(c) UD component of the station TCU072-TCU067
![]()
图 9 集集地震土木工程断层破坏7例
(a) 石岗大坝(TCU068-TCU103);(b) 北丰桥(TCU068-TCU103);(c) 欢乐谷公寓群(TCU068-TCU103);(d) 第一公园大桥(TCU052-TCU054);(e) 光复中学(TUC071-TCU075);(f) 乌溪桥(TUC071-TCU075);(g) 刘眉桥(TCU078-TCU122)
Figure 9. Seven cases of civil engineering fault failure in Chi-Chi earthquake
(a) Shigang Dam (TCU068-TCU103);(b) Beifeng Bridge (TCU068-TCU103);(c) Happy Valley Apartments (TCU068-TCU103);(d) The First Park Bridge (TCU052-TCU054);(e) Guangfu Middle School (TUC071-TCU075);(f) Wuxi Bridge (TUC071-TCU075);(g) Liumei Bridge (TCU078-TCU122)
![]()
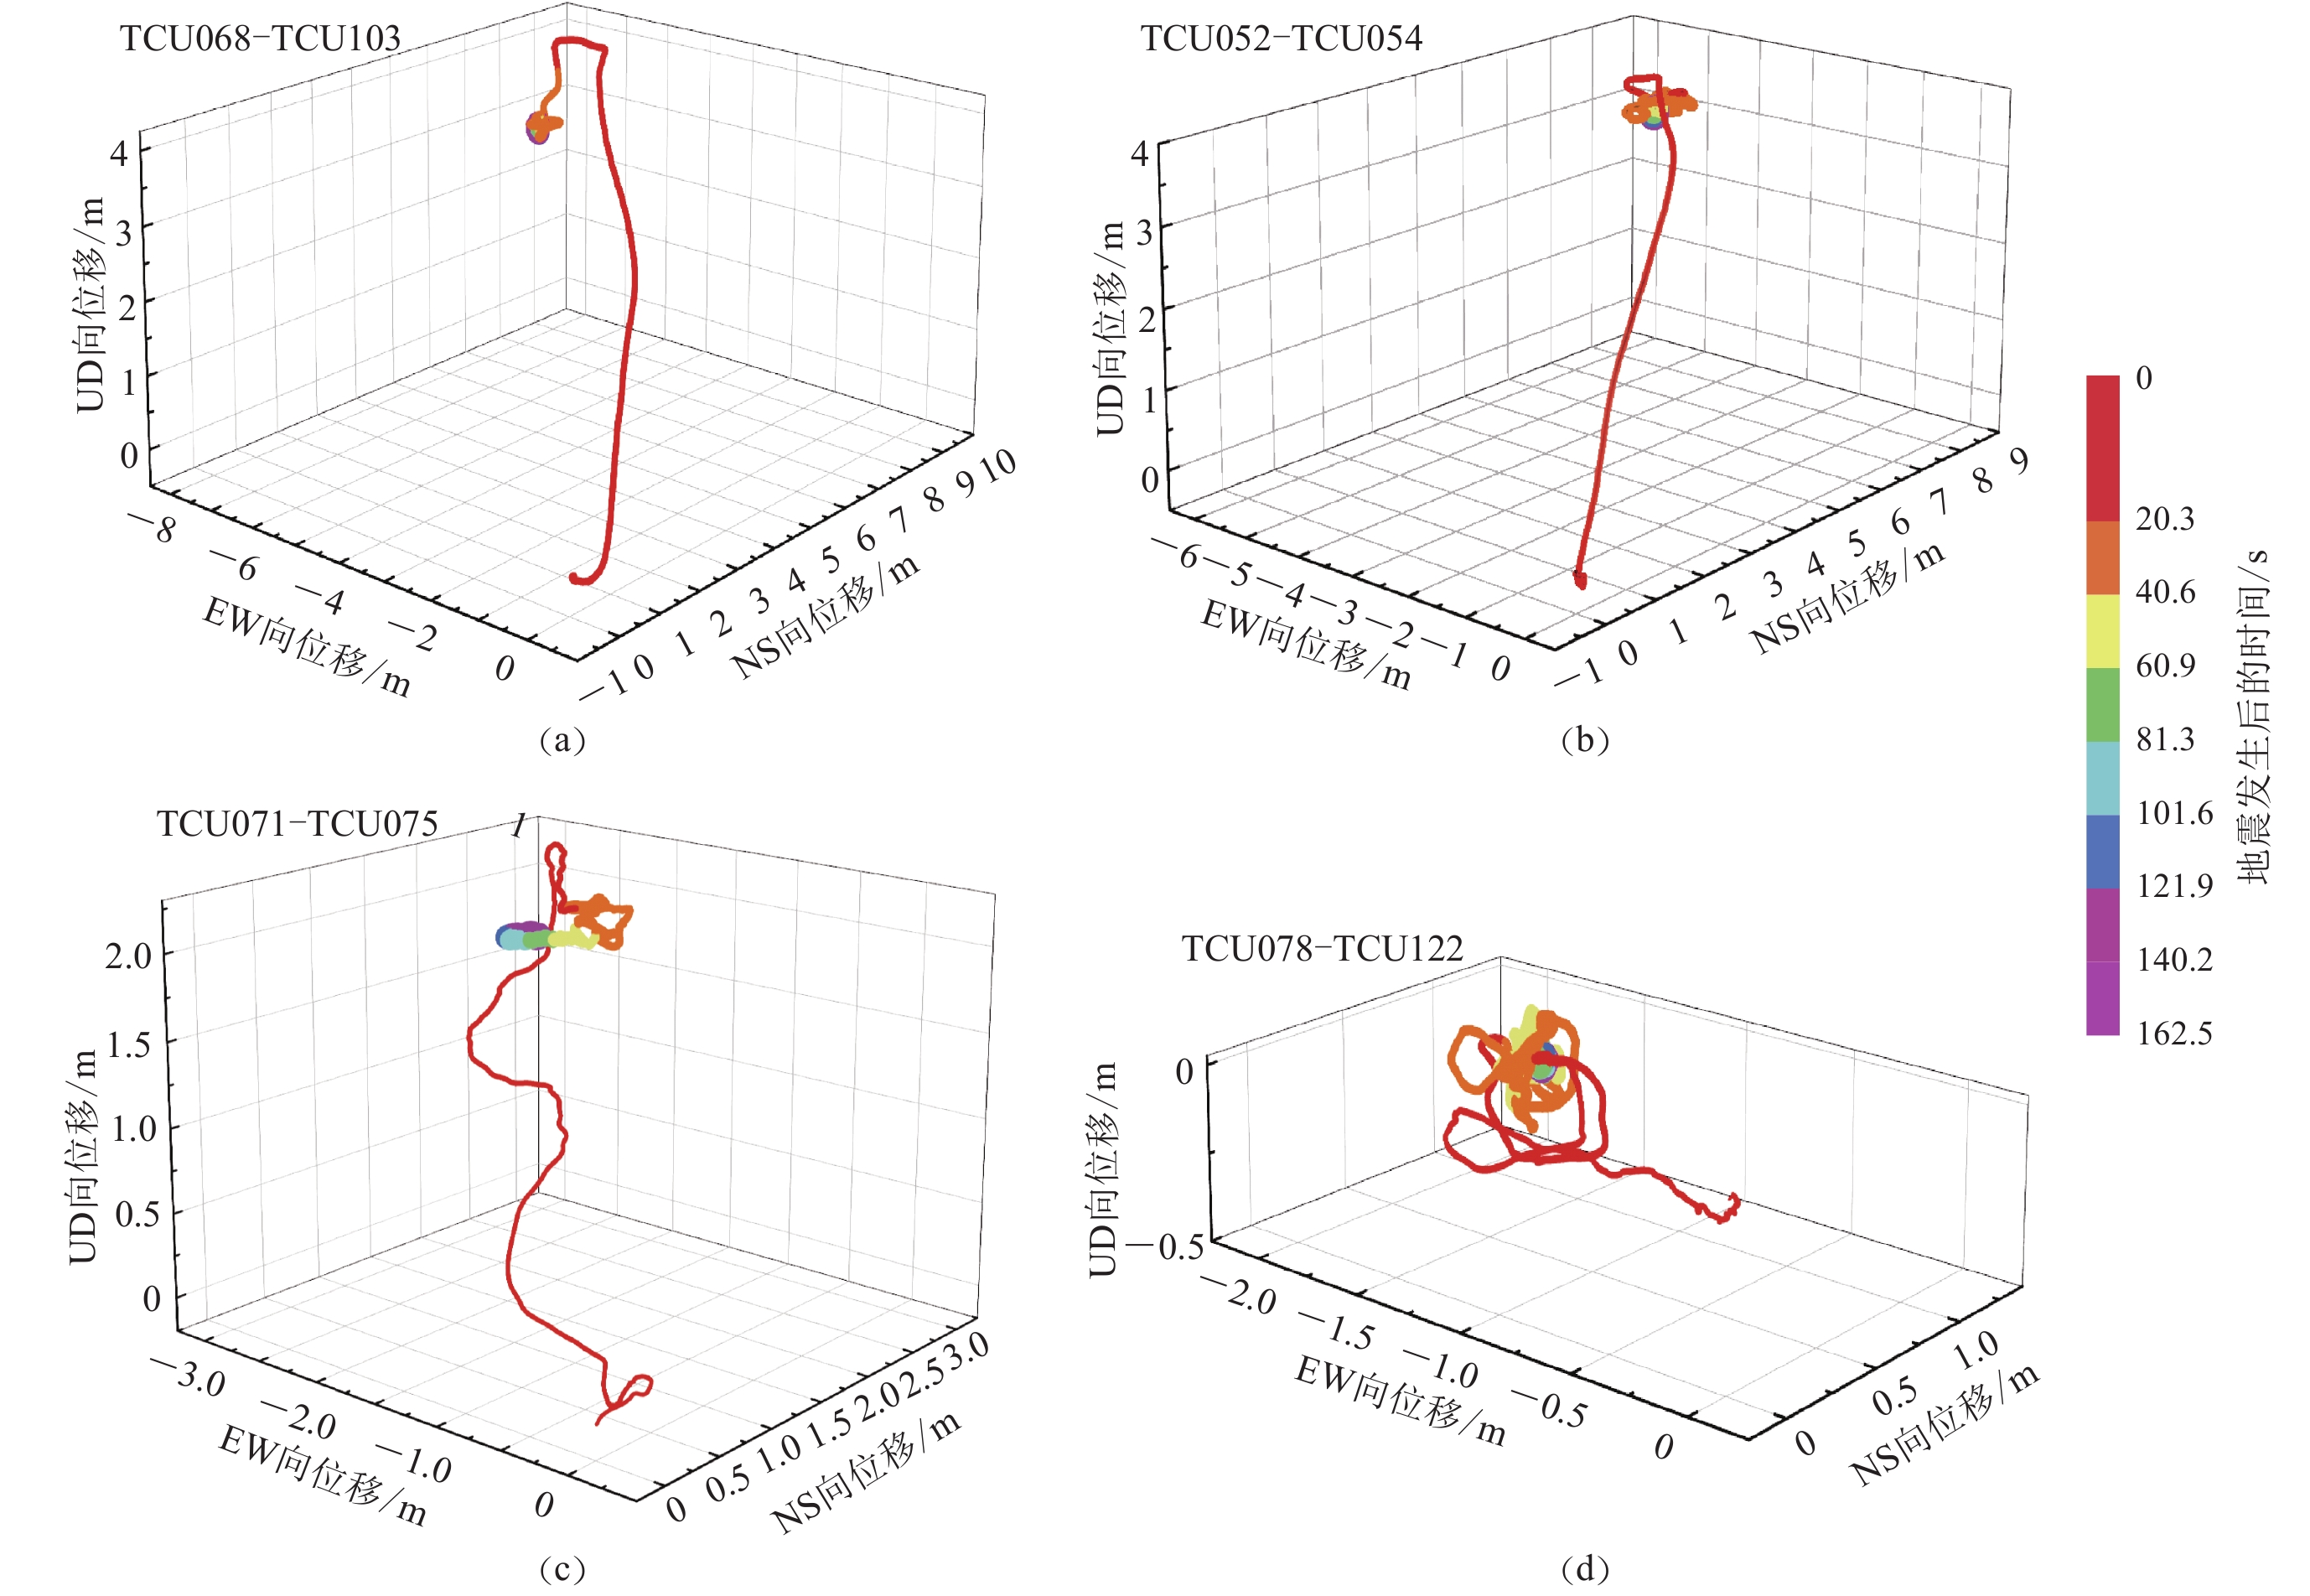
图 10 四对上、下盘台站的空间相对位移时程
Figure 10. Spatial relative displacement time histories of the four pairs of hanging wall and footwall stations
(a) TCU068-TCU103;(b) TCU052-TCU054;(c) TCU071-TCU075;(d) TCU078-TCU122
![]()
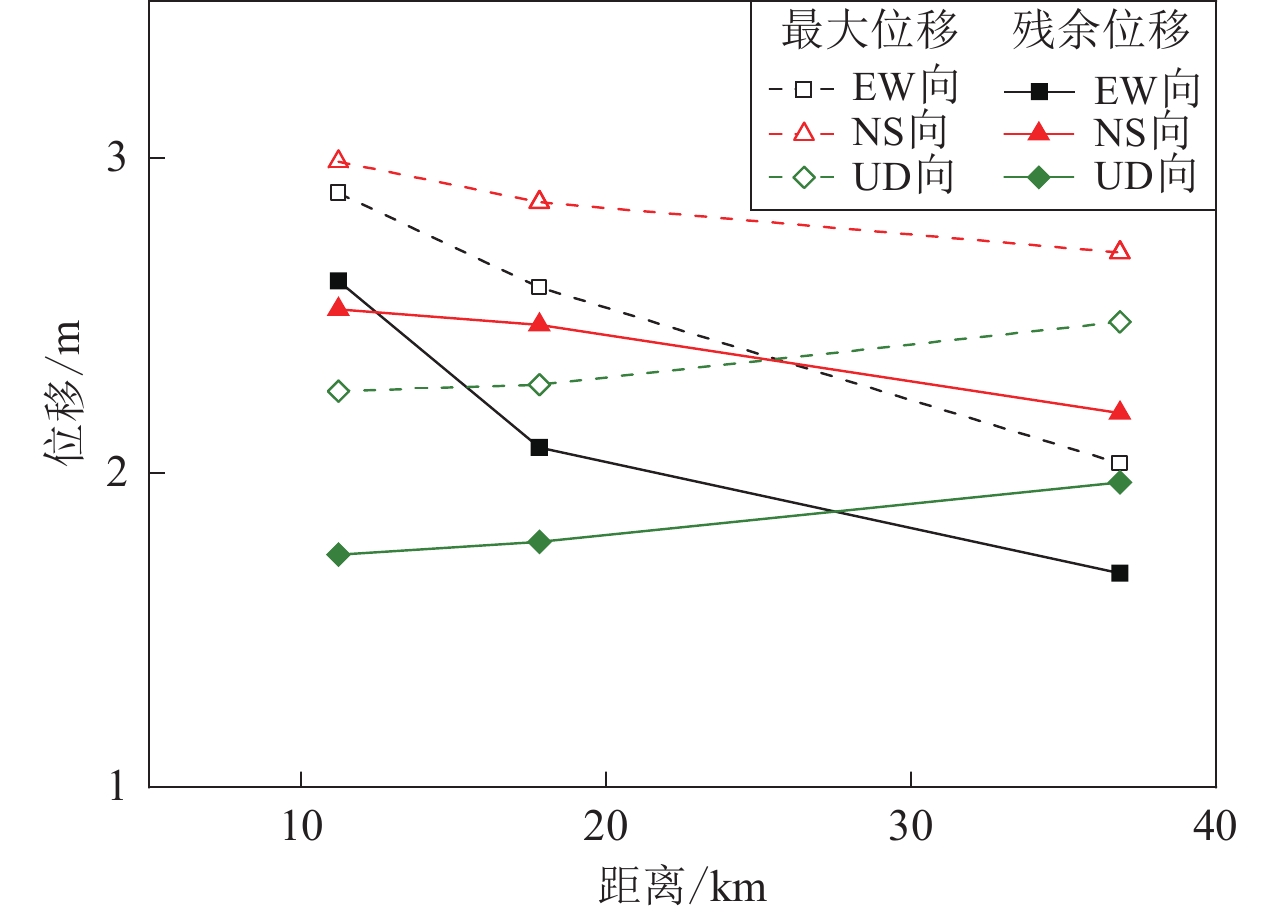
图 11 跨断层场点间相对位移与场点间距的关系
Figure 11. Relationship between relative displacement and field spacing across fault sites
![]()
图 12 逆断层盘间相对位移趋势示意图
Figure 12. Schematic diagram of relative displacement trend between reverse fault walls
表 1 1999年台湾集集MW7.6地震强震动台站位置
Table 1 Location of ground motion stations of 1999 MW7.6 Chi-Chi earthquake in Taiwan region
断层盘 台站 东经/° 北纬/° 海拔/km 断层距/km 上盘 TCU068 120.8 24.3 0.276 0.071 TCU052 120.7 24.2 0.170 0.092 TCU072 120.8 24.0 0.363 13.021 TCU071 120.8 24.0 0.187 10.003 TCU089 120.9 23.9 0.020 15.277 TCU078 120.8 23.8 0.272 14.402 下盘 TCU103 120.7 24.3 0.222 5.982 TCU054 120.7 24.2 0.097 7.029 TCU067 120.7 24.1 0.073 0.716 TCU075 120.7 24.0 0.096 1.209 TCU120 120.6 24.0 0.228 7.793 TCU118 120.4 24.0 0.008 30.496 TCU076 120.7 24.0 0.103 3.653 TCU129 120.7 23.9 0.110 3.059 TCU122 120.6 23.8 0.075 10.996 CHY024 120.6 23.8 0.085 12.255 注:数据来源于台湾气象厅公开发行的光盘( Lee et al,2001 )。 下载: 导出CSV
表 2 1999年集集MW7.6地震上、下盘台站本文所选组对情况
Table 2 Group matching of hanging wall and footwall stations of the 1999 MW7.6 Chi-Chi earthquake in this paper
台站 组队 上盘 TCU068 TCU052 TCU072 TCU071 TCU089 TCU078 下盘 TCU103 TCU054 TCU067 TCU075 TCU075 TCU122
下载: 导出CSV
表 3 上盘台站强震动记录位移最大值及残余位移
Table 3 Maximum displacement and residual displacement of strong ground motion records at the hanging wall stations
上盘台站 EW分量 NS分量 UD分量 最大位移/m 残余位移/m 最大位移/m 残余位移/m 最大位移/m 残余位移/m TCU068 7.06 5.81 8.61 5.94 4.52 3.45 TCU052 4.99 3.94 7.18 6.78 3.92 3.16 TCU072 2.02 1.80 2.35 2.00 1.33 1.16 TCU071 1.76 1.19 2.61 0.15 2.26 1.74 TCU089 1.91 1.81 1.37 1.18 0.24 0.03 TCU078 1.21 1.19 0.85 0.66 0.35 0.25
下载: 导出CSV
表 4 六对上、下盘台站强震动相对位移最大值及相对残余位移
Table 4 The maximum relative displacement and relative residual displacement of strong ground motion records at six pairs of hanging wall and footwall stations
上、下盘台站 EW分量 NS分量 UD分量 最大相对位移/m 相对残余位移/m 最大相对位移/m 相对残余位移/m 最大相对位移/m 相对残余位移/m TCU068-TCU103 7.54 6.21 9.11 6.47 4.09 3.33 TCU052-TCU054 5.57 4.50 7.81 7.08 3.81 3.29 TCU072-TCU067 3.46 3.02 3.27 2.97 1.59 1.41 TCU071-TCU075 2.89 2.28 2.99 2.52 2.55 1.74 TCU089-TCU076 2.82 2.50 1.72 1.42 0.39 0.26 TCU078-TCU122 2.06 1.82 1.26 1.16 0.35 0.18
下载: 导出CSV
表 5 工程破坏现场地表位错与附近断层上、下盘台站位错计算值的比较
Table 5 Comparison of calculated values of surface dislocations at the site of engineering failure with those at the hanging wall and footwall stations nearby faults
工程名称 上、下盘台站 台站间距/km 位错观察值/m 位错计算值/m 数据记录方向 石岗大坝 TCU068-TCU103 6.05 8.00 3.33 上下 北丰桥 5.50 上下 欢乐谷公寓群 3.50 上下 第一公园大桥 TCU052-TCU054 7.12 4.00 3.29 上下 光复中学 TCU071-TCU075 11.21 2.50 1.74 上下 乌溪桥 2.00 2.61 水平 刘眉桥 TCU078-TCU122 25.40 0.20 0.18 上下
下载: 导出CSV
-
曹志磊,周琼,葛计划,孙军,隆爱军,龙剑锋,赵希磊. 2019. 郯庐断裂带安徽段及“霍山窗”断层活动特征与地震关联性研究[J]. 大地测量与地球动力学,39(7):681–685. Cao Z L,Zhou Q,Ge J H,Sun J,Long A J,Long J F,Zhao X L. 2019. Fault activity and correlation study of Tan-Lu fault zone and “Huoshan Seismic Window"[J]. Journal of Geodesy and Geodynamics,39(7):681–685 (in Chinese).
陈勇,陈鲲,俞言祥. 2007. 用集集主震记录研究近断层强震记录的基线校正方法[J]. 地震工程与工程振动,27(4):1–7. doi: 10.3969/j.issn.1000-1301.2007.04.001 Chen Y,Chen K,Yu Y X. 2007. Base line correction method for near-fault accelerograms using Chi-Chi main shock record[J]. Journal of Earthquake Engineering and Engineering Vibration,27(4):1–7 (in Chinese).
高波,王峥峥,袁松,申玉生. 2009. 汶川地震公路隧道震害启示[J]. 西南交通大学学报,44(3):336–341. Gao B,Wang Z Z,Yuan S,Shen Y S. 2009. Lessons learnt from damage of highway tunnels in Wenchuan earthquake[J]. Journal of Southwest Jiaotong University,44(3):336–341 (in Chinese).
胡进军. 2009. 近断层地震动方向性效应及超剪切破裂研究[D]. 哈尔滨: 中国地震局工程力学研究所: 126–133. Hu J J. 2009. Directivity Effect of Near-Fault Ground Motion and Super-Shear Rupture[D]. Harbin: Institute of Engineering Mechanics, China Earthquake Administration: 126–133 (in Chinese).
胡聿贤. 2006. 地震工程学[M]. 第二版. 北京: 地震出版社: 13–14. Hu Y X. 2006. Earthquake engineering[M]. Second edition. Beijing: Seismological Press: 13–14 (in Chinese).
黄润秋,李为乐. 2009. 汶川大地震触发地质灾害的断层效应分析[J]. 工程地质学报,17(1):19–28. Huang R Q,Li W L. 2009. Fault effect analysis of geo-hazard triggered by Wenchuan earthquake[J]. Journal of Engineering Geology,17(1):19–28 (in Chinese).
李爽,周洪圆,刘向阳,贾俊峰. 2020. 基于中国规范的近断层区抗震设计谱研究[J]. 建筑结构学报,41(2):7–12. Li S,Zhou H Y,Liu X Y,Jia J F. 2020. Study on near-fault seismic design spectra based on Chinese Code for Seismic Design of Buildings[J]. Journal of Building Structures,41(2):7–12 (in Chinese).
王栋,谢礼立,胡进军. 2008. 倾斜断层不对称分布引起的几何效应:上下盘效应[J]. 地震学报,30(3):271–278. doi: 10.3321/j.issn:0253-3782.2008.03.006 Wang D,Xie L L,Hu J J. 2008. Geometric effects resulting from the asymmetry of dipping fault:Hanging wall/footwall effects[J]. Acta Seismologica Sinica,30(3):271–278 (in Chinese).
王永安,李琼,刘强. 2011. 跨断层形变累积率的变化特征与云南地区强震[J]. 地震研究,34(2):136–142. Wang Y A,Li Q,Liu Q. 2011. Variation of the cumulative rate of cross-fault deformation and strong earthquakes in Yunnan[J]. Journal of Seismological Research,34(2):136–142 (in Chinese).
谢礼立,徐龙军,陶晓燕,杨绪剑. 2021. 跨断层土木工程研究与实验装置研发现状[J]. 工程力学,38(4):20–29. Xie L L,Xu L J,Tao X Y,Yang X J. 2021. Research status of civil engineering structures across faults and the development of experimental devices for fault simulation[J]. Engineering Mechanics,38(4):20–29 (in Chinese).
喻畑,李小军. 2012. 基于NGA模型的汶川地震区地震动衰减关系[J]. 岩土工程学报,34(3):552–558. Yu T,Li X J. 2012. Attenuation relationship of ground motion for Wenchuan earthquake region based on NGA model[J]. Chinese Journal of Geotechnical Engineering,34(3):552–558 (in Chinese).
俞言祥,高孟潭. 2001. 台湾集集地震近场地震动的上盘效应[J]. 地震学报,23(6):615–621. Yu Y X,Gao M T. 2001. Effects of the hanging wall and footwall on peak acceleration during the Jiji (Chi-Chi),Taiwan Province,earthquake[J]. Acta Seismologica Sinica,14(6):654–659.
张红艳,谢富仁. 2013. 天山地区跨断层形变观测与地壳应力特征[J]. 西北大学学报(自然科学版),43(4):617–622. Zhang H Y,Xie F R. 2013. Cross-fault deformation observation and characteristics of crustal stress in Tianshan region[J]. Journal of Northwest University (Natural Science Edition),43(4):617–622 (in Chinese).
周云好,陈章立,缪发军. 2004. 2001年11月14日昆仑山口西MS8.1地震震源破裂过程研究[J]. 地震学报,26(增刊):9–20. Zhou Y H,Chen Z L,Miao F J. 2004. Source process of the 14 November 2001westhern Kunlun mountain MS8.1 earthquake[J]. Acta Seismological Sinica,26(S1):9–20 (in Chinese).
Abrahamson N A. 2000. Near-fault ground motions from the 1999 Chi-Chi earthquake[C]//Proc. of US-Japan Workshop on the Effects of Near-Field Earthquake Shaking. San Francisco, California: Pacific Earthquake Engineering Research Center: 11−13.
Bolt B A. 1999. Earthquakes[M]. Fourth edition. New York: W.H. Freeman and Company: 52–53.
Boore D M. 2001. Effect of baseline corrections on displacements and response spectra for several recordings of the 1999 Chi-Chi,Taiwan,earthquake[J]. Bull Seismol Soc Am,91(5):1199–1211.
Bray J D,Rodriguez-Marek A. 2004. Characterization of forward-directivity ground motions in the near-fault region[J]. Soil Dyn Earthq Eng,24(11):815–828. doi: 10.1016/j.soildyn.2004.05.001
Chao W A,Wu Y M,Zhao L. 2009. An automatic scheme for baseline correction of strong-motion records in coseismic deformation determination[J]. J Seismol,14(3):495–504.
Chu D B, Brandenberg S J, Lin P S. 2008. Performance of bridges in liquefied ground during 1999 Chi-Chi earthquake[C]//The 14th WCEE. Beijing: CAEE and IAEE: 13–17.
Dong J J, Wang C D, Lee C T, Liao J J, Pan Y W. 2004. The influence of surface ruptures on building damage in the 1999 Chi-Chi earthquake: A case study in Fengyuan City[J]. Engineering Geology, 71(1/2): 157–179.
Iwan W D,Moser M A,Peng C Y. 1985. Some observations on strong motion earthquake measurement using a digital accelerograph[J]. Bull Seismol Soc Am,75(5):1225–1246. doi: 10.1785/BSSA0750051225
Kawashima K. 2002. Damage of bridges resulting from fault rupture in the 1999 Kocaeli and Duzce, Turkey earthquakes and the 1999 Chi-Chi, Taiwan earthquake[J]. Structural Eng/Earthq Eng, 19(2 Special Issue): 179−197.
Lee W H K, Shin T C, Kuo K W, Chen K C, Wu C F. 2001. CWB free-field strong-motion data from the 21 September Chi-Chi, Taiwan, earthquake[J]. Bull Seismol Soc Am, 91(5): 1370−1376.
Lin M L,Lin C H,Li C H,Liu C Y,Hung C H. 2021. 3D modeling of the ground deformation along the fault rupture and its impact on engineering structures:Insights from the 1999 Chi-Chi earthquake,Shigang District,Taiwan[J]. Eng Geol,281:105993. doi: 10.1016/j.enggeo.2021.105993
Ma K F,Mori J,Lee S J,Yu S B. 2001. Spatial and temporal distribution of slip for the 1999 Chi-Chi,Taiwan earthquake[J]. Bull Seismol Soc Am,91(5):1069–1087.
Mccomb H,Ruge A,Neumann F. 1943. The determination of true ground motion by integration of strong-motion records:A symposium[J]. Bull Seismol Soc Am,33(1):1. doi: 10.1785/BSSA0330010001
Ota Y,Watanabe M,Suzuki Y,Yanagida M,Miyawaki A,Sawa H. 2007. Style of the surface deformation by the 1999 Chichi earthquake at the central segment of Chelungpu fault,Taiwan,with special reference to the presence of the main and subsidiary faults and their progressive deformation in the Tsauton area[J]. J Asia Earth Sci,31(3):214–225. doi: 10.1016/j.jseaes.2006.07.030
Somerville P G,Smith N F,Graves R W,Abrahamson N A. 1997. Modification of empirical strong ground motion attenuation relations to include the amplitude and duration effects of rupture directivity[J]. Seismol Res Lett,68(1):199–222. doi: 10.1785/gssrl.68.1.199
Wang G Q,Zhou X Y,Zhang P Z,Igel H. 2002. Characteristics of amplitude and duration for near fault strong ground motion from the 1999 Chi-Chi,Taiwan earthquake[J]. Soil Dyn Earthq Eng,22(1):73–96. doi: 10.1016/S0267-7261(01)00047-1
Wang R J,Schurr B,Milkereit C,Shao Z G,Jin M P. 2011. An improved automatic scheme for empirical baseline correction of digital strong-motion records[J]. Bull Seismol Soc Am,101(5):2029–2044. doi: 10.1785/0120110039
Wang W L,Wang T T,Su J J,Lin C H,Seng C R,Huang T H. 2001. Assessment of damage in mountain tunnels due to the Taiwan Chi-Chi earthquake[J]. Tunn Undergr Space Technol,16(3):133–150. doi: 10.1016/S0886-7798(01)00047-5
Wu Y M, Wu C F. 2007. Approximate recovery of coseismic deformation from Taiwan strong-motion records[J]. J Seismol, 11(2): 159–170.
Xu L J,Zhao G C,Gardoni P,Xie L L. 2018. Quantitatively determining the high-pass filter cutoff period of ground motions[J]. Bull Seismol Soc Am,108(2):857–865. doi: 10.1785/0120170074
Zhao G C,Xu L J,Gardoni P,Xie L L. 2019. A new method of deriving the acceleration and displacement design spectra of pulse-like ground motions based on the wavelet multi-resolution analysis[J]. Soil Dyn Earthq Eng,119:1–10. doi: 10.1016/j.soildyn.2019.01.008


计量
- 文章访问数: 407
- HTML全文浏览量: 99
- PDF下载量: 105
