

Statistical characteristics of enhanced seismicity before strong earthquakes based on earthquake cases in Chinese mainland
-
摘要:
依据 《中国震例》 (1966—2017年)对1966年以来中国大陆东部MS>6.0、西部MS>7.0强震前地震活动增强的异常现象特征进行了系统的梳理,并试图总结不同活动构造地块周缘强震前地震活动增强的异常时空演化特征。结果显示:① 我国大陆大震前普遍存在地震活动增强现象,33个震例中有21个震例存在震前地震活动增强异常,占比达64%;② 西部地区大多数震例的地震活动增强空间范围表现为中间尺度或构造尺度,且主震震级越大,越有可能出现大范围的地震活动增强;③ 西部地区出现中强地震活动增强的概率高于东部地区,前兆地震活动增强的平均震级较大,发生大震(M>7.0)的概率增大;④ 西部地区地震活动增强的时间尺度与震级成正比,而东部地区随着震级增大,更可能出现中期到中短期的地震活动增强异常;⑤ 多数西部地区震例在震前出现不同时间尺度的地震活动增强叠加的现象;⑥ 川滇菱形地块的强震前均出现了中长期尺度的地震条带交会现象、不同空间尺度的地震空区以及中短期尺度的中小震活动增强现象,并且对大震地点有较好的指示意义。巴颜喀拉东边界与北、西及南边界大震前存在显著的不同地震活动增强特征,震前未出现中强地震围空的现象。
Abstract:Before strong earthquakes, enhanced seismicity manifested by increased magnitude, frequency, or accelerated strain release generally appears within a specific temporal and spatial range of the source area. This significant enhanced seismicity is often observed before moderate-strong earthquakes occurred in Chinese mainland or abroad. The seismogenic processes of large earthquakes are multiscale and diverse, involving localization of deformation, fault heterogeneities, and variable local loading rate effects. Enhanced seismicity prior to moderate-strong earthquakes is closely related to such processes and exhibits different characteristics. An in-depth study of enhanced seismicity will help us to understand the seismogenic process of strong-large shocks, which may bring positive effect on predicting strong shocks based on them.
Many studies have been performed to analyze the characteristics of enhanced seismicity. A more thoughtful and systematic study is needed due to rapidly increased strong earthquake data in Chinese mainland and the urgent requirement for statistical predictive indicators. In this study, we intend to summarize the statistical characteristics of the prominent enhanced seismicities before moderate-strong earthquakes and attempt to seek the proper mechanism. Based on Earthquake Cases in China (1966−2017), the spatio-temporal characteristics of the seismicity before strong earthquakes with magnitude MS≥6.0 in the eastern Chinese mainland and MS≥7.0 in the western Chinese mainland are summarized statistically. In the meantime, the regional features of enhanced seismicity before the strong earthquakes within the SichuanYunnan rhombic block, Bayan Har block, and North China block are also studied. The main contents and conclusions are as follows:
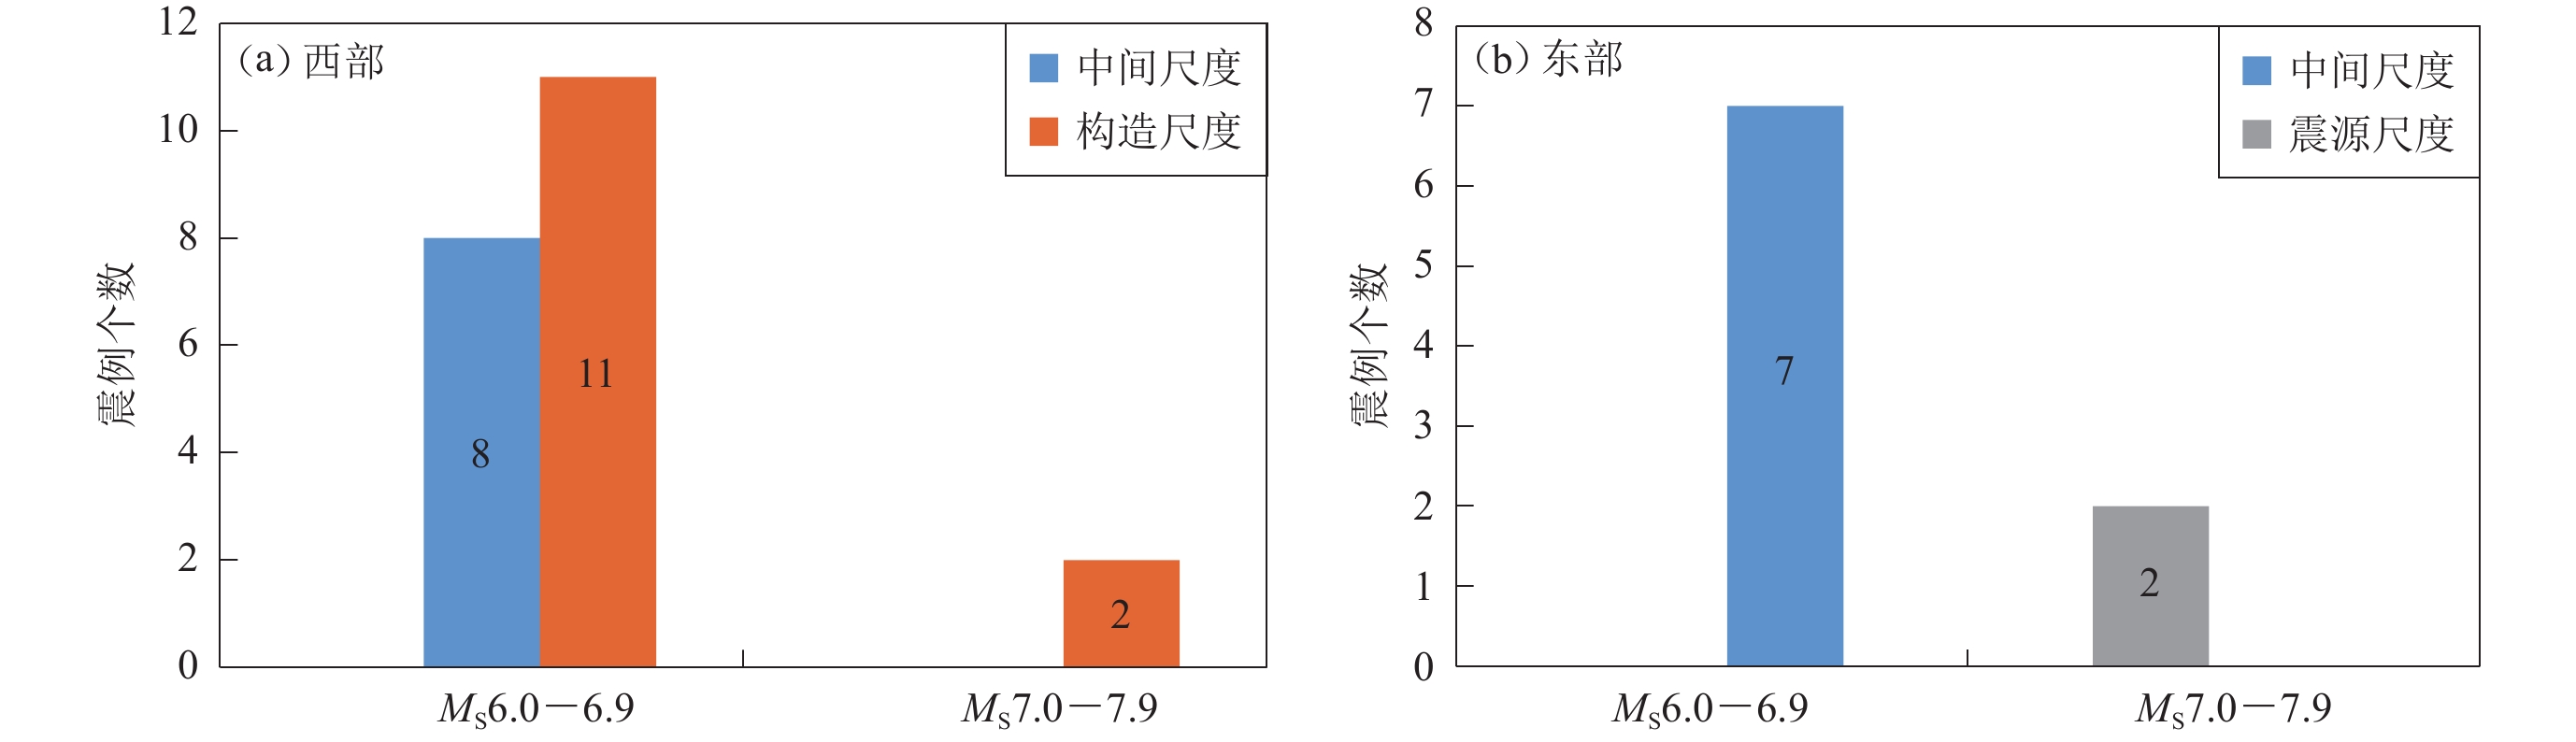
Among the 33 earthquake cases studied in this paper, 21 showed enhanced seismicity before the main shock, accounting for 64%, including five earthquakes of MS6.0−6.9, 14 earthquakes of MS7.0−7.9, and two earthquakes of MS8.0 or above. The percentage of enhanced seismicity is 42% for sub-grade class from MS6.0 to MS6.9, 74% for for sub-grade class from MS7.0 to MS7.9 and 100% for sub-grade class from MS8.0 or above. The possibility of the occurrence of enhanced seismic activity will increase with the magnitude of the main shock. The enhancement of seismicity appeared in 13 out of 18 cases in western Chinese mainland, accounting for 72%; 8 out of 15 cases in eastern Chinese mainland, accounts for 53%.
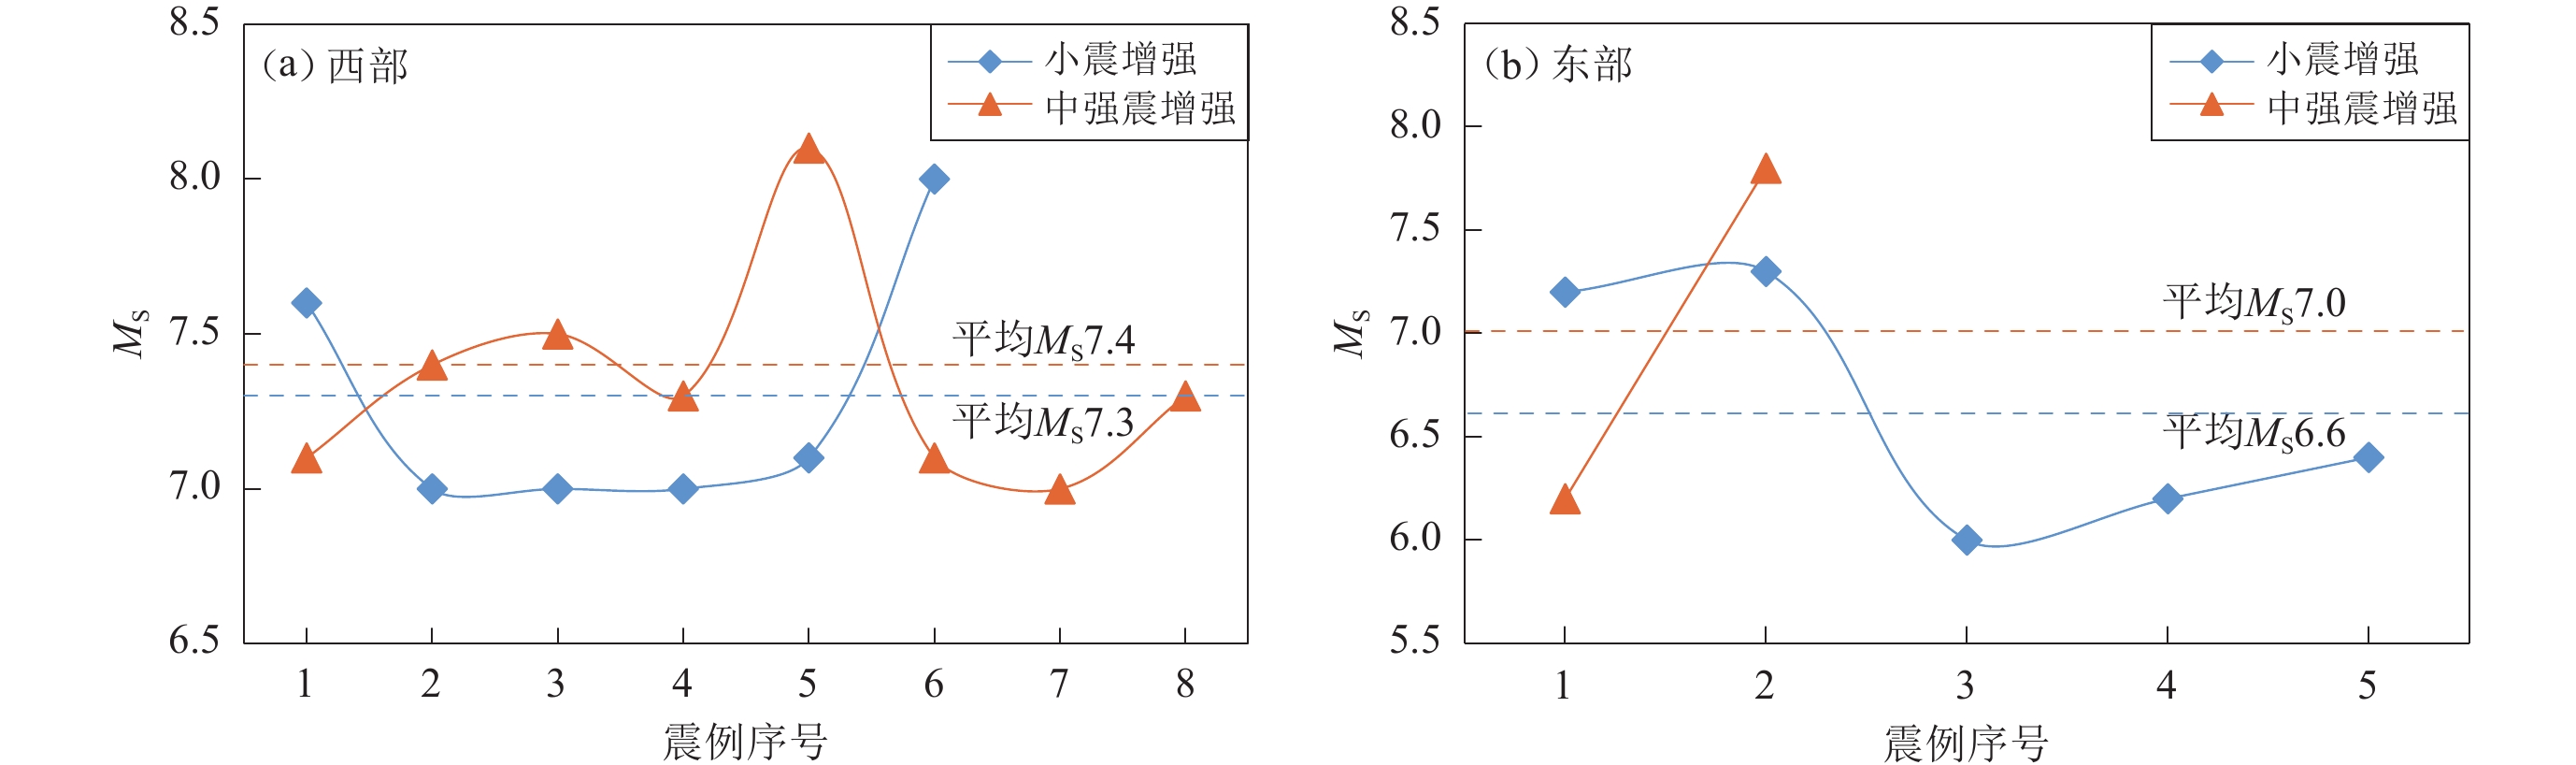
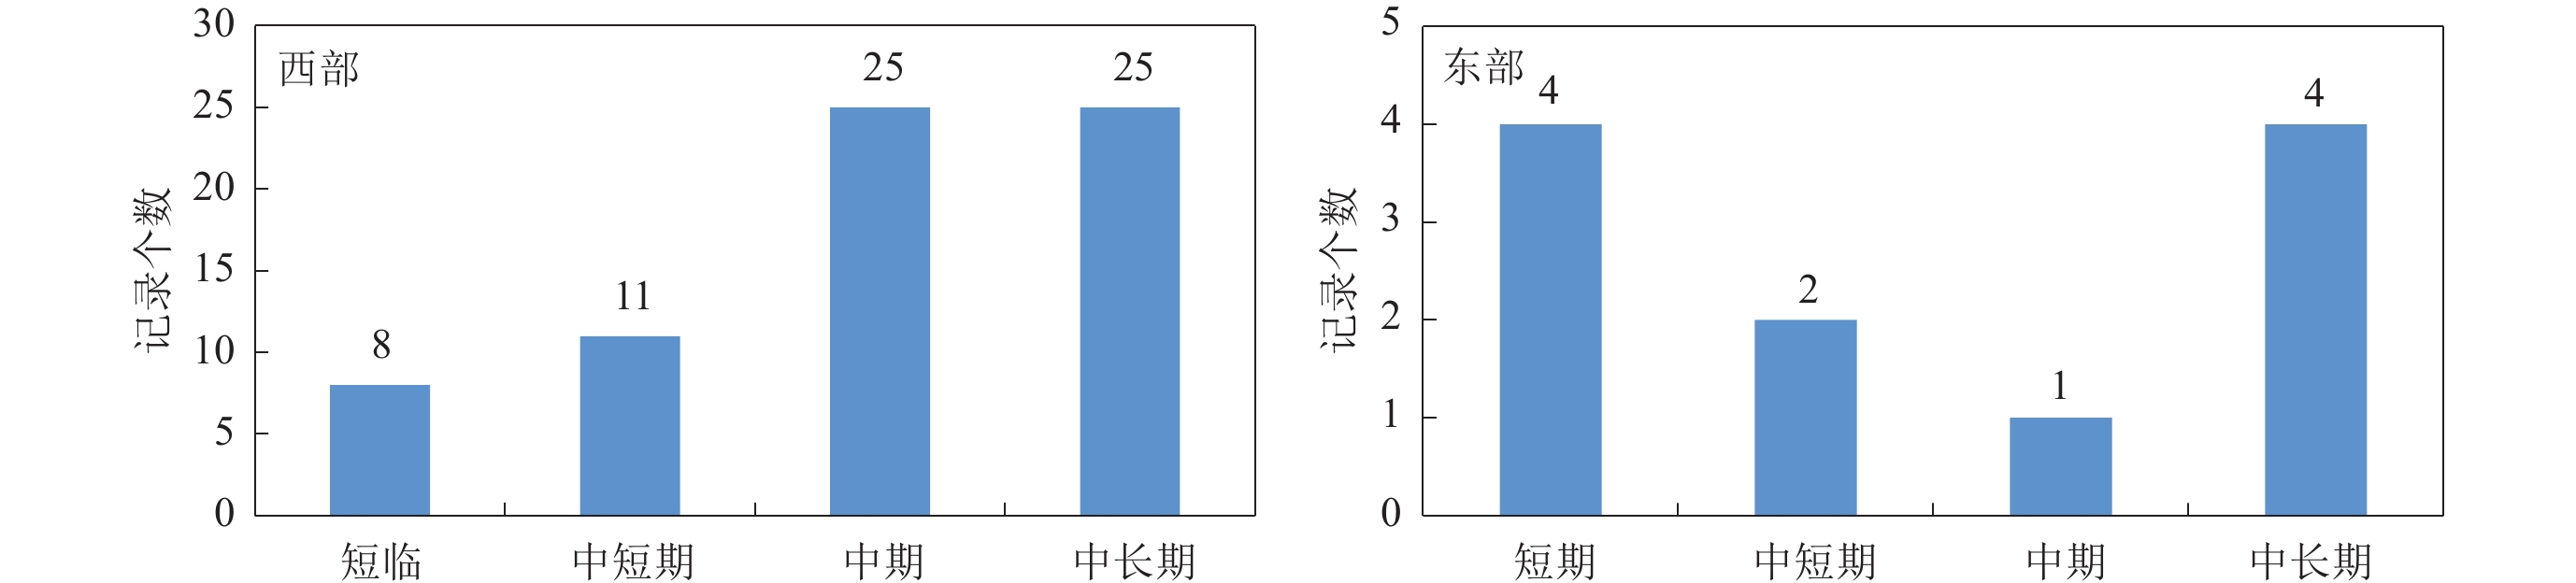
Secondly, in most cases for western Chinese mainland, the spatial extent of enhanced seismicities was observed within the intermediate or tectonic scale, and the probability of enhanced seismicity with a significant spatial scale increases with the magnitude of the main shock. Furthermore, the likelihood of enhanced seismicity with a large magnitude in western Chinese mainland is higher than in eastern Chinese mainland. The larger the average magnitude of enhanced premonitory seismicity, the more likely strong earthquakes with MS>7.0 occur. The duration of seismic activity enhancement in the western Chinese mainland is directly proportional to magnitude of the main shock, while in the eastern Chinese mainland, the relatively more significant events tend to be associated with a mid-short-term enhanced seismicity.
Thirdly, the strong earthquakes in Sichuan-Yunnan rhombic block were preceded by the medium-long term intersected seismic strips, the various spatial-scale seismic gaps, and the enhancement of small-moderate earthquakes at medium-short-term scales. These features significantly indicate the location of further quakes, which deserves more attention. Different from the eastern border of the Bayan Har block, at the other three boundaries of the Bayan Har block, strong earthquakes are often attacked with seismic gaps encircled by premonitory medium-strong earthquakes. The seismic gap generally arises in medium-long-term time scales, and the mid-short-term scale enhanced seismicity is notable before strong earthquakes in the northern margin of North China block. In particular, the magnitude of the Haicheng earthquake is comparable to that of the Tangshan earthquake. Still, the Haicheng earthquake was not preceded by a significant and long seismicity enhancement, which suggests that the secondary blocks or adjacent tectonic influences may also control the enhancement of seismicity before earthquake.
Fourthly, enhanced seismicity prior to large earthquakes drives damage to the surrounding rocks. These enhanced seismicities are not limited to the faults that generate large earthquakes. Still, they drive distributed rupture and local rock mass deformation, ultimately resulting in major slip zones and large earthquakes. Laboratory studies of rocks and similar samples have shown that a relatively long period of distributed deformation precedes the onset of large ruptures. The enhanced seismicity manifested in foreshocks is the most significant signal for the subsequent occurrence of a larger seismic event at a similar time and space. However, the enhanced seismicity does not appear as a foreshock in every case related to the seismogenic mechanism. The cascade-up framework and pre-slip model are generally used to account for the occurrence of a foreshock, whereas the progressive localization framework is suitable for explaining the enhancement of seismicity without significant foreshocks.
-
引言
地磁场是重要的地球物理场之一,由不同场源的磁场成分互相叠加而成,是随着时间和空间变化而变化的矢量场(徐文耀,2003;陈斌等,2010;王振东等,2017)。地球的主磁场是地球磁场中最主要的部分,约占总磁场的95%。
早在16世纪,人们就注意到伦敦磁偏角经历着缓慢的变化。地磁长期变化是指地磁场随时间的缓慢变化,即地磁场各分量年均值的时间变化,其时间尺度为若干年。地磁场及其长期变化是地磁学的一项重要研究内容(徐文耀等,2005;陈斌等,2010)。
国际地磁学与高空物理学协会1968年发布了第一代国际地磁参考场(International Geomagnetic Reference,缩写为IGRF)模型,即IGRF1965,随后每5年发布一次。国际地磁参考场模型是表示地球主磁场的长期变化的模型,在开展及通讯、航天领域、岩石圈异常及地震监测预报研究等生产科研工作中有着广泛的应用。根据模型应用范围,地磁模型分为全球地磁模型和区域地磁模型;根据表现形式分为地磁图和地磁场模型,即等直线图的形式。采用球谐分析、球冠谐分析和矩谐分析等不同的数学分析方法建立的地磁场模型均是基于高斯磁位理论(顾左文等,2004,2006;陈斌等,2011)。
地磁台站的主要任务就是取得连续可靠的地磁观测数据,而这些数据对地球主磁场的空间变化和长期变化的研究非常重要。我国最早于1874年在佘山地磁台(前身是徐家汇验磁台)正式产出地磁观测数据。1957—1958年根据第一届国际地球物理年联合观测的需求,在全国先后建立了北京白家疃等8个地磁台,俗称“老八台”,并于20世纪50年代末开始正式记录观测。截至目前,我国建立了大量的地磁台,这些台站组成了中国地磁观测的基本台网。
国内许多专家学者作了大量关于国际地磁参考场与国内地磁台站观测数据之间的差异分析研究工作。例如:徐文耀等(2005)利用第8代国际地磁参考场模型,分析研究了全球长期变化模型与我国长期变化模型的共同点及差异;之后其又探讨了地磁模型中产生各种误差的规律,研究了地壳场及外源场对地磁场模型误差的影响等(徐文耀等,2011);陈斌等(2012)根据第11代参考模型分析2005—2010年我国区域地磁场的长期变化特征,结果表明地磁参考模型与台站实际观测的长期变化在全国范围内基本一致,但在区域范围内仍存在着差异。
国际地磁学与高空物理学协会(International Association of Geomagnetism and Aeronomy,缩写为IAGA)在2019年12月发布了最新的第13代国际地磁参考场模型(IGRF13),为国际上通用的全球主磁场标准模型。其采用球谐分析的方法描述地磁主磁场及其长期变化,为13阶主磁场模型。IGRF包括了1900—2024年(间隔5年)共24个主磁场模型,IGRF13模型表示的时间范围为1900年1月1日至2024年12月31日。
为了研究IGRF13模型在我国区域的适用性,本文拟根据我国28个地磁台IGRF13模型值和实际地磁观测数据分析研究2015—2020年期间我国区域磁场模型的长期变化形态特征,并结合我国不同地磁台站的地球物理观测环境,分析模型值与实际地磁场长期观测值之间的差异;结合地磁台站的地理和地质环境,探讨我国地磁场长期变化特征,以期为认识区域地壳场和岩石圈活动提供有用的信息,为应用国际地磁参考模型数据研究地磁场的学者提供参考。
1. 数据选取和处理方法
1.1 数据的选取
本文选取了我国区域具有典型性与代表性的28个地磁基准台站(76°E—126.1°E,19°N—49.6°N),由于部分台站的建立时间为20世纪50年代,受地理环境因素影响,台站选址分布不均匀,大部分台站集中在我国中东部地区,西部地区台站少,内蒙古、西藏和新疆等地区的台站尤为稀少。利用选取的28个台站2015—2020年IGRF13模型与实际观测值(年均值)分析地磁场长期变化的特点及差异。
1.2 数据处理方法
1) 国际地磁参考模型是采用球谐分析方法描述地球主磁场及其长期变化的一系列数学模型(徐文耀,2011;王亶文,2003;刘元元等,2013)。主磁场磁位式的表达式为:
$$ V ( r \text{,} \theta \text{,} \lambda \text{,} t ) = a\left\{ \sum _{n=1}^{N}\sum _{m=0}^{n} \left({\frac{a}{r}}\right)^{n+1} [ {g}_{n}^{m} ( t ) \mathrm{cos}\, m\lambda + {h}_{n}^{m} ( t ) \mathrm{sin}\, m\lambda ] {{\mathrm{P}}}_{n}^{m}\mathrm{cos}\theta \right\} \text{,} $$ (1) 式中,λ和θ分别为位置的经度和地心余纬度,r为测点与地心的距离,a=6371.2 km为参考地球半径,m和n分别为球谐函数的次数和阶数,$ {g}_{n}^{m} $(t)和$ {h}_{n}^{m} $(t)为高斯系数,$ {{\mathrm{P}}}_{n}^{m} $$ ( \mathrm{cos}\theta ) $为n阶m次Schmidt准归一化缔合勒让德函数。
地球内部的主磁场可以表示为标量磁位势V的负梯度,V展开形式为式(1)。根据式(1),对标量磁位V向北、向东和地心方向求导,得到地磁场北向分量X、东向分量Y和垂直分量Z的表达式。根据地磁场各要素之间的换算关系,可得到地磁场总强度F、水平分量H、磁偏角D和磁倾角I分别为
$$ F = \sqrt{{{H}}^{2}+{{Z}}^{2}} \text{,}H = \sqrt{{X}^{2}+{Y}^{2}} \text{,} D = {\mathrm{arctan}}\left(\frac{Y}{X}\right) \text{,}I = {\mathrm{arctan}}\left(\frac{Z}{H}\right) \text{,} $$ (2) $$ X=\dfrac{{ {\text{∂}U}}}{r{\text{∂}\theta}}\text{,} Y=-\dfrac{{ {\text{∂}U}}}{r \sin \theta {\text{∂}}\lambda }\text{,} Z=\dfrac{{ {\text{∂}U}}}{{\text{∂}r}}.$$ 2) 年变率可采用一阶差分的方法求取,或者利用某两年年均值之差除以间隔年数,得到某两年间的平均年变率Sv (徐文耀,2011),即
$$ S_{{ v}}=\frac{{B_{m}-B_{n}}}{{m-n }}\text{,} $$ (3) 式中,Sv为地磁场任意分量的年变率,Bm为m年任意地磁七要素值,Bn为n年任意地磁七要素值。
3) 使用差值(误差法)ΔB及标准差(又称均方根偏差) RMS来描述模型计算值与实际观测数据的差值和误差大小。计算方法为
$$ \Delta B=B^{{\rm{IGRF}}}-B^{{\rm{OB}}} \text{,} $$ (4) $$ {\rm{RMS}}= \sqrt{\frac{{\displaystyle\sum _{i=1}^{n}} ( {{B_ i^{\mathrm{I}\mathrm{G}\mathrm{R}\mathrm{F}}}-{B_ i^{\mathrm{O}\mathrm{B}}}} ) ^{2}}{n}} \text{,} $$ (5) 式中,BIGRF为IGRF13模型计算值,BOB为台站实际观测数据的通日年均值,n为地磁台站个数。
2. 结果和讨论
2.1 IGRF13模型在中国地区变化特征
因地磁场是矢量场,由七个地磁要素组成,即磁偏角D、磁倾角I、水平分量H、北向分量X、东向分量Y、垂直分量Z和总强度F。为了描述2015—2020年我国区域地磁场,本文计算了我国区域28个地磁台七要素模型的长期平均年变率,并采用克里金插值法绘制了中国区域地磁七要素的等变线图(图1)。下文将详细阐述2015—2020年第13代参考模型年变率在中国地区的时空变化特征。
![]() 图 1 2015—2020年中国地区IGRF13模型七要素等变线分布图(a) 磁偏角D;(b) 磁倾角I;(c) 水平分量H;(d) 北向分量X;(e) 东向分量Y;(f) 垂直分量Z;(g) 地磁场总强度FFigure 1. Distribution map of isometric lines of seven elements of IGRF13 model values in China during 2015−2020(a) Magnetic declination D;(b) Magnetic dip I;(c) Horizontal component H;(d) North component X; (e) East component Y;(f) Vertical component Z;(g) Geomagnetic field total intensity F
图 1 2015—2020年中国地区IGRF13模型七要素等变线分布图(a) 磁偏角D;(b) 磁倾角I;(c) 水平分量H;(d) 北向分量X;(e) 东向分量Y;(f) 垂直分量Z;(g) 地磁场总强度FFigure 1. Distribution map of isometric lines of seven elements of IGRF13 model values in China during 2015−2020(a) Magnetic declination D;(b) Magnetic dip I;(c) Horizontal component H;(d) North component X; (e) East component Y;(f) Vertical component Z;(g) Geomagnetic field total intensity F图1a为模型磁偏角D的年变率分布情况。中国地区磁偏角存在偏东和偏西两种情况,东部为负(西偏),西部为正(东偏)。中国大部地磁偏角偏西,为负值。大部分地区D年变率为负值,说明中国地区地磁偏角逐渐向西漂移。D长期平均年变率最小值位于东北地区满洲里台,为−6.41′/a,最大值位于西北地区,为1.25′/a,等变线大致沿子午线(经线)方向南北延伸。零等变线位于我国西部,大至从75°E—85°E附近穿过,并随经度的增加D年变率逐渐变小,曲线呈现由SSW向NNE方向汇集的趋势。相比2005—2010年IGRE11磁偏角零等变线处于80°E—90°E附近(陈斌等,2012),2015—2020年IGRE13磁偏角D的零等变线沿着经度线向西偏移。
图1b和1f分别为磁倾角I和垂直分量Z分布曲线,两者长期年变率均为正值,且均呈现上升趋势,空间分布形态相近,等变线呈现出自NE向SW方向逐渐增大的趋势。I年变率最大值位于通海台,为6.76′/a,Z平均年变率最大值位于拉萨台,为127.8 nT/a;磁倾角I和垂直分量Z年变率最小值均位于东北地区,分别为1.75′/a和33.0 nT/a.
图1c和1d分别为水平分量H和北向分量X分布曲线。2015—2020年中国大部分地区地磁场水平分量呈现下降趋势,长期年变率是负值,只有少部分台站是正值,H长期平均年变率介于−41.4—4.2 nT/a之间,最大值位于华南地区,最小值位于西北地区;X长期平均年变率介于−40.7—3.0 nT/a之间,X年变率最大值在华南地区的琼中台,X最小值在西北地区的乌鲁木齐台。H和X年变率等变线形态一致,等变线曲线表现为沿纬度分布,同一经度线等变线呈南高北低趋势,年变率随台站纬度的增大呈缓慢减小趋势。X和H零等变线位于(19°N—25°N,98°E—126°E)附近,与2005—2015年X和H零等值线相比,10年间地磁场东向分量和北向分量的零等变线沿纬度逐渐向高纬度方向移动。
图1e为东向分量Y等变线分布曲线,2015—2020年我国大部分台站Y分量为负值,只有西部的拉萨台、乌鲁木齐台和喀什台为正值。Y长期年变率均值为负值,最大值位于西北地区乌鲁木齐,为12.6 nT/a,最小值位于泉州台,为53.2 nT/a。等变线长期年变率曲线大致沿子午线(经度线)方向呈自NW向SE方向,数值逐渐减少,且同一纬度西高东低。零等变线位于75°E—83°E之间,与2005—2010年IGRE11东向分量零等值线在80°E—90°E (陈斌,2012)相比逐渐西移。
图1g为磁场总强度F分布情况。2015—2020在我国区域所有地磁台站地磁总强度F呈上升趋势,F长期平均年变率为正值,增加了55.9 nT/a。总强度F等变线的空间分布形态呈现自WSW向NNE方向逐渐减少的趋势。F年变率最大值位于西北地区,为85.2 nT/a,最小值位于东北地区的满洲里台,为23.3 nT/a。2015—2020年我国地磁场总强度5年不断增加,总强度F呈现出自东向西逐步增大的趋势,等变线数值同一纬度呈现出西高东低的趋势。与2005—2010年相比,2015—2020年零等变线沿着经度线向东移动。
中国区域地磁七要素D,I,H,X,Y,Z,F模型的等变线空间分布比较均匀,个别区域地磁场要素等变线出现曲折的形态变化,说明地磁场局部地区之间存在差异。对于地磁异常区域,如我国东部华北地区和华南的局部地区,等变线呈现出较为明显的异常变化,地磁场七要素零等值线不断变化。
2.2 长期变化速率
为了比较IGRF13模型与我国实际地磁场变化的差异,本文计算了2015—2020年地磁场七要素IGRF13模型年变率与实际观测值年变率的差值,各要素的平均年变率差值分别为ΔD=0.17′/a,ΔI=0.47′/a,ΔH=−6.0 nT/a,ΔX=−5.2 nT/a,ΔY=−2.6 nT/a,ΔZ=5.0 nT/a,ΔF=−0.1 nT/a。
因地磁场是矢量场,一般用地磁场总强度F表示地区地磁场的大小程度。本文以地磁总强度为例,具体分析讨论IGRF13参考模型与我国区域台站实际地磁场长期变化速率之间的差异。
图1为我国区域地磁台IGRF13模型总强度平均年变率与实际地磁场总强度平均年变率对比图,28个地磁台IGRF13地磁场总强度模型值长期变化速率与实际地磁场变化速率基本一致。
2015—2020年我国区域IGRF13模型地磁场总强度平均年变率为55.9 nT/a,实际地磁场总强度平均年变率为56.0 nT/a,IGRF13模型的长期变化速率比实际地磁场小0.08 nT/a,IGRF13参考模型年变率为实际地磁场年变率的99.9%,IGRF13模型基本可以反映地磁台的磁场变化。
从图2可以看出,28个台站之间地磁场总强度的长期平均年变率不同,IGRF13模型地磁场总强度年变率与实际观测地磁年变率差值介于−4.4—5.8 nT/a之间。我国28个台站所处的地理环境和位置不同,说明不同地质环境下的磁场变化和速度变化也不同,地磁场的变化不统一,且随时间的变化不均匀,说明地磁场变化具有非线性的特点。研究结果也表明地磁长期变化具有区域性与局部性的变化特征。
![]() 图 2 2015—2020年地磁场总强度F的IGRF13模型值与台站观测值长期年变速率Figure 2. IGRF13 model value of total intensity of geomagnetic field F and long-term annual variation rate of observed values at the station during 2015−2020
图 2 2015—2020年地磁场总强度F的IGRF13模型值与台站观测值长期年变速率Figure 2. IGRF13 model value of total intensity of geomagnetic field F and long-term annual variation rate of observed values at the station during 2015−20202.3 误差分析
地磁场的各种模型都是对地球磁场的一种近似描述,着重于描述地磁场的时空特征,而不追求局部细节,因此,凡是模型,必然存在误差。由于地磁台站覆盖面积有限,观测到的数据并不能表征全球各个区域的地磁场随时间的变化情况(徐文耀等,2011;刘元元等,2013),因此IGFR13模型值与台站实际观测值之间存在着各种误差。
把台站观测值的年均值当作标准,模型值与年均值之间的差即本文的差值ΔB。为了比较IGRF13模型值与实际观测值之间的差异,根据式(4)和式(5)计算了2015—2020年地磁要素D,I,H,F,Y,X和Z每年IGRF13模型值与台站观测值的差值、差值的平均值及均方误差,结果列于表1。
表 1 2015—2020年地磁场七要素IGRF13模型值与观测值的差值及均方误差Table 1. Difference between model values of IGRF13 and observed values and mean square error for seven elements of the geomagnetic field during 2015−2020台站名称 D/′ I/′ H/nT F/nT X/nT Y/nT Z/nT MZL 1.2 −2.4 172 370 171 −21 330 DED 17.5 9.3 −72 134 −64 116 169 CNH −3.7 16.3 −188 91 −190 6 202 WMQ −2.4 −26.6 301 −236 302 −1 −401 HHH −3.9 −7.4 1 −210 −2 −31 −242 JYG −1.2 −2.2 −17 −96 −17 −9 −102 CHL 9.4 0.1 81 157 90 66 134 KSH −12.6 −12.0 90 −143 97 −93 −218 DLG 11.5 −49.3 437 −385 446 34 −736 JIH −2.6 −7.1 78 −31 75 −31 −85 TAY 3.1 2.0 −38 −31 −36 30 −12 LYH 13.5 0.4 77 147 89 109 126 GLM −1.3 14.5 −91 174 −91 −12 272 TAA −24.1 49.9 −600 33 −619 −151 474 LZH 0.5 4.7 −2 103 −2 4 127 ZZH −16.0 −3.8 4 −70 −8 −146 −90 TSY −8.5 7.5 −37 92 −41 −76 143 QIX −0.9 3.7 26 120 25 −10 131 COM −16.3 −6.2 −43 −161 −59 −152 −178 CDP −7.8 0.3 1 6 −2 −77 7 LSA 31.7 8.1 −256 −247 −254 319 −98 XIC 19.3 14.7 −205 −83 −199 208 96 SYG 1.3 −1.6 23 12 24 13 −8 QZH 1.8 −2.2 48 38 49 15 0 THJ 0.2 −13.0 26 −100 26 1 −202 GZH −6.4 9.5 −50 27 −53 −68 120 YON 1.1 1.6 −13 −1 −13 13 17 QGZ 3.8 0.0 −20 −23 −19 44 −12 平均值 0.3 0.3 −9.6 −11.2 −9.8 3.6 1.3 均方根差 11.5 16.3 178.9 156.6 182.4 100.7 236.0 从表1可以看出,我国地磁台站的IGRF13模型值与实际地磁场观测值之间的差值各不相同,有正有负,且同一台站不同要素的模型值与观测值的差值也不同,相差较大;对同一地磁要素,不同台站之间的模型值和观测值的差值也不同。从表中可以看出,MZL (满洲里台)、WMQ (乌鲁木齐台)、DLG (大连台)、TAA (泰安台)和LSA (拉萨台)不同分量IGRF-13模型值与实际地磁观测数据差值较大:如TAA (泰安台)地磁七要素中五个要素(D,I,H,X,Z)的差值较大,H和X分量差值达到了−600 nT和−619 nT,可能与泰安台处于磁异常有关;WMQ (乌鲁木齐台)的Z分量差值为−401 nT,经仔细核查发现该台站Z的年均值在2013年比2012年增加了484 nT,需要在观测环境、数据处理质量和地磁场变化方面进行分析。
IGRF模型的一般全球估计精度为50—300 nT,磁偏角和磁倾角精度在30′之内(聂琳娟等,2017),据此可排除因受台站所在磁异常位置、观测环境、观测质量、数据处理、地球物理场变化及地质构造运动等情况(陈斌等,2012)的影响而超出300 nT和30′误差的数据,我国区域地磁场H,X,Y,Z,F分量差值及均方根误差分别−16.3 nT,95.4 nT;−16.2 nT,95.9 nT;−8.1 nT,81.0 nT;12.3 nT,142.2 nT;−16.3 nT,95.4 nT。D和I的差值及均方根误差分别为−2.2′,9.9′和−0.3′,9.4′。排除差值较大的数据,均方误差更小,精度更高,IGRF13模型能充分体现中国区域地磁场的变化特征。
3. 结论
通过对2015—2020年我国28个地磁台IGRF13模型长期年变率、长期变化速率和差值等的分析,得到如下结论:
我国区域地磁场分布特征:磁偏角D和东向分量Y等变线大致沿子午线(经度线)方向,零变线将中国分为东西两部分,并逐渐向西漂移;垂直分量Z和磁倾角I等变线呈现沿NE向SW逐渐增大的趋势;水平分量H与北向分量X等变线呈现为沿纬度圈分布,并向高纬度方向移动;地磁场总强度F处于上升阶段,呈现从东向西逐渐增大的趋势,零等变线沿经度线向东移动。
第13代国际地磁参考场(IGRF13)模型的长期变化速率为实际地磁场变化速率的99.9%,即两者的长期变化基本一致,但也存在一定差异。其中台站的误差较大,例如泰安地磁台,可能与台站周边地理环境、地质构造及地磁场变化等有关。
2015—2020年国际地磁参考场(IGRF13)能体现中国地区磁场长期变化的空间分布特征,也能反映我国区域地磁场和局部磁异常,但在应用IGRF13模型数据时,需要考虑局部区域的地理环境和台站实际观测数据的误差等因素。
中国地震局地球物理研究所国家地磁台网中心提供了文中所用的地磁数据,作者在此表示感谢。
-
![]()
图 1 本文研究涉及的活动构造地块和震例时空分布图
图中地块边界据张培震等(2003),红色虚线圈代表震前存在地震活动显著增强现象的震例
Figure 1. Active tectonic blocks and the spatio-temporal distributions of earthquake cases used in this study
(The block boundaries refer to Zhang et al (2003),red dashed circles represents earthquake cases with enhanced seismicity prior to large earthquakes
![]()
图 2 中国大陆西部(a)和东部(b)不同震级档和空间尺度的地震前存在地震活动增强现象的震例个数
Figure 2. The number of earthquake cases with premonitory enhanced seismicity at different spatial scaleand magnitude class in western (a) and eastern (b) Chinese mainland,respectively
![]()
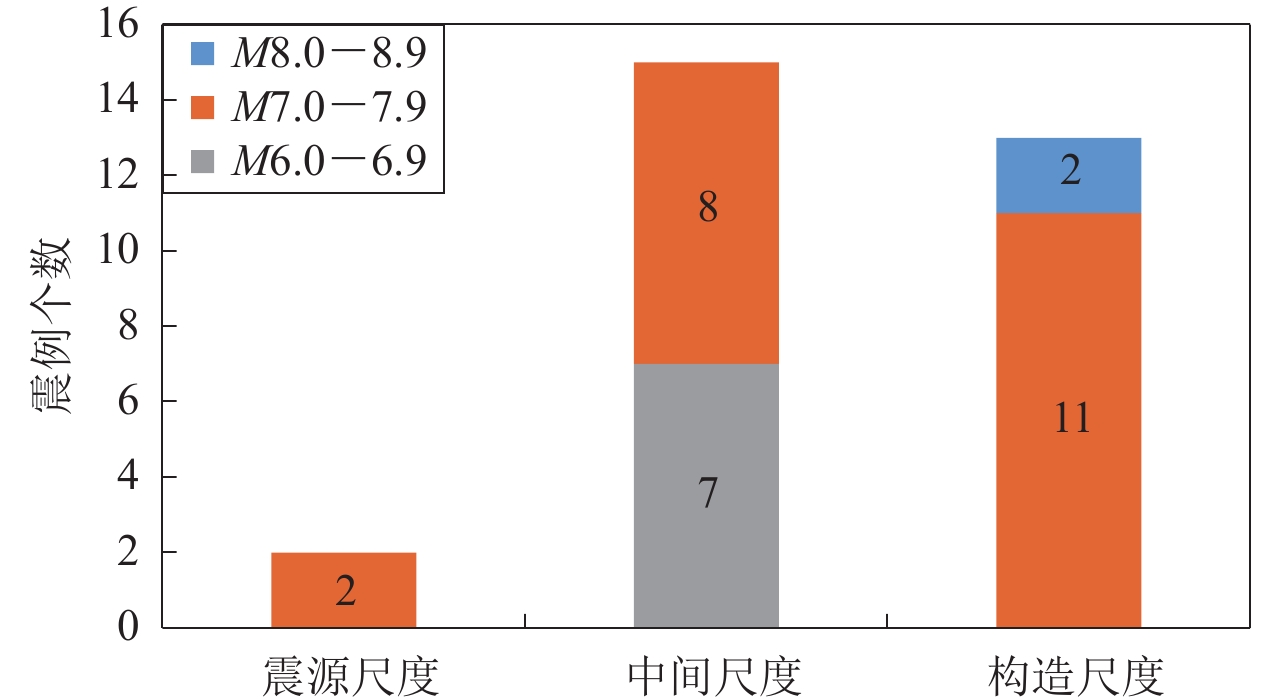
图 3 不同震级档和空间尺度的地震前存在地震活动增强现象的个数
Figure 3. The number of earthquake cases with premonitory enhanced seismicity at different spatial scale and magnitude
![]()
图 4 中国大陆西部(a)和东部(b)前兆地震活动增强的震级统计特征
Figure 4. Magnitude statistical characteristics of premonitory enhanced seismicity in western (a) and eastern (b) Chinese mainland respectively
![]()
图 5 中国大陆西部和东部的前兆地震活动增强时间尺度统计特征
Figure 5. Temporal statistical characteristics of premonitory enhanced seismicity in western and eastern Chinese mainland respectively
![]()
图 6 中国大陆西部和东部地震活动增强的时间尺度随震级的变化
Figure 6. Temporal scales variation of premonitory enhanced seismicity with magnitude in western and eastern Chinese mainland respectively
![]()
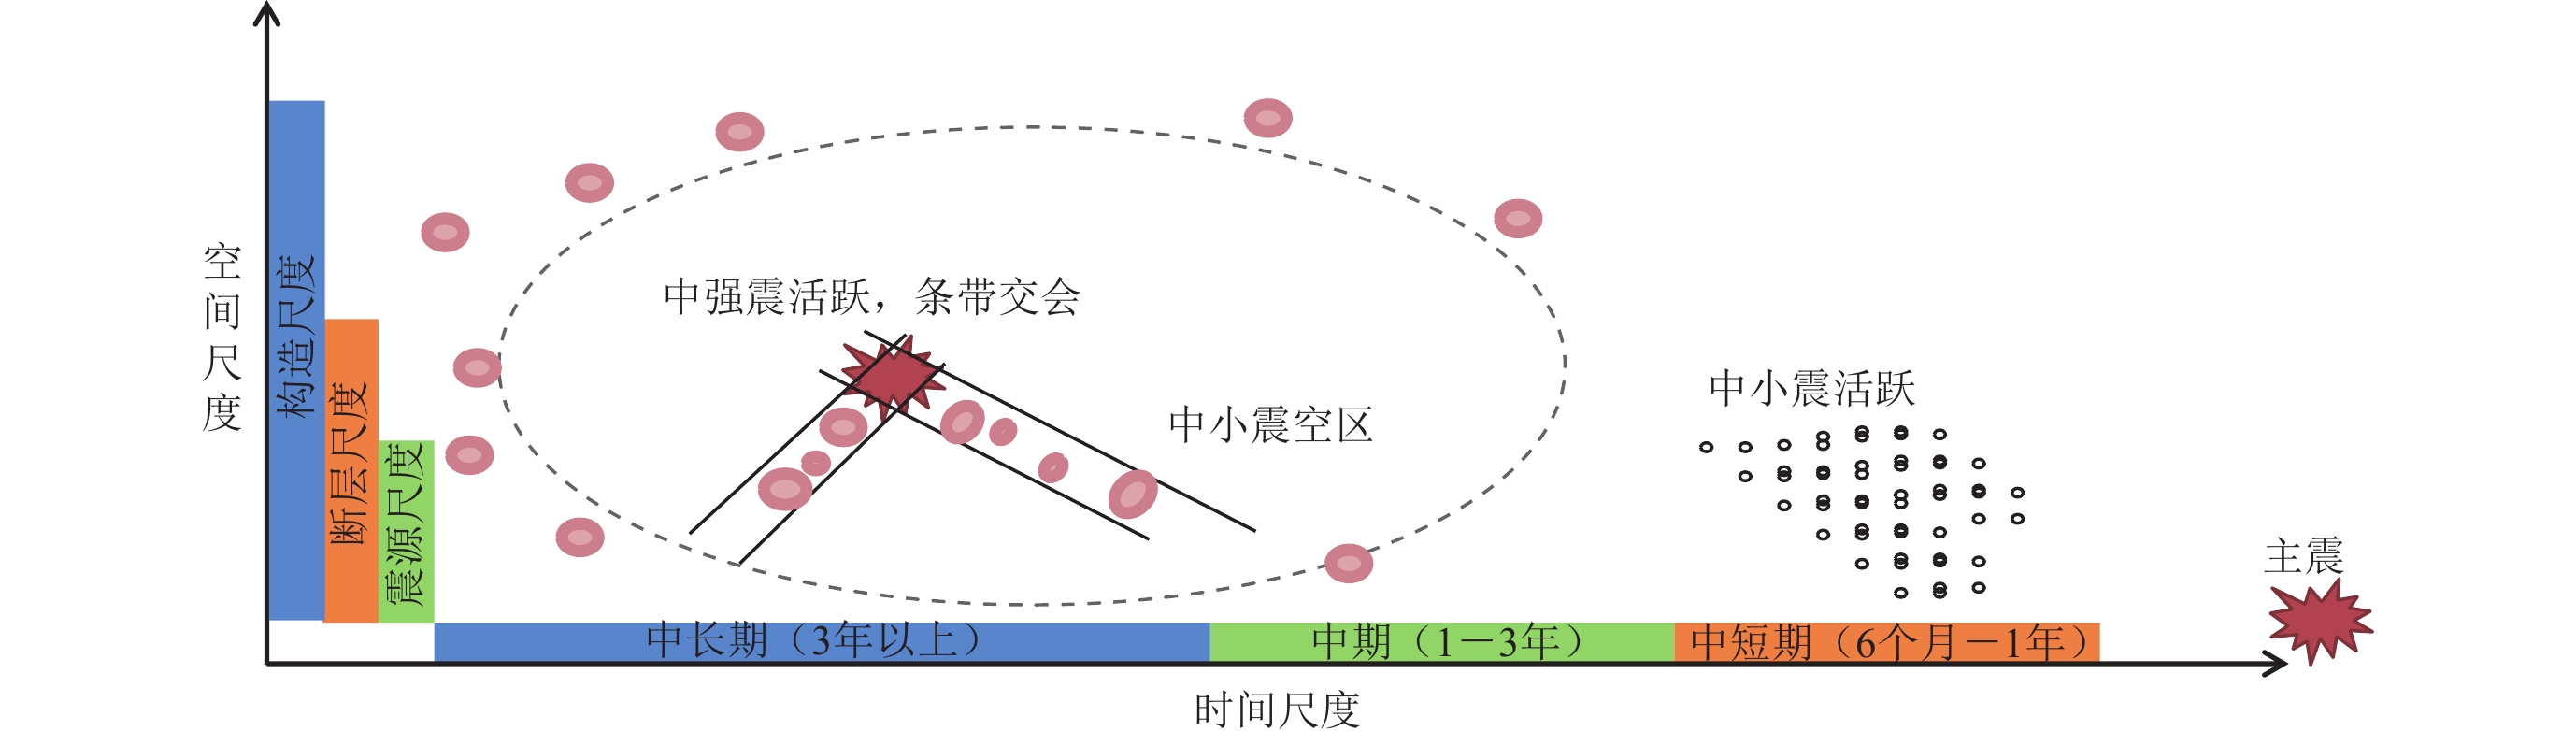
图 7 川滇菱形地块内震前地震活动增强的时空特征演化示意图
Figure 7. Schematic illustration of spatio-temporal evolution characteristics of premonitory enhanced seismicity in the Sichuan-Yunnan rhombic block
![]()
图 8 巴颜喀拉地块地震活动增强特征的时空演化示意图
Figure 8. Schematic illustration of the spatio-temporal evolution of the premonitory enhanced seismicity of the Bayan Har block
![]()
图 9 地震活动增强与大震孕育相互关系模式示意图(修改自Kato,Ben-Zion,2021)
(a) 地震活动增强引发较大范围的分布式岩石损伤;(b) 前震序列发生在大震时空紧邻区地区,岩石集中损伤;(c) 地震活动增强、前震组合形式的大震触发模型
Figure 9. Schematic illustrations of the relationship between enhanced seismicity and generation processes of strong earthquakes (modified from Kato and Ben-Zion,2021)
(a) Rock damage caused by enhanced seismicity in large scale;(b) Localization of deformation around the eventual rupture zone caused by foreshocks;(c) An integrated model including enhanced seismicity and foreshocks for the initiation of strong earthquake
表 1 本文所用具有前兆地震活动增强的震例基本信息
Table 1 Basic information of earthquake cases with premonitory enhanced seismicity used in this study
序号 发震时间
年-月-日北纬/° 东经/° MS 深度/km 地点 是否存在震前
地震活动增强1 1 966−03−22 31.50 115.00 7.2 9 邢台 是 2 1 967−03−27 38.50 116.50 6.3 30 河间 3 1 969−07−26 21.75 111.75 6.4 5 阳江 4 1 970−01−05 24.10 102.60 7.8 13 通海 5 1 973−02−06 31.50 100.40 7.6 17 炉霍 是 6 1 974−05−11 28.10 104.00 7.1 14 大关 是 7 1 975−02−04 40.70 122.80 7.3 16 海城 是 8 1 976−04−06 40.20 112.10 6.3 18 和林格尔 是 9 1 976−05−29 24.55 98.75 7.4 21 龙陵 是 10 1 976−07−28 39.60 118.20 7.8 11 唐山 是 11 1 976−08−16 32.70 104.08 7.2 15 松潘 12 1 976−09−23 40.00 106.35 6.2 35 巴音木仁 13 1 977−05−12 39.20 117.70 6.2 1 9 宁河 14 1 979−07−09 31.50 119.30 6.0 12 溧阳 15 1 979−08−25 41.23 108.11 6.0 30 五原 是 16 1 984−05−21 32.70 121.60 6.2 17 南黄海 是 17 1 985−08−23 39.58 75.60 7.4 7 乌恰 18 1 988−11−06 22.83 99.72 7.5 13 澜沧-耿马 是 1 9 1 990−04−26 36.12 100.13 7.0 32 共和 是 20 1 994−12−31 20.52 109.32 6.1 7 北部湾 21 1 995−07−12 21.98 99.07 7.3 10 孟连西 是 22 1 996−02−03 27.30 100.22 7.0 10 丽江 是 23 1 996−11−19 35.43 78.35 7.1 16 和田 是 24 1 998−01−10 41.10 114.30 6.2 10 尚义 25 2 001−11−14 35.93 90.53 8.1 10 昆仑山西口 是 26 2 008−03−21 35.80 81.43 7.3 33 于田 27 2 008−05−12 31.00 103.40 8.0 14 汶川 是 28 2 010−04−14 33.10 96.70 7.1 33 玉树 是 29 2 013−04−20 30.30 103.00 7.0 13 芦山 是 30 2 014−02−12 36.10 82.50 7.3 12 于田 31 2 017−08−08 33.20 103.82 7.0 20 九寨沟 是 32 1 989−10−19 39.94 113.84 6.1 14 大同-阳高 是 33 1 996−05−03 40.83 109.62 6.4 20 包头 是  下载: 导出CSV
-
陈棋福. 2002a. 中国震例(1992—1994)[M]. 北京:地震出版社:1−428. Chen Q F. 2002a. Earthquake Cases in China (1992−1994)[M]. Beijing:Seismological Press:1−428 (in Chinese).
陈棋福. 2002b. 中国震例(1995—1996)[M]. 北京:地震出版社:1−488. Chen Q F. 2002b. Earthquake Cases in China (1995−1996)[M]. Beijing:Seismological Press:1−488 (in Chinese).
陈棋福. 2003. 中国震例(1997—1999)[M]. 北京:地震出版社:1−468. Chen Q F. 2003. Earthquake Cases in China (1997−1999)[M]. Beijing:Seismological Press:1−468 (in Chinese).
陈棋福. 2008. 中国震例(2000—2002)[M]. 北京:地震出版社:1−570. Chen Q F. 2008. Earthquake Cases in China (2000−2002)[M]. Beijing:Seismological Press:1−570 (in Chinese).
邓起东,张培震,冉勇康,杨晓平,闵伟,楚全芝. 2002. 中国活动构造基本特征[J]. 中国科学(D辑),32(12):1020–1030. Deng Q D,Zhang P Z,Ran Y K,Yang X P,Min W,Chu Q Z. 2003. Basic characteristics of active tectonics of China[J]. Science in China:Series D,46(4):356–372. doi: 10.1360/03yd9032
国家地震局 《一九七六年唐山地震》 编辑组. 1982. 一九七六年唐山地震[M]. 北京:地震出版社:171−180. Editorial Group of 1976 Tangshan Earthquake,State Seismological Bureau. 1982. 1976 Tangshan Earthquake[M]. Beijing:Seismological Press:171−180 (in Chinese).
蒋海昆. 2014. 中国震例(2003—2006)[M]. 北京:地震出版社:1−775. Jiang H K. 2014. Earthquake Cases in China (2003−2006)[M]. Beijing:Seismological Press:1−775 (in Chinese).
蒋海昆. 2018a. 中国震例(2007—2010)[M]. 北京:地震出版社:1−513. Jiang H K. 2018a. Earthquake Cases in China (2000−2002)[M]. Beijing:Seismological Press:1−513 (in Chinese).
蒋海昆. 2018b. 中国震例(2011—2012)[M]. 北京:地震出版社:1−437. Jiang H K. 2018b. Earthquake Cases in China (2011−2012)[M]. Beijing:Seismological Press:1−437 (in Chinese).
梅世蓉. 1960. 中国的地震活动性[J]. 地球物理学报,9(1):1–19. Mei S R. 1960. Seismicity in China[J]. Acta Geophysica Sinica, 9 (1):1−19 (in Chinese).
梅世蓉. 1995. 地震前兆场物理模式与前兆时空分布机制研究(一):固体孕震模式的由来与证据[J]. 地震学报,17(3):273–282. Mei S R. 1995. On the physical model of earthquake precursor fields and the mechanism of precursors’ time and space distribution ( Ⅰ ):Origin and evidences of the strong body earthquake-generating model[J]. Acta Seismologica Sinica, 8 (3):337−349.
梅世蓉. 1996. 地震前兆场物理模式与前兆时空分布机制研究(二) :强震孕育时应力、应变场的演化与地震活动、地震前兆的关系[J]. 地震学报, 18 (1):1−10. Mei S R. 1996. Physical models of earthquake precursor fields and spatial-temporal distribution mechanisms of precursors distribution mechanism study ( Ⅱ ):Evolution of stress and strain fields in relation to seismic activity and earthquake precursors[J]. Acta Seismologica Sinica,9(1):1–12.
宋治平,梅世蓉,尹祥础. 1999. 强大地震前地震活动增强区及其力学研究[J]. 地震学报,21(3):271–277. Song Z P,Mei S R,Yin X C. 1999. On seismic strengthening area before strong and great shocks and its mechanism[J]. Acta Seismologica Sinica, 12 (3):298−305.
王筱荣. 2005. 新疆强震前地震活动增强研究[J]. 华南地震,25(1):17–23. doi: 10.3969/j.issn.1001-8662.2005.01.003 Wang X R. 2005. Research on seismicity increasing before strong earthquake in Xinjiang[J]. South China Journal of Seismology,25(1):17–23 (in Chinese).
闻学泽,杜方,张培震,龙锋. 2011. 巴颜喀拉块体北和东边界大地震序列的关联性与2008年汶川地震[J]. 地球物理学报,54(3):706–716. doi: 10.3969/j.issn.0001-5733.2011.03.010 Wen X Z,Du F,Zhang P Z,Long F. 2011. Correlation of major earthquake sequences on the northern and eastern boundaries of the Bayan Har block,and its relation to the 2008 Wenchuan earthquake[J]. Chinese Journal of Geophysics,54(3):706–716 (in Chinese).
薛丁. 2003. 包头西6.4级地震前显著中等地震活动增强和丛集异常[J]. 地震,23(4):71–76. doi: 10.3969/j.issn.1000-3274.2003.04.011 Xue D. 2003. Obvious intensifying and swarming anomaly of moderate seismic activity before west Baotou earthquake with M=6.4[J]. Earthquake,23(4):71–76 (in Chinese).
薛艳,刘杰,宋治平,黎明晓. 2018. 汶川地震前地震活动特征的普遍性及其机理探讨[J]. 地球物理学报,61(5):1891–1906. Xue Y,Liu J,Song Z P,Li M X. 2018. On the universality and mechanism interpretation of the seismicity characteristics before the 2008 Wenchuan MS8.0 earthquake[J]. Chinese Journal of Geophysics,61(5):1891–1906 (in Chinese).
晏锐,田雷,王广才,钟骏,刘杰,周志华. 2018. 2008年汶川8.0级地震前地下流体异常回顾与统计特征分析[J]. 地球物理学报,61(5):1907–1921. Yan R,Tian L,Wang G C,Zhong J,Liu J,Zhou Z H. 2018. Review and statistically characteristic analysis of underground fluid anomalies prior to the 2008 Wenchuan MS8.0 earthquake[J]. Chinese Journal of Geophysics,61(5):1907–1921 (in Chinese).
张国民,马宏生,王辉,王新岭. 2005. 中国大陆活动地块边界带与强震活动[J]. 地球物理学报,48(3):602–610. doi: 10.3321/j.issn:0001-5733.2005.03.018 Zhang G M,Ma H S,Wang H,Wang X L. 2005. Boundaries between active-tectonic blocks and strong earthquakes in the China mainland[J]. Chinese Journal of Geophysics,48(3):602–610 (in Chinese). doi: 10.1002/cjg2.693
张培震,邓起东,张国民,马瑾,甘卫军,闵伟,毛凤英,王琪. 2003. 中国大陆的强震活动与活动地块[J]. 中国科学(D辑),33(增刊1):12–20. Zhang P Z,Deng Q D,Zhang G M,Ma J,Gan W J,Min W,Mao F Y,Wang Q. 2003. Active tectonic blocks and strong earthquakes in the continent of China[J]. Science in China:Series D,46(S2):13–24. doi: 10.1360/03dz0002
张培震,闻学泽,徐锡伟,甘卫军,王敏,沈正康,王庆良,黄媛,郑勇,李小军,张竹琪,马胜利,冉勇康,刘启元,丁志峰,吴建平. 2009. 2008年汶川8.0级特大地震孕育和发生的多单元组合模式[J]. 科学通报,54(7):944–953. Zhang P Z,Wen X Z,Xu X W,Gan W J,Wang M,Shen Z K,Wang Q L,Huang Y,Zheng Y,Li X J,Zhang Z Q,Ma S L,Ran Y K,Liu Q Y,Ding Z F,Wu J P. 2009. Tectonic model of the great Wenchuan earthquake of May 12,2008,Sichuan,China[J]. Chinese Science Bulletin,54(7):944–953 (in Chinese). doi: 10.1360/csb2009-54-7-944
张肇诚. 1988. 中国震例(1966—1975)[M]. 北京:地震出版社:1−222. Zhang Z C. 1988. Earthquake Cases in China (1966−1975)[M]. Beijing:Seismological Press:1−222 (in Chinese).
张肇诚. 1990a. 中国震例(1976—1980)[M]. 北京:地震出版社:1−294. Zhang Z C. 1990a. Earthquake Cases in China (1976−1980)[M]. Beijing:Seismological Press:1−294 (in Chinese).
张肇诚. 1990b. 中国震例(1981—1985)[M]. 北京:地震出版社:1−222. Zhang Z C. 1990b. Earthquake Cases in China (1981−1985)[M]. Beijing:Seismological Press:1−222 (in Chinese).
张肇诚. 1999. 中国震例(1986—1988)[M]. 北京:地震出版社:1−394. Zhang Z C. 1999. Earthquake Cases in China (1986−1988)[M]. Beijing:Seismological Press:1−394 (in Chinese).
张肇诚. 2000. 中国震例(1989—1991)[M]. 北京:地震出版社:1−453. Zhang Z C. 2000. Earthquake Cases in China (1989−1991)[M]. Beijing:Seismological Press:1−453 (in Chinese).
中国地震局. 2005. GB/T 18207.2—2005 防震减灾术语 第2部分:专业术语[S]. 北京:中国标准出版社:13−14. China Earthquake Administration. 2005. GB/T 18207.2−2005 Terminology of Protecting Against and Mitigating Earthquake Disasters:Part 2:Special Technical Terms[S]. Beijing:Standards Press of China:13−14 (in Chinese).
中国地震局. 2007. DB/T 24-2007 震例总结规范[S]. 北京:地震出版社:4. China Earthquake Administration. 2007. DB/T 24−2007 Specification for Earthquake Case Summarization[S]. Beijing:Seismological Press:4 (in Chinese).
Abercrombie R E. 2019. Small and large earthquakes can have similar starts[J]. Nature,573(7772):42–43. doi: 10.1038/d41586-019-02613-5
Ben-Zion Y. 2008. Collective behavior of earthquakes and faults:Continuum-discrete transitions,progressive evolutionary changes,and different dynamic regimes[J]. Rev Geophys,46(4):RG4006.
Ben-Zion Y,Zaliapin I. 2020. Localization and coalescence of seismicity before large earthquakes[J]. Geophys J Int,223(1):561–583. doi: 10.1093/gji/ggaa315
Burchfiel B C,Royden L H,van der Hilst R D,Hager B H,Chen Z,King R W,Li C,Lü J,Yao H,Kirby E. 2008. A geological and geophysical context for the Wenchuan earthquake of 12 May 2008,Sichuan,People’s Republic of China[J]. GSA Today,18(7):4–11. doi: 10.1130/GSATG18A.1
Fukao Y,Furumoto M. 1985. Hierarchy in earthquake size distribution[J]. Phys Earth Planet Inter,37(2/3):149–168.
Gomberg J. 2018. Unsettled earthquake nucleation[J]. Nat Geosci,11(7):463–464. doi: 10.1038/s41561-018-0149-x
Kato A,Ben-Zion Y. 2021. The generation of large earthquakes[J]. Nat Rev Earth Environ,2(1):26–39.
Lockner D A,Byerlee J D,Kuksenko V,Ponomarev A,Sidorin A. 1991. Quasi-static fault growth and shear fracture energy in granite[J]. Nature,350(6313):39–42. doi: 10.1038/350039a0
Lyakhovsky V,Ben-Zion Y. 2009. Evolving geometrical and material properties of fault zones in a damage rheology model[J]. Geochem Geophys Geosyst,10(11):Q11011.
Lyakhovsky V,Ben-Zion Y,Agnon A. 2001. Earthquake cycle,fault zones,and seismicity patterns in a rheologically layered lithosphere[J]. J Geophys Res:Solid Earth,106(B3):4103–4120.
Mogi K. 1969. Some features of recent seismic activity in and near Japan (2):Activity before and after great earthquakes[J]. Bull Earthq Res Inst,Univ Tokyo, 47 (3):395−417.
Reches Z,Lockner D A. 1994. Nucleation and growth of faults in brittle rocks[J]. J Geophys Res:Solid Earth,99(B9):18159–18173. doi: 10.1029/94JB00115
Renard F,Mcbeck J,Kandula N,Cordonnier B,Meakin P,Ben-Zion Y. 2019. Volumetric and shear processes in crystalline rock approaching faulting[J]. Proc Natl Acad Sci USA,116(33):16234–16239. doi: 10.1073/pnas.1902994116
Ritter M C,Santimano T,Rosenau M,Leever K,Oncken O. 2018. Sandbox rheometry:Co-evolution of stress and strain in Riedel- and Critical Wedge-experiments[J]. Tectonophysics,722:400–409. doi: 10.1016/j.tecto.2017.11.018
Sadovsky M A,Nersesov I L,Nigmatullaev S K,Latynina L A,Lukk A A,Semenov A N,Simbireva I G,Ulomov V I. 1972. The processes preceding strong earthquakes in some regions of Middle Asia[J]. Tectonophysics,14(3/4):295–307.
Schrank C E,Boutelier D A,Cruden A R. 2008. The analogue shear zone:From rheology to associated geometry[J]. J Struct Geol,30(2):177–193. doi: 10.1016/j.jsg.2007.11.002
Tapponnier P,Peltzer G,Le Dain A Y,Armijo R,Cobbold P. 1982. Propagating extrusion tectonics in Asia:New insights from simple experiments with plasticine[J]. Geology,10(12):611–616. doi: 10.1130/0091-7613(1982)10<611:PETIAN>2.0.CO;2
Wan Y G,Shen Z K. 2010. Static Coulomb stress changes on faults caused by the 2008 MW7.9 Wenchuan,China earthquake[J]. Tectonophysics,491(1/2/3/4):105–118.
Wen X Z,Yi G X,Xu X W. 2007. Background and precursory seismicities along and surrounding the Kunlun fault before the MS8.1,2001,Kokoxili earthquake,China[J]. J Asian Earth Sci,30(1):63–72. doi: 10.1016/j.jseaes.2006.07.008
Добровольский ПП. 1991. Теорпя Поцотовп Тегтоппчесго нылдаов фыовлдыо[M]. Мосиова:П3в AH CCCP:1−30.


计量
- 文章访问数: 227
- HTML全文浏览量: 58
- PDF下载量: 72
