

Analysis on magnitude deviation of the 2013 Lushan, Sichuan, MS7.0 earthquake from Automatic Earthquake Location and Report System and its improvement
-
摘要: 使用震中距320 km范围内40个台站的波形记录, 大致还原了2013年4月20日芦山MS7.0地震的自动速报震级测定过程. 结果表明, 在中国地震局对外发布自动速报参数的时间点上, 震级还处于快速上升段, 此时测得的标准震级为M5.8, 与对外公布的标准震级M5.9比较一致, 却远小于之后人工修订的震级M7.0. 分析芦山地震自动速报震级偏差较大的原因: ① 使用限幅记录, 造成震级低估; ② 地震参数发布过于强调快而忽略了准, 参数发布时有些台站的S波(或Lg波)未到达或未完全到达, 造成计算的平均震级偏小. 通过选择合适的震中距范围, 减小限幅记录的影响并适当延时, 在震后137 s得到震级为M6.8. 另外, 应用MWP震级测定方法, 在震后77 s获得矩震级为MW6.8, 显示该方法在测定矩震级时具有快速稳定的优势. 基于上述研究结果, 本文提出改进自动测定震级的措施和方法: ① 对于M<7.0的地震, 在使用ML震级测定方法确定震级时, 需在未限幅台站占绝对优势的震中距范围内使用未限幅记录, 并延时到最远台站的S波(或Lg波)最大振幅到达后测定ML; ② 应用MWP震级测定方法测定大地震的矩震级.Abstract: The procedure of automatic determination of magnitude for the 20 April 2013, Lushan MS7.0 earthquake is roughly reproduced by using the waveforms from 40 stations within epicentral distance of 320 km in this paper. The results demonstrate that the magnitude is rising quickly when the parameters of this earthquake were issued by China Earthquake Administration (CEA). At the moment, the measured standard magnitude M5.8 is consistent well with the M5.9 announced by CEA at almost the same time, but it is much smaller than M7.0 revised by the analyst later. The magnitude determined by Automatic Earthquake Location and Report System deviates largely, and the reasons are: ① The usage of clipped records underestimated the magnitude; ② Rapidness is emphasized and the accuracy is neglected. S (or Lg) wave is absent at some stations when the earthquake parameters are issued, resulting in the magnitude smaller. Therefore, by reducing the effect of clipped records within a proper epicentral range and delaying some seconds, the magnitude will be 6.8 at 137 s after occurrence of the earthquake. Additionally, the determination method of MWP is applied and MW6.8 is available at 77 s after the earthquake, suggesting the determination method of MWP can be applied to get a stable moment magnitude rapidly. Finally, we propose the following measures for improving the method for magnitude determination by Automatic Earthquake Location and Report System. ① The determination method of ML is used for the events with magnitude less than 7.0. In this case, ML should be determined with seismograms without clipped records, selected from the stations within a proper epicentral range in an area where the number of seismograms without clipped records is absolutely predominant. Meanwhile, the determination method of ML should be delayed until the furthest station receives the maximum amplitude of S (or Lg) wave. ② The method for the MWP determination is able to be applied to determine the moment magnitude for large earthquakes.
-
-
![]()
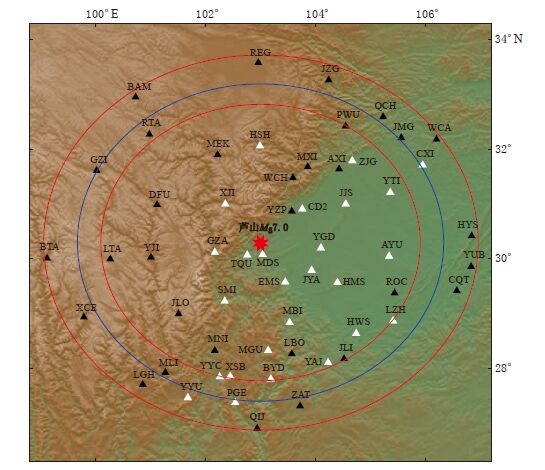
图 1 2013年4月20日芦山MS7.0地震周边地震台站分布 白色三角形为记录限幅台站,黑色三角形为记录未限幅台站,蓝色圆圈表示震中距为320km,两个红色圆圈分别表示震中距为280km 和380km
Figure 1. Distribution of stations around the LushanMS7.0 earthquake on April 20,2013 The white triangles and black triangles represent the stations with clipped records and without clipped records,respectively.The blue circle and two red circles represent the epicentral distances of 320km,280km and 380km,respectively
![]()
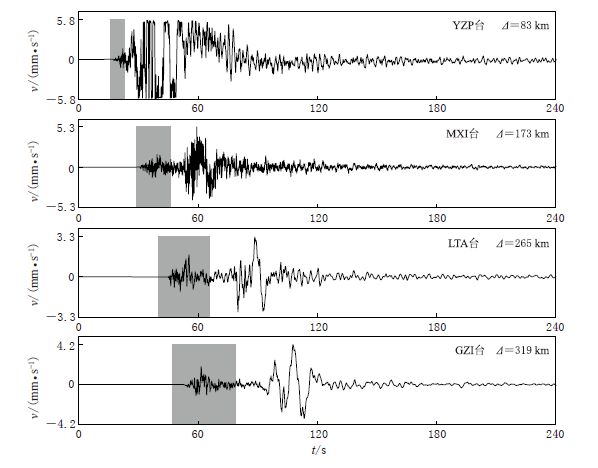
图 2 芦山MS7.0地震震中距320km 范围内部分台站的速度记录图 横轴t为相对于芦山地震发震时刻的时间(下同),灰色框为计算MWP的P波时间窗
Figure 2. The seismograms of velocity recorded by some stations within the epicentral distance of 320km The horizontal axistrepresents the time relative to the origin time of Lushan earthquake(the same below),the time window of P wave used forMWP calculation is marked with gray box
![]()
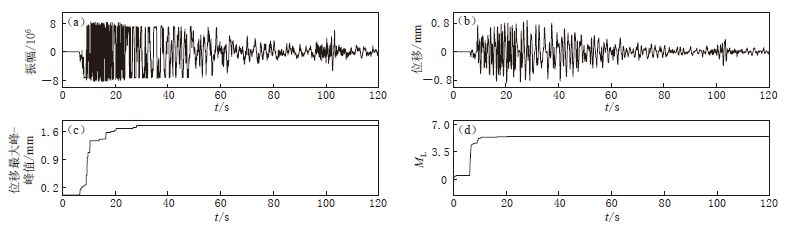
图 3 MDS台由原始宽频带记录到得出ML的处理过程 (a)原始宽频带记录;(b)仿真短周期位移记录;(c)仿真短周期位移最大峰-峰值;(d)ML随时间的变化
Figure 3. The process from raw broadb and seismogram to ML determination for the station MDS (a)The raw broadb and seismogram; (b)The seismogram of simulated short period displacement; (c)The maximum peak-to-peak value of simulated short period displacement; (d)ML variation with time
![]()
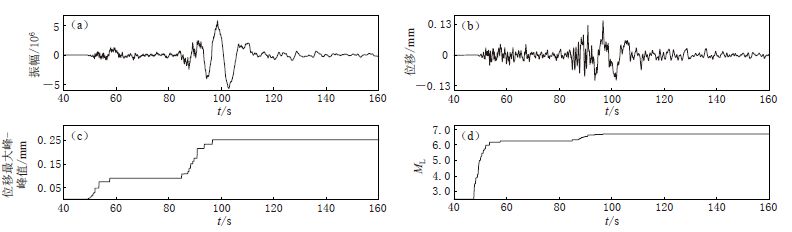
图 4 RTA台由原始宽频带记录到得出ML的处理过程 (a)原始宽频带记录;(b)仿真短周期位移记录;(c)仿真短周期位移最大峰-峰值;(d)ML随时间的变化
Figure 4. The process from raw broadb and seismogram to ML determination for the station RTA (a)The raw broadb and seismogram; (b)The seismogram of simulated short period displacement; (c)The maximum peak-to-peak value of simulated short period displacement; (d)ML variation with time
![]()
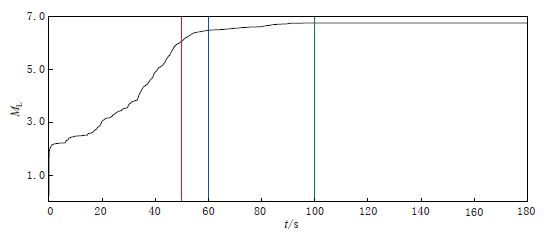
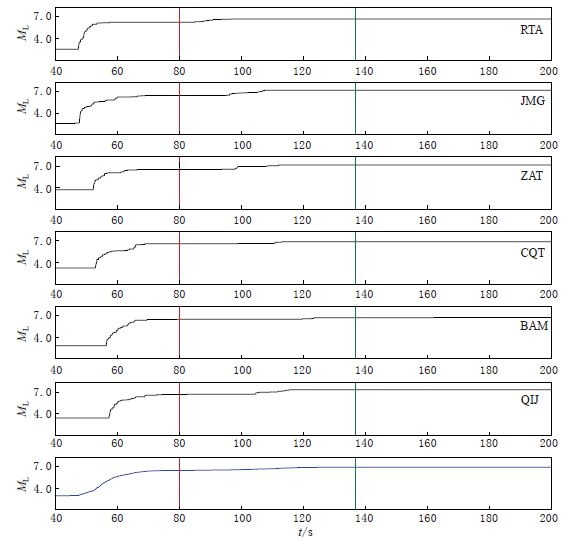
图 5 由震中距320 km范围内全部40个台站测得的平均ML随时间的变化 红色、 蓝色和绿色竖线分别表示震后50 s,60 s和100 s的时间点
Figure 5. Variation of mean ML determined by all 40 stations within the epicentral distance of 320 km with time The red,blue and green lines represent the time 50 s,60 s and 100 s from origin time,respectively
![]()
图 6 由震中距280—380 km范围内部分未限幅台站测得的ML及全部未限幅台站测得的平均ML随时间的变化 黑色曲线和蓝色曲线分别为各台ML和平均ML随时间的变化,红色竖线和绿色竖线分别表示震后80 s和137 s的时间点
Figure 6. Variation of ML determined by some stations without clipped records and mean ML determined by all stations without clipped records with time with the epicentral distances from 280 km to 380 km The black and blue curves represent the ML and the mean ML,the red and green lines represent the time 80 s and 137 s from origin time
![]()
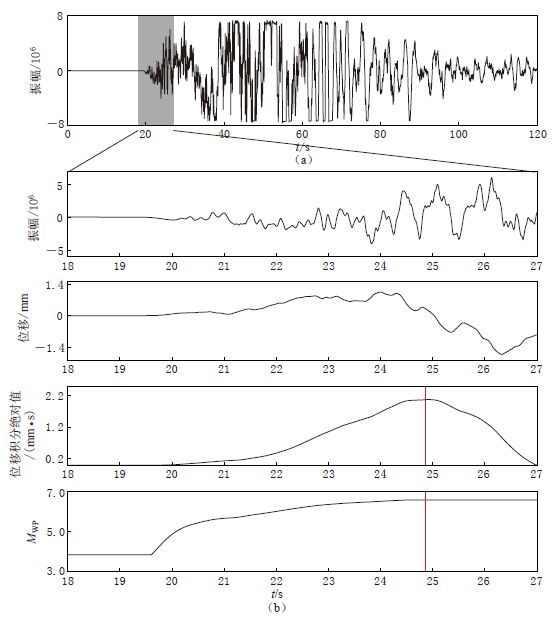
图 7 YA台由原始宽频带记录到得出MWP的处理过程 (a)原始宽频带记录;(b)所取的P波窗口内原始宽频带记录、 位移记录、 位移积分绝对值及MWP随时间的变化
Figure 7. The process from raw broadb and seismogram to MWP determination for the station JYA (a)The raw broadb and seismogram;(b)The raw broadb and seismogram,displacement,the integral absolute value of displacement and MWP variation with time within the required window of P wave
表 1 芦山地震速报过程
Table 1 The rapid information report history for the Lushan earthquake
序号 测定系统/方式 测定时间 测定参数 时:分:秒 北纬/° 东经/° M 1 国家地震速报备份软件系统 08:03:30 30.3 103.0 5.9 08:06:37 30.3 103.2 6.9 2 中国及全球地震自动速报软件系统 08:03:42 30.0 103.0 5.8 08:04:51 30.3 103.0 6.5 3 基于1,2结果综合触发系统 08:03:43 30.1 103.0 5.9 4 西南片区区域自动速报软件系统 08:04:52 30.3 103.0 6.8 5 国家测震台网中心人工速报 08:14:04 30.3 103.0 7.0  下载: 导出CSV
-
Earthworm. 2011. Earthworm modules: Localmag overview[EB/OL].[2013-05-15] . http://www.earthwormcentral.org/documentation2/ovr/localmag_ovr.html.
Saul J, Bormann P. 2007. Rapid estimation of earthquake size using the broadband P-wave magnitude mB[EB/OL].[2013-05-15]. ftp://ftp.gfz-potsdam.de/pub/home/st/saul/SaulBormannPosterAGU2007.pdf.
SeisComp3. 2013. SeisComp3[EB/OL]. [2013-05-15]. http://www.seiscomp3.org/wiki/doc/applications/scmag.
计量
- 文章访问数: 783
- HTML全文浏览量: 472
- PDF下载量: 9
