Moho depth and Poisson’s ratio distribution in the western edge of Ordos block
-
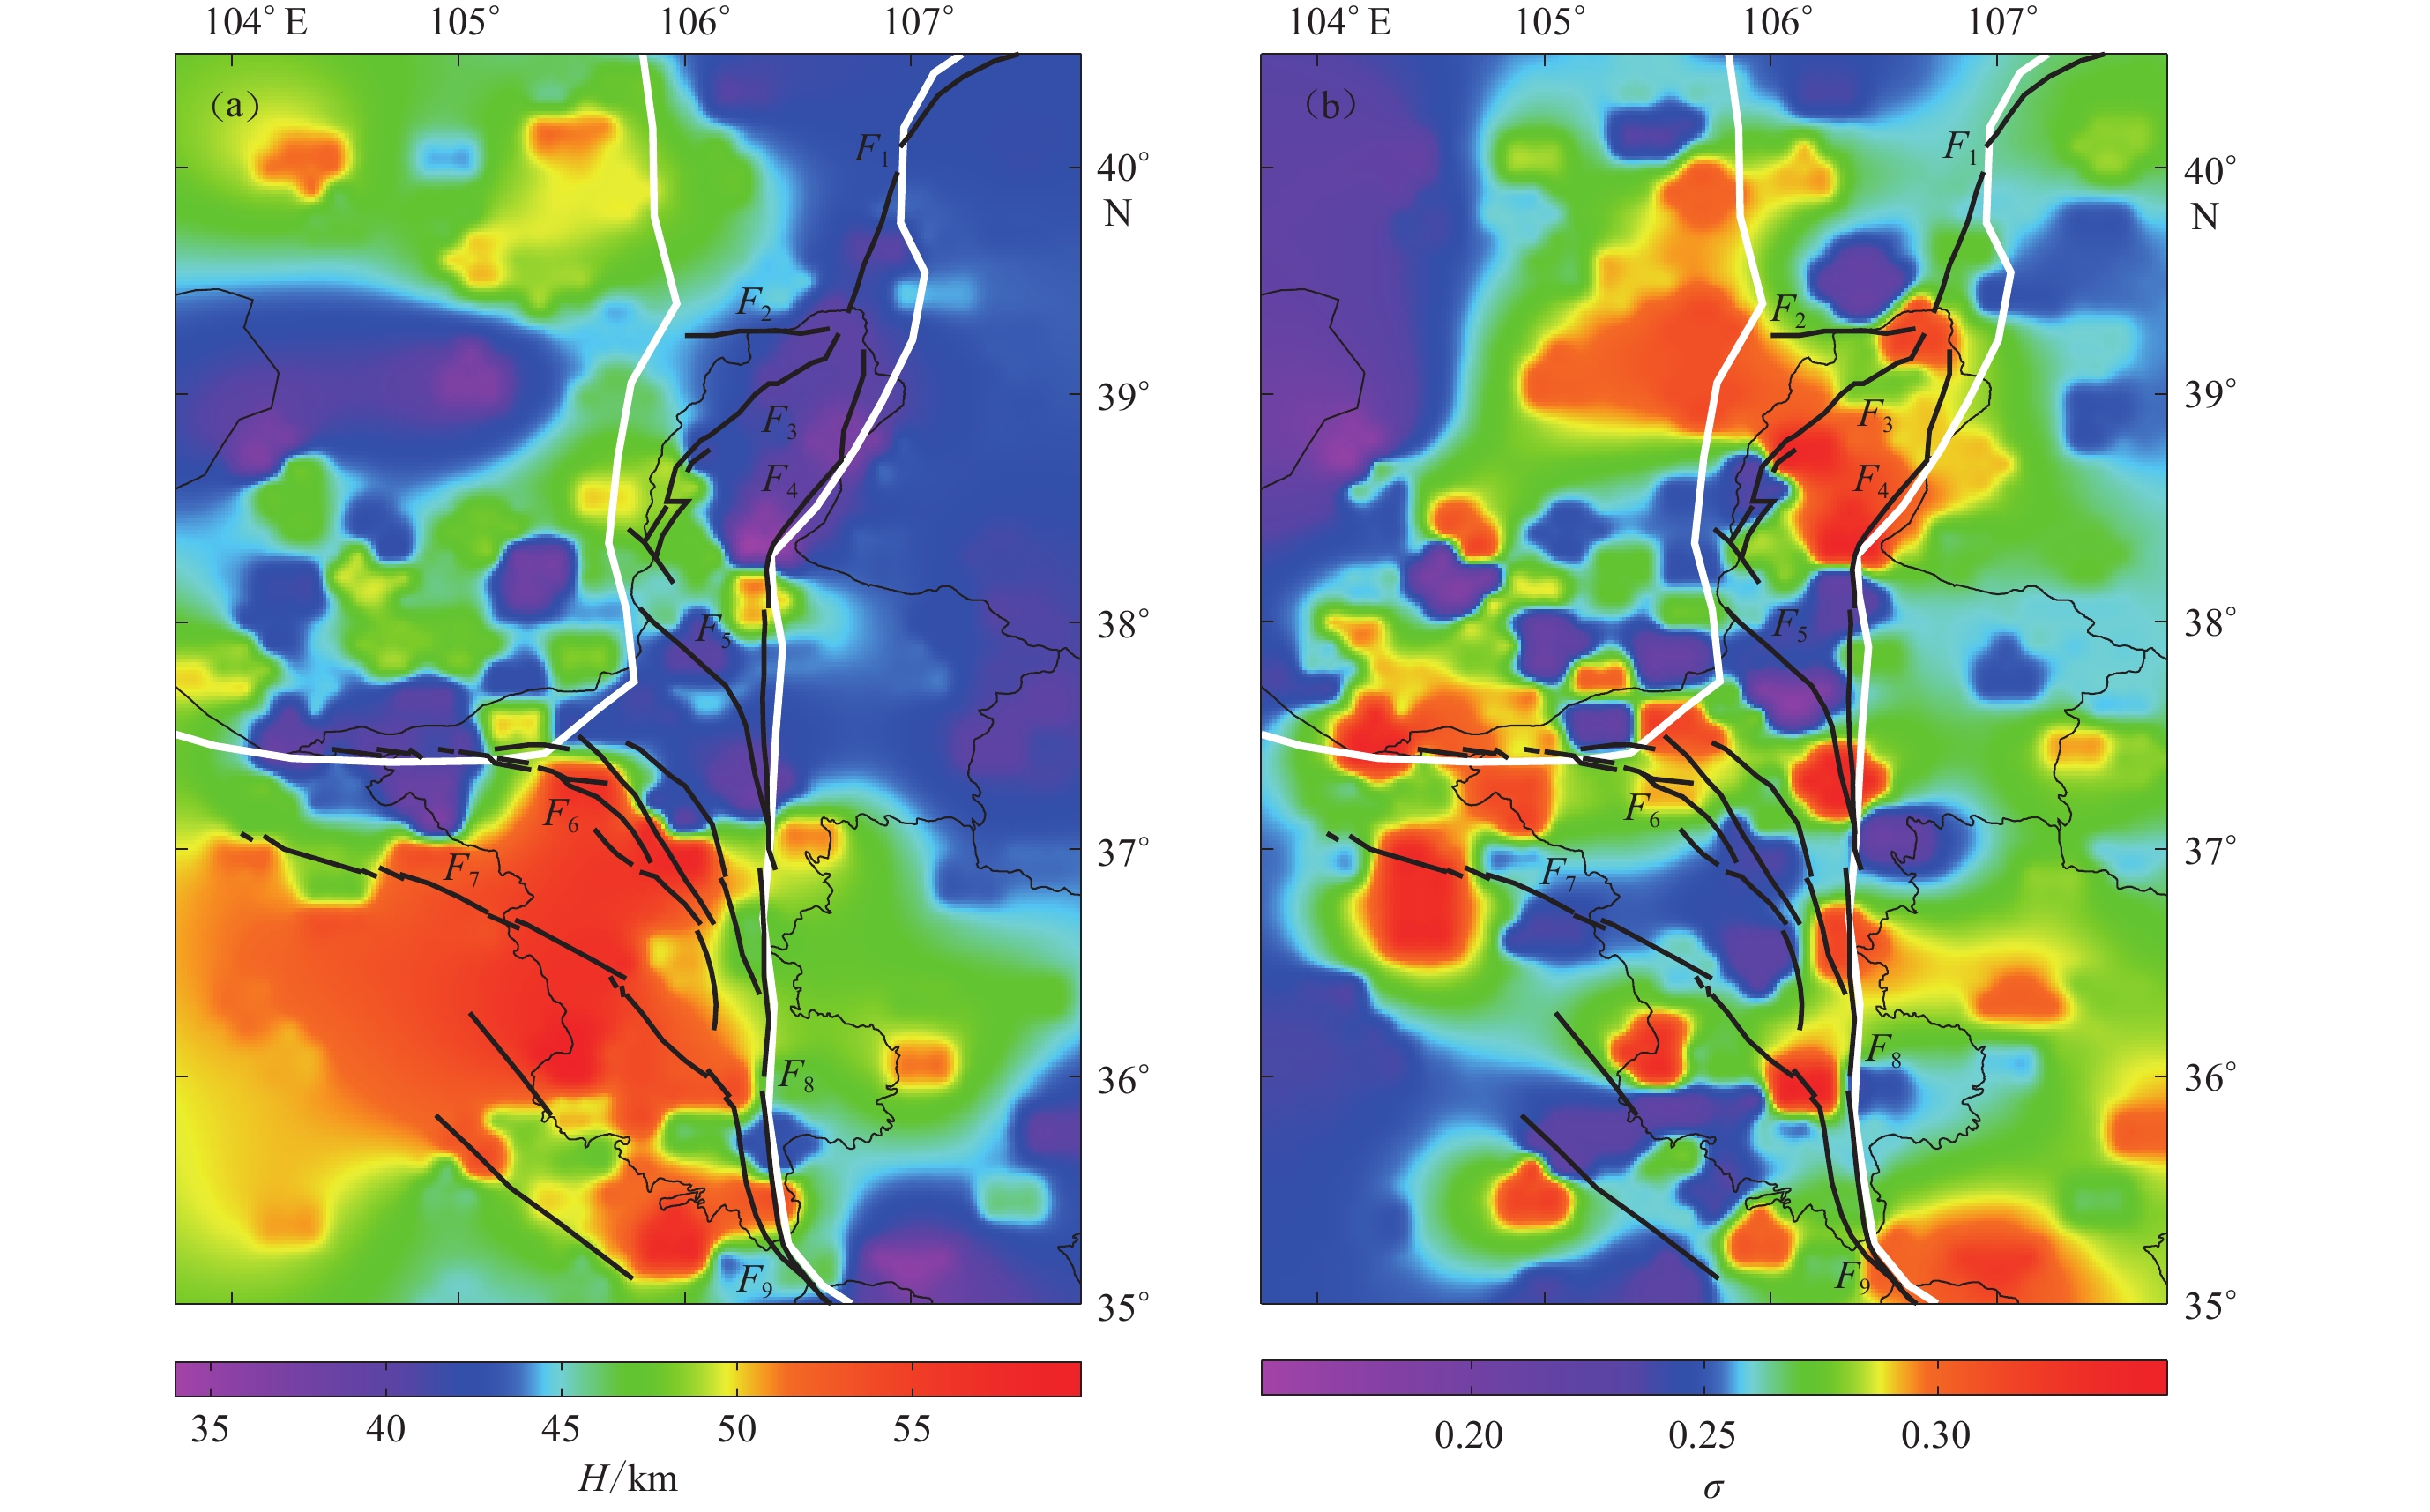
摘要: 收集了鄂尔多斯地块西缘的21个宁夏区域地震台网台站和183个中国地震科学探测台阵台站记录到的2015年1月至2016年1月期间的远震P波资料,通过对其进行反褶积提取接收函数,并利用H-Kappa叠加方法计算了研究区内的莫霍面深度和泊松比。结果表明:研究区的莫霍面深度在36—58 km范围内变化,大体呈南厚北薄、西厚东薄的特点,且具有明显的分区特征,即以香山—天景山断裂为界,莫霍面在南北向呈现明显的起伏变化,该断裂以南的地壳增厚方式可能与青藏高原的水平挤压力所导致的上地壳重叠有关;贺兰山东麓断裂两侧的莫霍面深度落差明显,这可能是由于青藏高原东北缘NE向的挤压力以及阿拉善地块与鄂尔多斯地块之间NW−SE向的拉张力共同作用所致。研究区的泊松比整体较高,其中鄂尔多斯地块的平均泊松比要高于青藏高原东北缘的平均泊松比,银川地堑内的高泊松比现象可能与黄河—灵武断裂为超壳断裂有关;研究区内的莫霍面深度与地表高程具有较好的正相关性,说明其地壳均衡效应较好,而整个研究区内泊松比与莫霍面深度的线性关系并不明显。此外,本研究还进一步揭示了研究区内莫霍面深度与泊松比反相关最明显的两个区域,这种明显的反相关关系也表明,构造上的挤压力或拉张力更容易集中在长英质的弱岩层而使地壳增厚或减薄。综上进一步认为,从海原断裂至香山—天景山断裂这一区域及贺兰山东麓断裂两侧区域下方的地壳成分以长英质岩石为主。Abstract: This paper collects P-waveforms of teleseismic events occurred from January 2015 to January 2016 recorded by 21 Ningxia regional seismic network stations and 183 China-Array seismic stations deployed in western edge of Ordos block, and extracts receiver functions by deconvolution, and then calculates the Moho depth and Poisson’s ratio in the studied area by using H-Kappa stacking method. The results show that the Moho depth ranges 36−58 km, which is presented as thick in the south and west and thin in the north and the east, exhibiting obvious subarea characteristics. Bounded by the Xiangshan-Tianjingshan fault, the Moho depth has a distinct change in the north-south direction, and to the south of the fault the crust-thicken way is probably related to upper crust overlap due to the horizontal extrusion from Tibetan Plateau. On the both sides of Helanshan eastern piedmont fault, the Moho depth varies largely, which may be caused by the joint impact from the extrusion in NE direction from northeastern Tibetan Plateau and the tension in NW-SE direction between Alxa block and Ordos block. In the studied area, the Poisson’s ratios are relatively high in general, and the average of the Poisson’s ratio of Ordos block is higher than that in northeastern Tibetan Plateau. On the other hand, high Poisson’s ratio in Yinchuan graben is possibly related to Huanghe-Lingwu fault as an ultracrustal one. The Moho depth is positively correlated to the surface elevation, suggesting that the crust is in the better state of isostasy, but there is no obvious linear correlation between Poisson’s ratio and Moho depth in the whole studied area. However, further study finds that there are two distinct areas, in which Poisson’s ratio is inversely correlated with the Moho depth, illustrating that the tectonic extrusion or tension is easier to concentrate on the felsic incompetent beds, which leads to the crust thickening or thinning. Consequently, from the inverse relationship between the Poisson’s ratio and Moho depth, it is believed that the crustal composition consists chiefly of felsic rocks beneath the zone from Haiyuan fault to Xiangshan-Tianjingshan fault and on the both sides of Helanshan eastern piedmont fault.
-
Keywords:
- western edge of Ordos block /
- receiver function /
- H-Kappa stacking /
- Moho depth /
- Poisson’s ratio /
- tectonic stress
-
引言
自20世纪90年代起,中国地震局地球物理研究所、中国地震局地质研究所、中国科学院遥感应用研究所和中国矿业大学等单位基于受载岩石破裂过程中的热红外辐射效应实验开展了岩石加载微波辐射观测实验研究. 实验结果表明,受载岩体能够产生特定频段的微波辐射能量增强,其岩体破裂辐射规律具有明显的前兆特征,能够反映岩体的变形破裂过程(邓明德等,1995;耿乃光等,1995;房宗绯等,2000;王恩元等,2011). 同时,日本研究人员也通过岩石单轴压缩破裂实验观测到了300 MHz,2 GHz,22 GHz频段的微波辐射异常(Maki et al,2006 ). 这是继岩石破裂红外辐射异常现象之后,又一新的岩石电磁辐射发现,为地震岩石破裂的微波遥感监测提供了理论依据.
美国地球观测系统(Earth observing system,简写为EOS) Aqua卫星搭载有先进的微波扫描辐射计(the advanced microwave scanning radiometer for the Earth observing system,简写为AMSR-E),可获取双极化12通道(6.925,10.65,18.7,23.8,36.5,89 GHz)的微波辐射亮温数据(王永前等,2011). 近年来,国内外研究人员使用AMSR-E的18.7 GHz微波亮温数据检测到了地震孕育过程中岩石挤压破裂产生的微波能量辐射异常. 例如:Maeda和Takano (2010)使用AMSR-E的18.7 GHz双极化微波辐射数据,在数据重建之后提出一种基于相邻像元亮温差计算异常指数的算法,且此前已使用该算法在2008年汶川MS7.9地震后1天在震中附近检测到异常增强信号(Maeda,Takano,2009);陈昊和金亚秋(2010)在该算法基础上进一步定义了辐射异常指数(radiation anomaly index,简写为RAI)和极化指数,并对2010年4月14日玉树MS7.1地震孕育过程中产生的岩石破裂辐射异常进行初步检测,同时引入23.8 GHz频段数据对地表温度和大气水汽在检测过程的影响进行评估. 上述研究均表明个别震例在震前可能存在微波辐射异常,但这一结论并未得到普遍性检验. 虽可检测到微波辐射异常增强,但并未对异常出现的时间和位置进行统计分析. 鉴于此,本文使用改进后的异常检测方法对俄罗斯堪察加半岛17次MS≥5.0地震进行微波辐射异常识别与统计分析,拟在证实强震前存在微波辐射异常这一普遍现象的基础上,进一步探索并试图总结微波辐射异常时空特征的基本规律.
1. 研究区域概况
堪察加半岛位于俄罗斯的远东地区、欧亚大陆的尽头,西濒鄂霍茨克海,东临太平洋和白令海(图1). 整个半岛面积约为47.23万km2,从东北向西南延伸超过1 200 km. 在地质构造上,堪察加半岛属于新生代阿尔卑斯褶皱带,处于太平洋、欧亚和北美三大板块交汇处,主要受太平洋板块沿NNW方向向鄂霍茨克板块下方的俯冲作用. 板块之间的俯冲和挤压在堪察加地区形成一条典型的板块边界地震带,该地震带基本平行于堪察加半岛的中南部(孟国杰等,2009). 堪察加半岛俯冲地区分为南、北两部分,南部大约位于50°N—55°N,且在55°N与阿留申海沟交汇,俯冲方位角为55°,而北部的俯冲角由55°降为约35° (Gorbatov et al,1997 ;Kozhurin et al,2006 ).
本文选取堪察加半岛为研究区域主要基于两个方面:一方面搭载了AMSR-E扫描仪的Aqua卫星在高纬度地区覆盖度较好,而在低纬度地区数据较少;另一方面,堪察加半岛的地震和火山活动频繁,是理想的统计分析试验区域. 根据USGS (2011)的统计数据,堪察加半岛自2003年1月至2011年9月共发生MS≥5.0地震17次,其中MS≥6.0地震4次(图1).
2. AMSR-E数据与研究方法
2.1 AMSR-E微波数据
AMSR-E是搭载在美国地球观测系统Aqua卫星上的被动微波辐射计,具有6频率双极化探测的特性,过境时间为当地时间13:30和1:30,目的在于提供全球实时的地球物理学和大气参数数据以支持全球气候变化和水汽循环的科学研究和监测工作(Kawanishi et al,2003 ; Shibata et al,2003 ;王永前等,2011). 表1列出了AMSR-E辐射计各类设计参数和运行模式,包括频率、瞬间视场和扫描入射角等. 通过美国国家冰雪数据中心(National Snow and Ice Data Center,2011)对2003年1月至2011年9月约9年的AMSR-E L3级数据进行搜索并下载.Maeda和Takano (2008) 的研究表明,AMSR-E的18.7,23.8 GHz通道均接近于岩石破裂所释放微波能量的22 GHz频段,但是由于23.8 GHz频段处于大气水汽吸收峰,而大气水汽是影响微波亮温的重要因素之一,因此本文选取18.7 GHz频段作为主要检测频段.
表 1 AMSR-E辐射计的主要性能参数Table 1. Main parameters and characteristics of AMSR-E中心频率/GHz 带宽/MHz 动态范围/K 瞬间视场/km 主波束效率 入射角/° 天底偏角/° 扫描间距/km 扫描方式 6.925 350 2.7—340 43×75 95.1% 55.0 47.5 10.1×9.0 以40 r/min的
速度呈圆锥
形扫描10.650 100 2.7—340 29×51 94.8% 55.0 47.5 10.1×9.0 18.70 200 2.7—340 16×27 95.8% 55.0 47.5 10.1×9.0 23.80 400 2.7—340 18×32 94.8% 55.0 47.5 10.1×9.0 36.50 1 000 2.7—340 8.2×14 93.9% 55.0 47.5 10.1×9.0 89.00(A) 3 000 2.7—340 3.7×6.5 94.5% 55.0 47.5 10.1×9.0 89.00(B) 3 000 2.7—340 3.5×5.9 93.7% 54.5 47.0 4.5×4.4 2.2 异常识别方法
Maeda和Takano (2009)等在证实了岩石破裂可产生微波辐射的基础上,对AMSR-E数据进行重建和重采样,并提出了一种基于相邻点微波亮温差异的异常分析方法(Maeda,Takano,2010),该方法在摩洛哥和汶川等地震实例的应用中取得了较好的异常分析结果. 本文在该方法的基础上对其进行改进,并利用统计学中的四分位数法构建了适用于堪察加半岛地区的背景场.
空间自相关性,即同一变量的不同观测值之间因观测点在空间上相邻而形成的相关性,在影像上表现为相邻像素的微波亮温值之间存在局部空间自相关性. 基于该原理,本文对日本研究人员相邻两点间微波亮温差异的异常分析方法进行改进,参考遥感锐化中的拉普拉斯算子,将相邻两像素点之间的比较改进为将像元F与周围4个像元P进行综合比较,以便更加有效地提取由于地震岩石破裂所释放的微波辐射增强.
在对数据进行去除背景、辐射校正和数据频段选取等处理后,针对每次地震,选取以震中像元F为中心的5×5像元矩阵为研究区域,并对25个像元进行1—25编码,13号点则表示震中(图2),然后以震前60天震后10天为研究时段,对2003—2011年统计得到的震例逐次进行分析.
This page contains the following errors:
error on line 1 at column 1: Start tag expected, '<' not foundBelow is a rendering of the page up to the first error.
$\Delta T_{ B18V(18H)} = T_{{{B}}F} - \frac{1}{4}\left( {T_{{BU}}{{ + }}T_{{BD}}{{ + }}T_{{BL}}{{ + }}T_{{BR}}} \right){\text{,}}$


(1) 式中:TB为微波亮温值;下标U,D,L,R分别为目标点上、下、左、右4个像元点.
辐射检测S指数的计算公式为
${S\!_f} = \left\{\!\!\!\!\!\! {\begin{array}{*{20}{c}}{\sqrt {\Delta T_{{ B}f{ V}}^2 + \Delta T_{{ B}f{ H}}^2} }\, ,\\\!\!\!\!\!\!\!\!\!\!\!\!\!\!\!\!\!\!\!\!\!\!\!\!\!\!\!\!\!\!\!\!\!\!\!\!\!\!\!\! {0, }\end{array}\begin{array}{*{20}{c}}{\quad\quad \Delta T_{{ B}f{ V}} > 0,\;\;\Delta T_{{ B}f{ H}} > 0} \\\!\!\!\!\!\!\!\!\!\!\!\!\!\!\!\!\!\!\!\!\!\!\!\!\!\!\!\!\!\!\!\!\!\!\!\!\!\!\!\!\!{\text{其它}}, \end{array}} \right.$


(2) This page contains the following errors:
error on line 1 at column 1: Start tag expected, '<' not foundBelow is a rendering of the page up to the first error.
统计学上,一组数据由小到大重新排列之后,将其均分为4等份,其3个分割点上的数值即为四分位数,依次分别为下四分位数Q1、中位数M和上四分位数Q2,通过这3个四分位数进一步计算得到四分位距IQR
${ IQR} = {Q_2} - {Q_1}$


(3) 和上下边界. 通过计算这些统计量,生成一个箱体(图3),箱体内包含大部分正常数据,而箱体上下边界之外的数据则被认为是异常数据.
在得到上一步计算的S指数的时间序列之后,为了提取S指数的异常变化,利用四分位法构建了辐射检测S指数的背景场,具体过程为以目标地震年以外的其它年份同时间同目标点像元的S指数构成数组,利用四分位数法,分别计算该数组的下四分位数Q1、中位数M、上四分位数Q2和四分位距IQR. 由于所检测的微波异常属于正异常,因此结合实际情况只计算S指数的上限L1,即
${L_1} = M + 1.5{ IQR}.$


(4) 最后根据逐像元计算得到的S指数和构建的背景场对研究区域各像元的S指数时间序列分布进行筛选,最终对微波异常的位置和时间进行判定.
3. 结果分析
3.1 亮温月均值变化及空间分布
理解堪察加半岛微波亮温的月变化规律及其空间分布特征可以为震前异常识别提供基础认知. 选取2003—2011年频率为18.7 GHz的微波亮温数据,对堪察加半岛的月均值进行统计. 图4给出了堪察加半岛平均微波亮温的月变化曲线,可以看出,其大体可分为两个阶段:1—4月和11—12月为平稳期,微波亮温均值稳定地维持在较低水平,即250 K以下;4—10月为剧变期,其中4—7月急剧增温,8—10月急剧降温,微波亮温均值曲线呈抛物线型,随着夏秋季节地表温度的变化,微波亮温均值在7月和8月达到最大,约为263 K.
图5给出了堪察加半岛不同地形微波亮温的差异,从图中可以看出,中部的堪察加河和谷地以及西部的平原地区微波亮温较低,而火山与地震频发的南部和东南部区域微波亮温较高.
3.2 火山点、地震点与非震点亮温对比
由于火山和地震带均位于堪察加半岛的东南区域,因此对地震微波异常进行识别分析时,火山的辐射是不可忽视的. 根据美国国家海洋气象局(National Oceanic and Atmospheric Administration,2011)中的全球火山监测数据对2003—2011年间勘察加半岛的火山进行统计,结果列于表2. 堪察加半岛共有7座火山在上述时间范围内存在活动迹象,火山类型大部分为成层火山,网站记录的活动次数最高达到16次.
表 2 2003—2011年堪察加半岛剧烈活动火山统计Table 2. The statistics of active volcanoes in Kamchatka Peninsula from 2003 to 2011火山名称 东经/° 北纬/° 海拔/m 火山类型 上次显著喷发时间 活动次数 Koryaksky 158.7 53.3 3 430 成层火山 2009-09 4 Karymsky 159.4 54.0 1 513 成层火山 2009-08 13 Bezymianny 160.6 56.0 2 882 成层火山 2009-11 12 Gorely 158.0 52.6 1 799 破火山口 2010-07 1 Kizimen 160.3 55.1 2 334 成层火山 2011-10 3 Klyuchevskoy 160.6 56.1 4 754 成层火山 2010-06 9 Sheveluch 161.4 56.7 3 283 成层火山 2011-04 16 结合收集的AMSR-E微波亮温数据和表2所列7座火山在2003—2011年间的具体活动,筛选出Koryaksky,Karymsky,Bezymianny,Klyu-chevskoy,Sheveluch这5座火山作为研究对象,用V1—V5进行标记. 选取与上述5座火山地理位置最近的地震点作为参考对象,分别对应于2009年12月12日、2008年3月1日、2004年6月10日、2009年4月23日和2010年5月2日这5次地震的震中像元,用S1—S5表示. 非震点依据微波亮温月均值的空间分布差异选取(图5),即中部山脉亮温相差较大,东西两侧的亮温较为接近. 考虑到半岛亮温以中部山脉为界呈两侧对称,选择与地震点同纬度、与中部山脉大致对称的像元点作为非震点,用N1—N5表示. 图6给出了具体火山点、地震点和非震点的选取位置.
图7所示为火山点、地震点及非震点2003—2011年亮温平均值的逐日变化. 最初猜想,火山点和地震点的亮温均应大于非震点. 但研究结果显示,火山点亮温均小于地震点和非震点,地震点与非震点的微波亮温相互交错. 此结果虽然与猜想不同,但其实更符合半岛地表的实际情况. 虽然研究期间火山活动较为频繁,但活跃程度并不高,除相对较大的火山喷发以外,其它火山因常年被积雪覆盖且海拔较高,所以平均温度较低. 通过地震点和非震点的亮温比较可以发现,4—8月,地震点的亮温略大于非震点,与这些月份地震活动更频繁有关.
3.3 震前微波异常识别与统计
利用2.2节所述的统计方法,对堪察加半岛2003—2011年17次中强地震进行统计分析,针对每次震例,选取特定研究区域和研究时段,计算研究区域内各像元的S指数值并构建非地震年份S指数的背景场,识别微波异常的时空特征. 本文以4次MS≥6.0地震为例说明异常识别与统计分析过程,其中L1和M分别为由非震年份同期同位置计算的S指数构成的数组按四分位法计算得到的上限和中位数.
图8为2003年6月16日MS6.9地震经异常提取后得到的点位时序分布图,可以看出,9号点在5月18日、5月25日、6月3日和6月10日,21号点在5月18日和6月19日(震后3天),辐射检测S指数均显著增长且均大于设定背景场的阈值上限L1,表现为不同程度的异常变化,其中9号点的S指数在6月10日变化最为明显.
图9为2004年6月10日MS6.9地震经异常提取后得到的点位时序分布图,可见9号点在5月25日和5月27日异常表现相对较弱. 与2003年6月16日MS6.9地震的对比显示,这两次地震的震中位置为同一个像元,即两次地震的研究区域是一致的,故认为2004年6月10日地震的检测结果可能受到2003年6月16日MS6.9地震的影响,9点号在6月8日和21号点在6月5日S指数的突变增长同样可判定为强异常变化. 对比相似的异常检测结果,推测这两次地震的孕震机理是相同的.
图10为2006年5月22日MS6.2地震经异常提取后得到的点位时序分布图,其中1号点5月1日的S指数异常增高并达到整个时间序列的最大值;5号点在4月24日、5月4日和5月10日表现为弱异常; 11号点和12号点的S指数也在某些时刻出现峰值,但数值较低,判断为可能的弱异常.
图11为2007年5月30日MS6.4地震经异常提取后得到的点位时序分布图,从S指数时间序列和背景场的统计分析可以看出,3号点在4月29日,9号点在5月21日和5月31日(震后1天)检测到S指数的异常变化.
对所有17次地震中探测到S指数的地震进行统计,结果列于表3. 17次地震中有13次地震在震前1个月内均检测到不同程度的微波异常,4次地震未检测到异常,MS≥6.0地震均检测到异常,MS5.0—6.0地震中有9次检测到S指数异常,4次未发现. 分析4次未检测到异常的地震案例,认为可能的原因为:① 地震震中虽在陆地但却靠近海岸,使得研究区域内的数据完整性不足或有效值不够;② 部分地震如2003年2月6日MS5.0地震的研究区域或研究时间无法满足预先的设定,用较小的研究区域和时间进行替代而无法检测到异常.
表 3 17次地震S指数的检测结果Table 3. S index detection results of the seventeen earthquakes发震时刻 MS 检测异常点编号 异常出现的时间/d 年-月-日 震前 震后 2003-02-06 5.0 无 无 无 2003-06-16 6.9 9,21 4,13,22,29 3 2004-06-10 6.9 9,21 2,5,14,16 无 2005-06-12 5.0 2,3 11,30 无 2006-05-22 6.2 1,5,11,12 3,12,20,21,24 无 2006-08-17 5.7 11,12 10,25 无 2007-05-30 6.4 3,9 1,9 2 2007-11-25 5.2 1,2,4 15,20,23 无 2008-03-01 5.4 无 无 无 2009-04-23 5.2 2,18,19 3,12,14,30 2 2009-06-06 5.2 无 无 无 2009-11-27 5.0 3,18 1 4 2009-12-12 5.1 7,16 16 无 2010-05-02 5.4 无 无 无 2010-10-19 5.0 1,6,22 3,16,23 无 2010-11-27 5.1 5,21 6,7,8,10 无 2010-12-15 5.0 5,17,18 4,14,16,21 无 4. 讨论与结论
在发现卫星遥感可探测到震前微波辐射异常这一现象之后,研究人员多倾向于选择致灾影响较大的单一震例进行分析,而缺少针对典型地震区域的岩石破裂微波辐射异常普遍性检验与统计特征研究. 本文通过对堪察加半岛地震的统计分析,揭示了半岛全年微波亮温具有明显的季节特征及空间差异性的特点,同时对火山点的微波辐射影响进行了评估. 利用改进后的异常识别方法与背景场的构建对2003—2011年共17次中强地震的震前短临异常的位置和时间信息进行统计,发现17次地震中有13次可以识别出震前异常,MS≥6.0地震均可检测到这些异常,且异常大多发生在地震前1个月内. 这一统计分析充分验证了震前微波辐射异常这一现象的普遍性.
本文的研究仍有很多不足,一方面在于新的统计研究方法虽能够有效地消除地形地貌及气候因素的影响,但对土壤湿度和大气水汽等参数的影响无法剔除;另一方面,所提取的震前短临异常的位置和时间信息中,缺少堪察加半岛的地形构造和地震破裂带等相关资料,因此统计结果需要其它数据的佐证. 本文对于地震前卫星遥感微波辐射异常的统计分析还处于基础阶段,对于堪察加半岛地震频发的特点,认为相邻地震的微波异常之间可能存在相关性,对异常信息之间的相关性进行统计分析可能是未来研究的重点,研究结果亦有助于更好地理解微波异常产生的机制.
-
图 1 研究区地质构造及公元876年—2017年MS≥5.0地震分布
F1:桌子山断裂;F2:正谊关断裂;F3:贺兰山东麓断裂;F4:黄河—灵武断裂;F5:牛首山断裂;F6:香山—天景山断裂;F7:海原断裂;F8:云雾山断裂;F9:六盘山断裂,下同
Figure 1. The geological structure and distribution of MS≥5.0 earthquakes from AD 876 to 2017 in the studied area
F1:Zhuozishan fault;F2:Zhengyiguan fault;F3:Helanshan eastern piedmont fault;F4:Huanghe-Lingwu fault;F5:Niushoushan fault;F6:Xiangshan-Tianjingshan fault;F7:Haiyuan fault;F8:Yunwushan fault;F9:Liupanshan fault,the same below
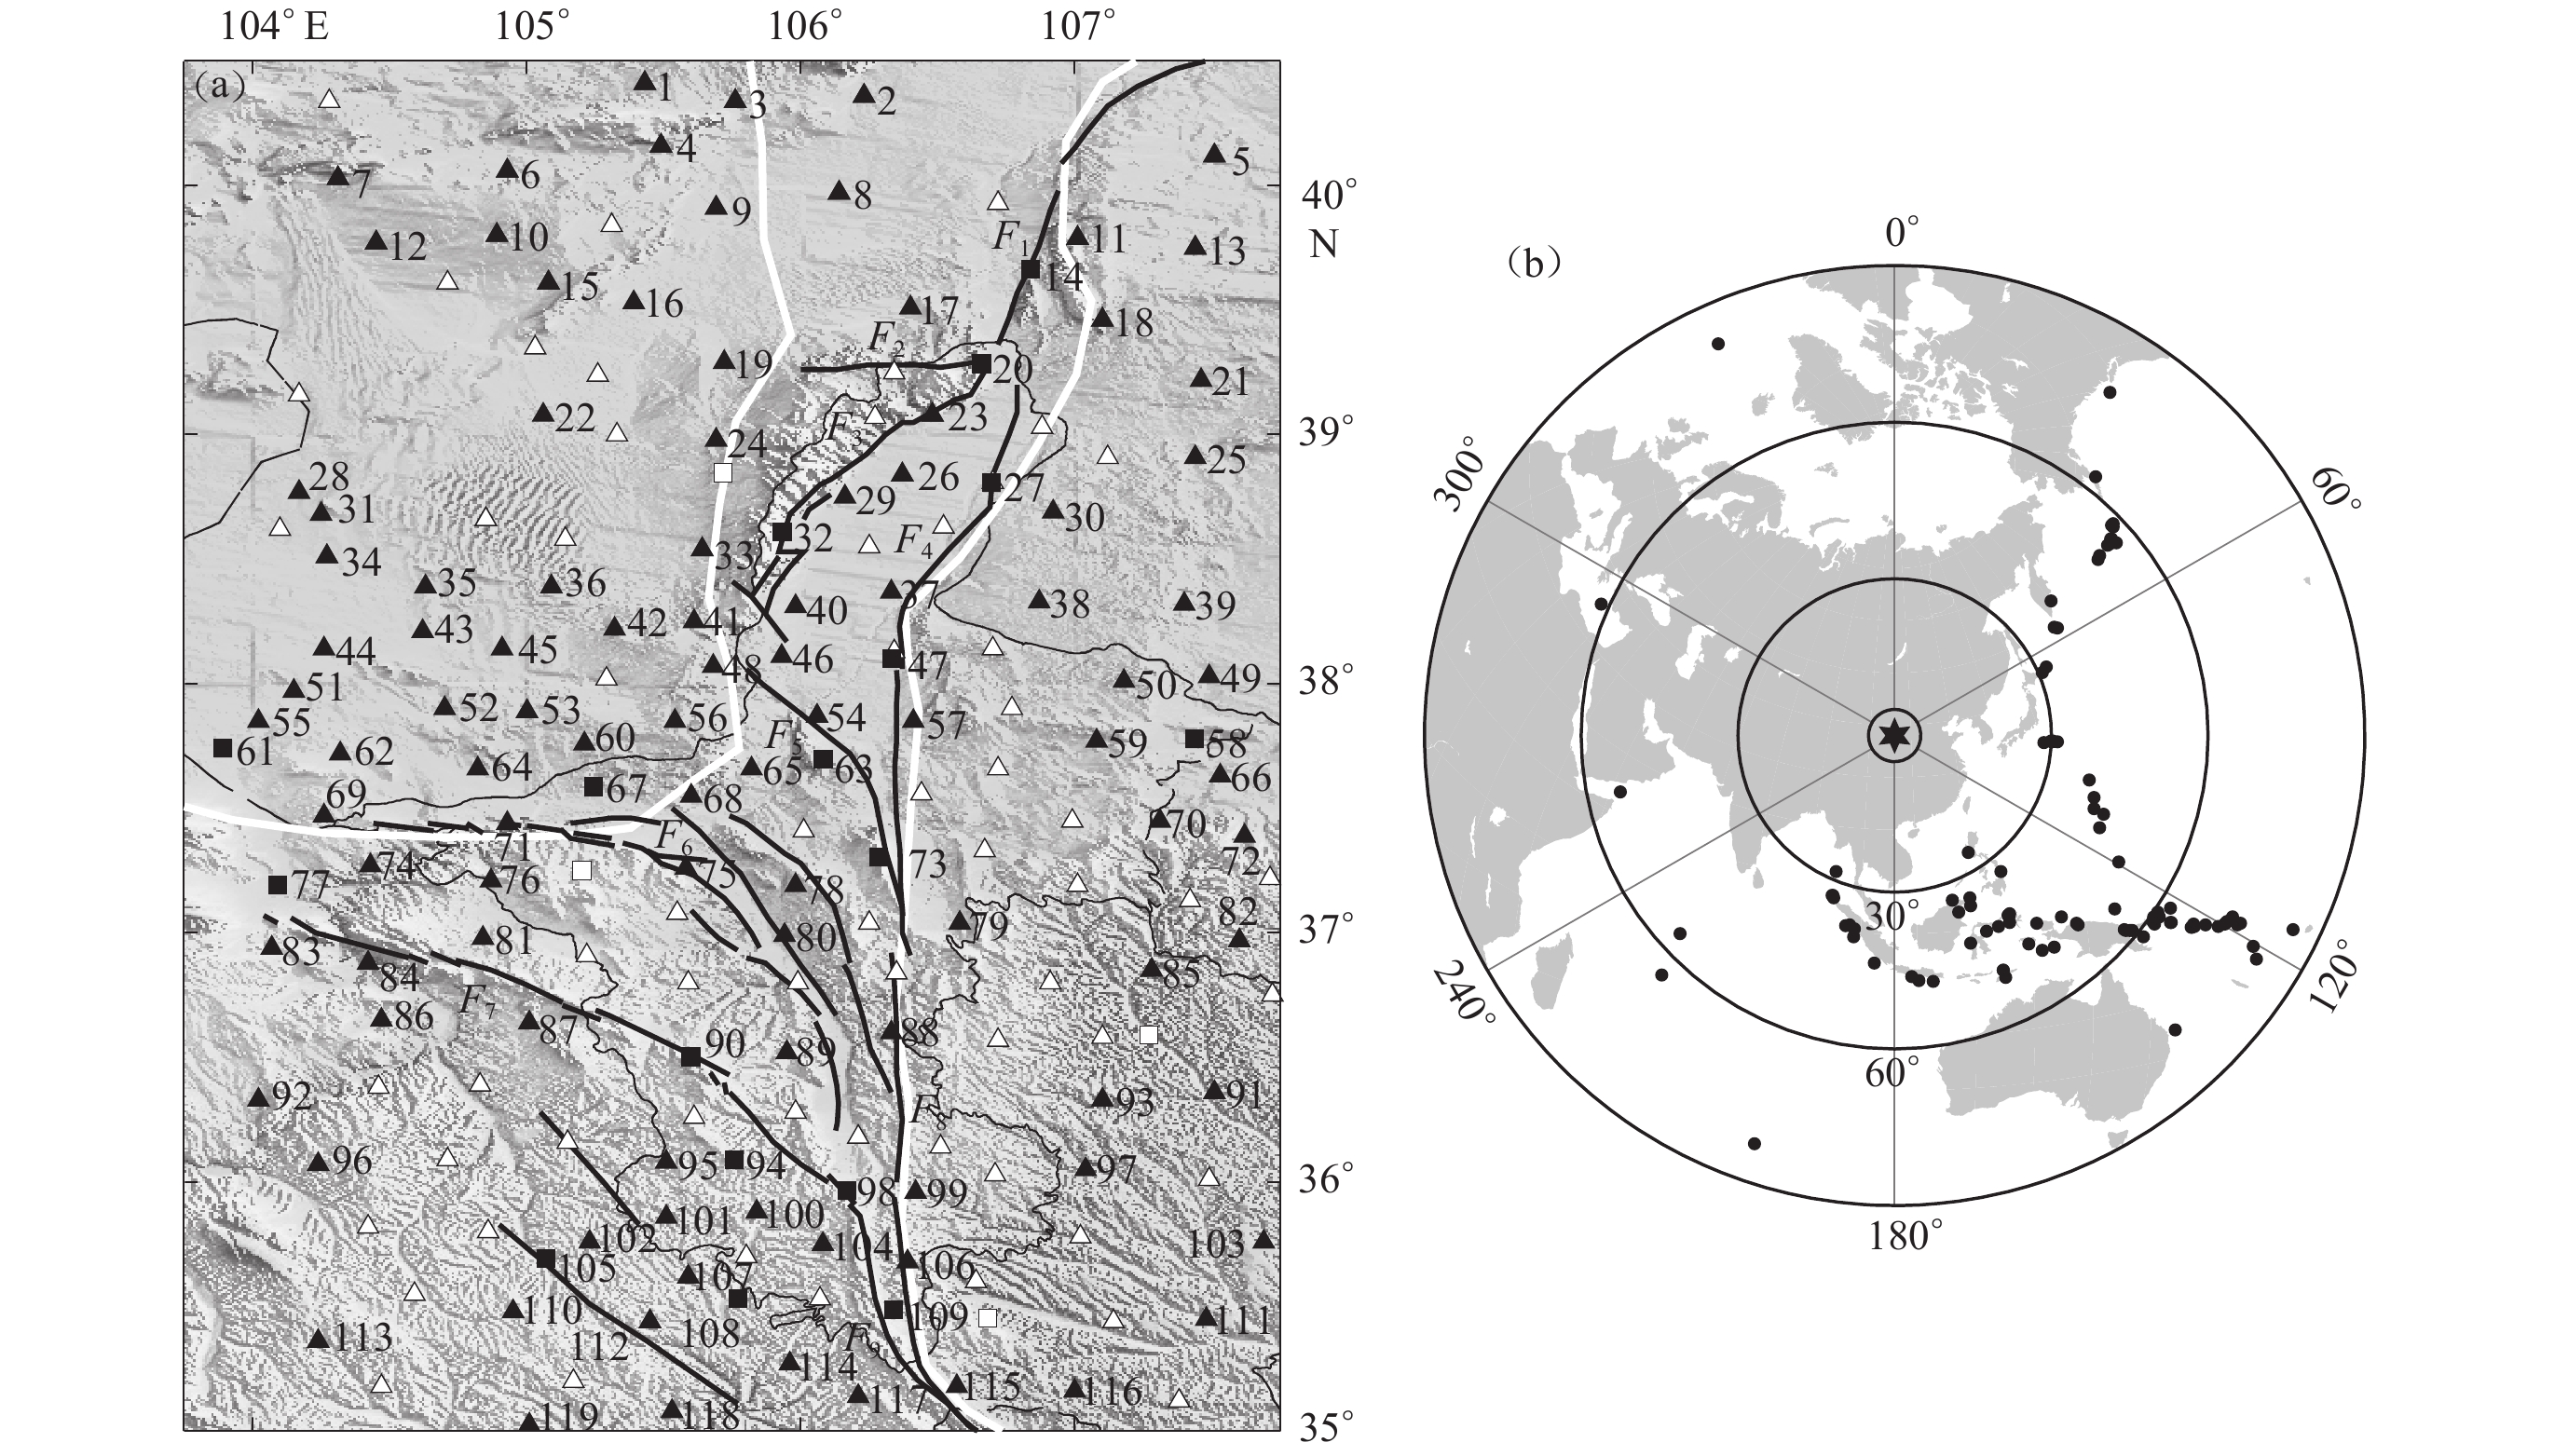
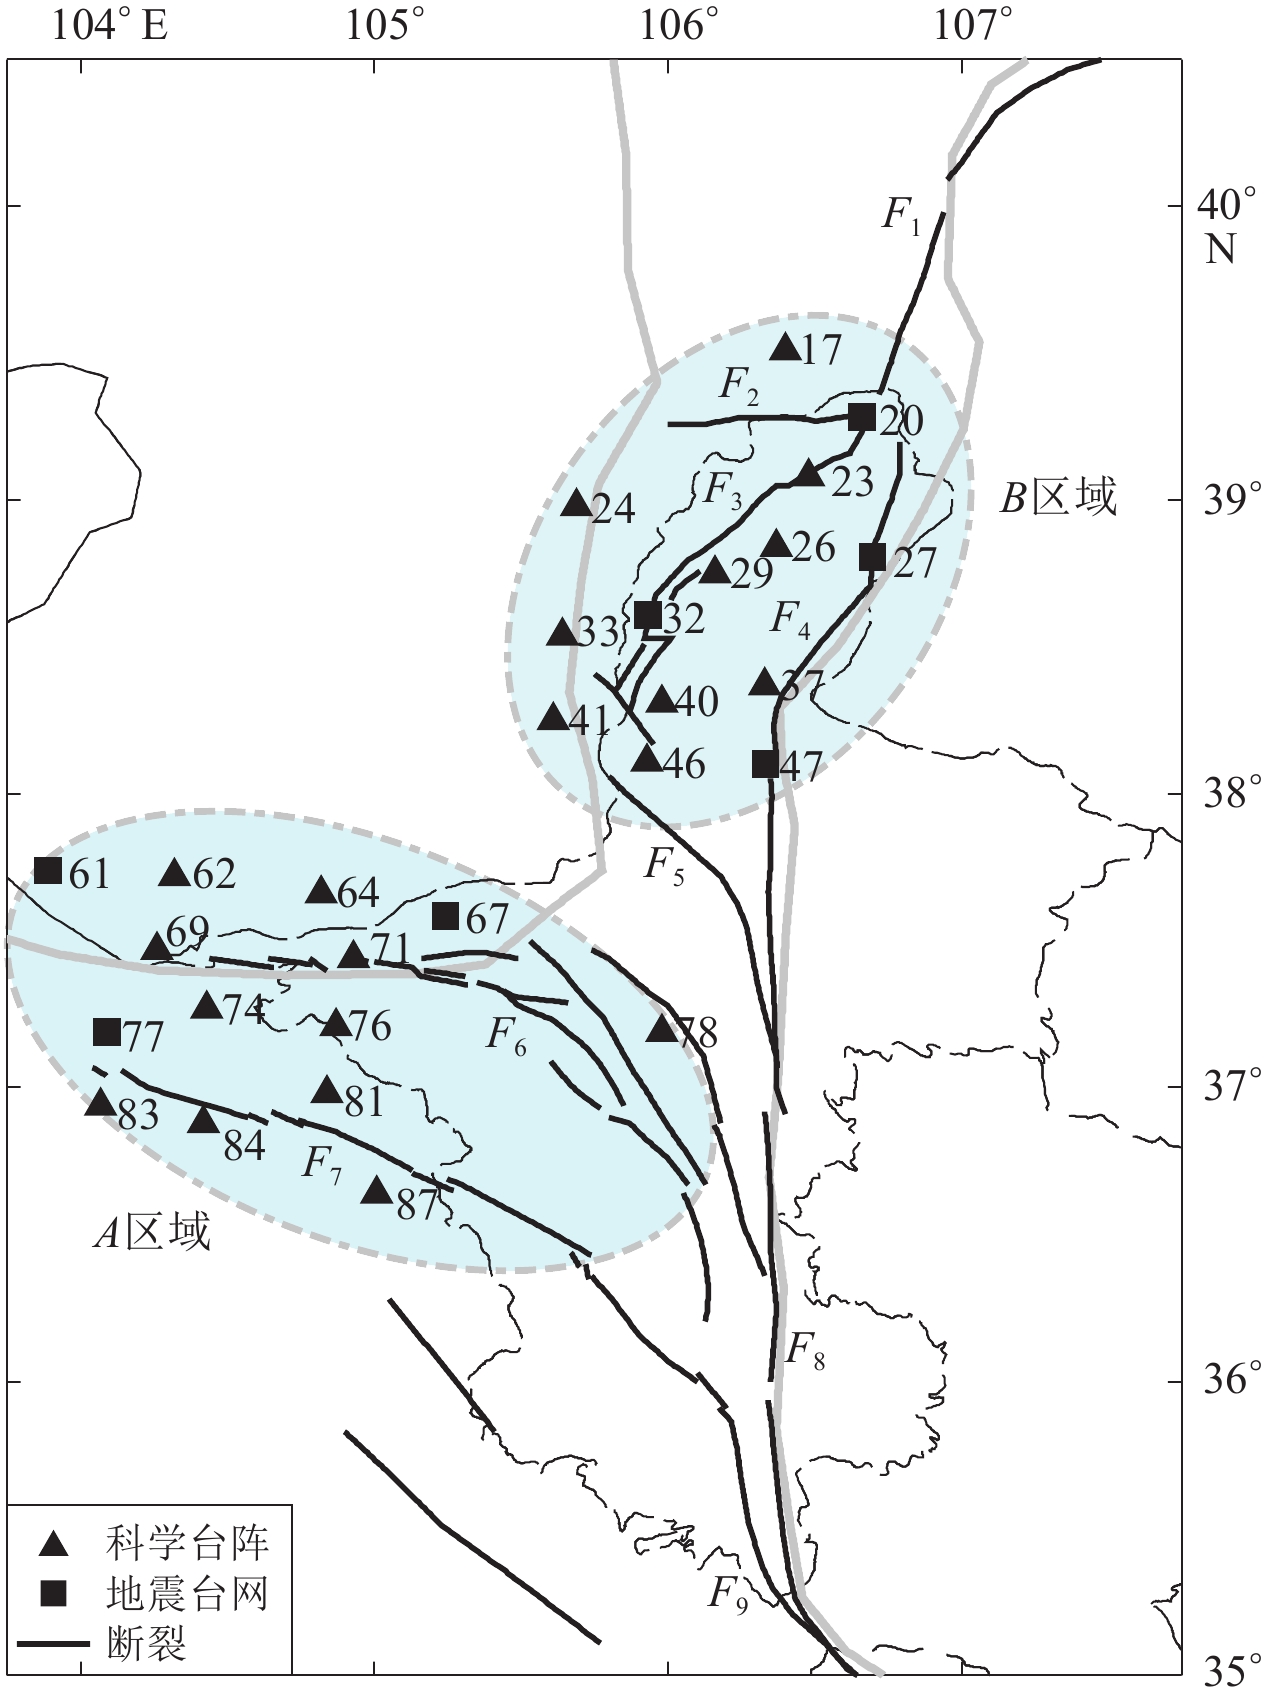
图 2 本文所使用台站(a)和远震事件(b)分布
三角形代表科学台阵,方块代表宁夏区域地震台网;实心三角形和方块代表有H-Kappa结果的台站,而空心三角形和方框代表无H-Kappa结果的台站。将有H-Kappa结果的台站按纬度从高到低进行编号,其对应台站的代码详见表1
Figure 2. The distribution of stations (a) and tele-seismic epicenters (b) used in this study
The triangles represent the China Array,the squares represent Ningxia regional seismic network,the black triangles and squares all indicate the stations with results by H-Kappa stacking method,and the white triangles and squares all indicate the stations without such results. The stations with H-Kappa results are numbered in consecutive order from high latitude to low,and the corresponding station original codes are listed in Table 1
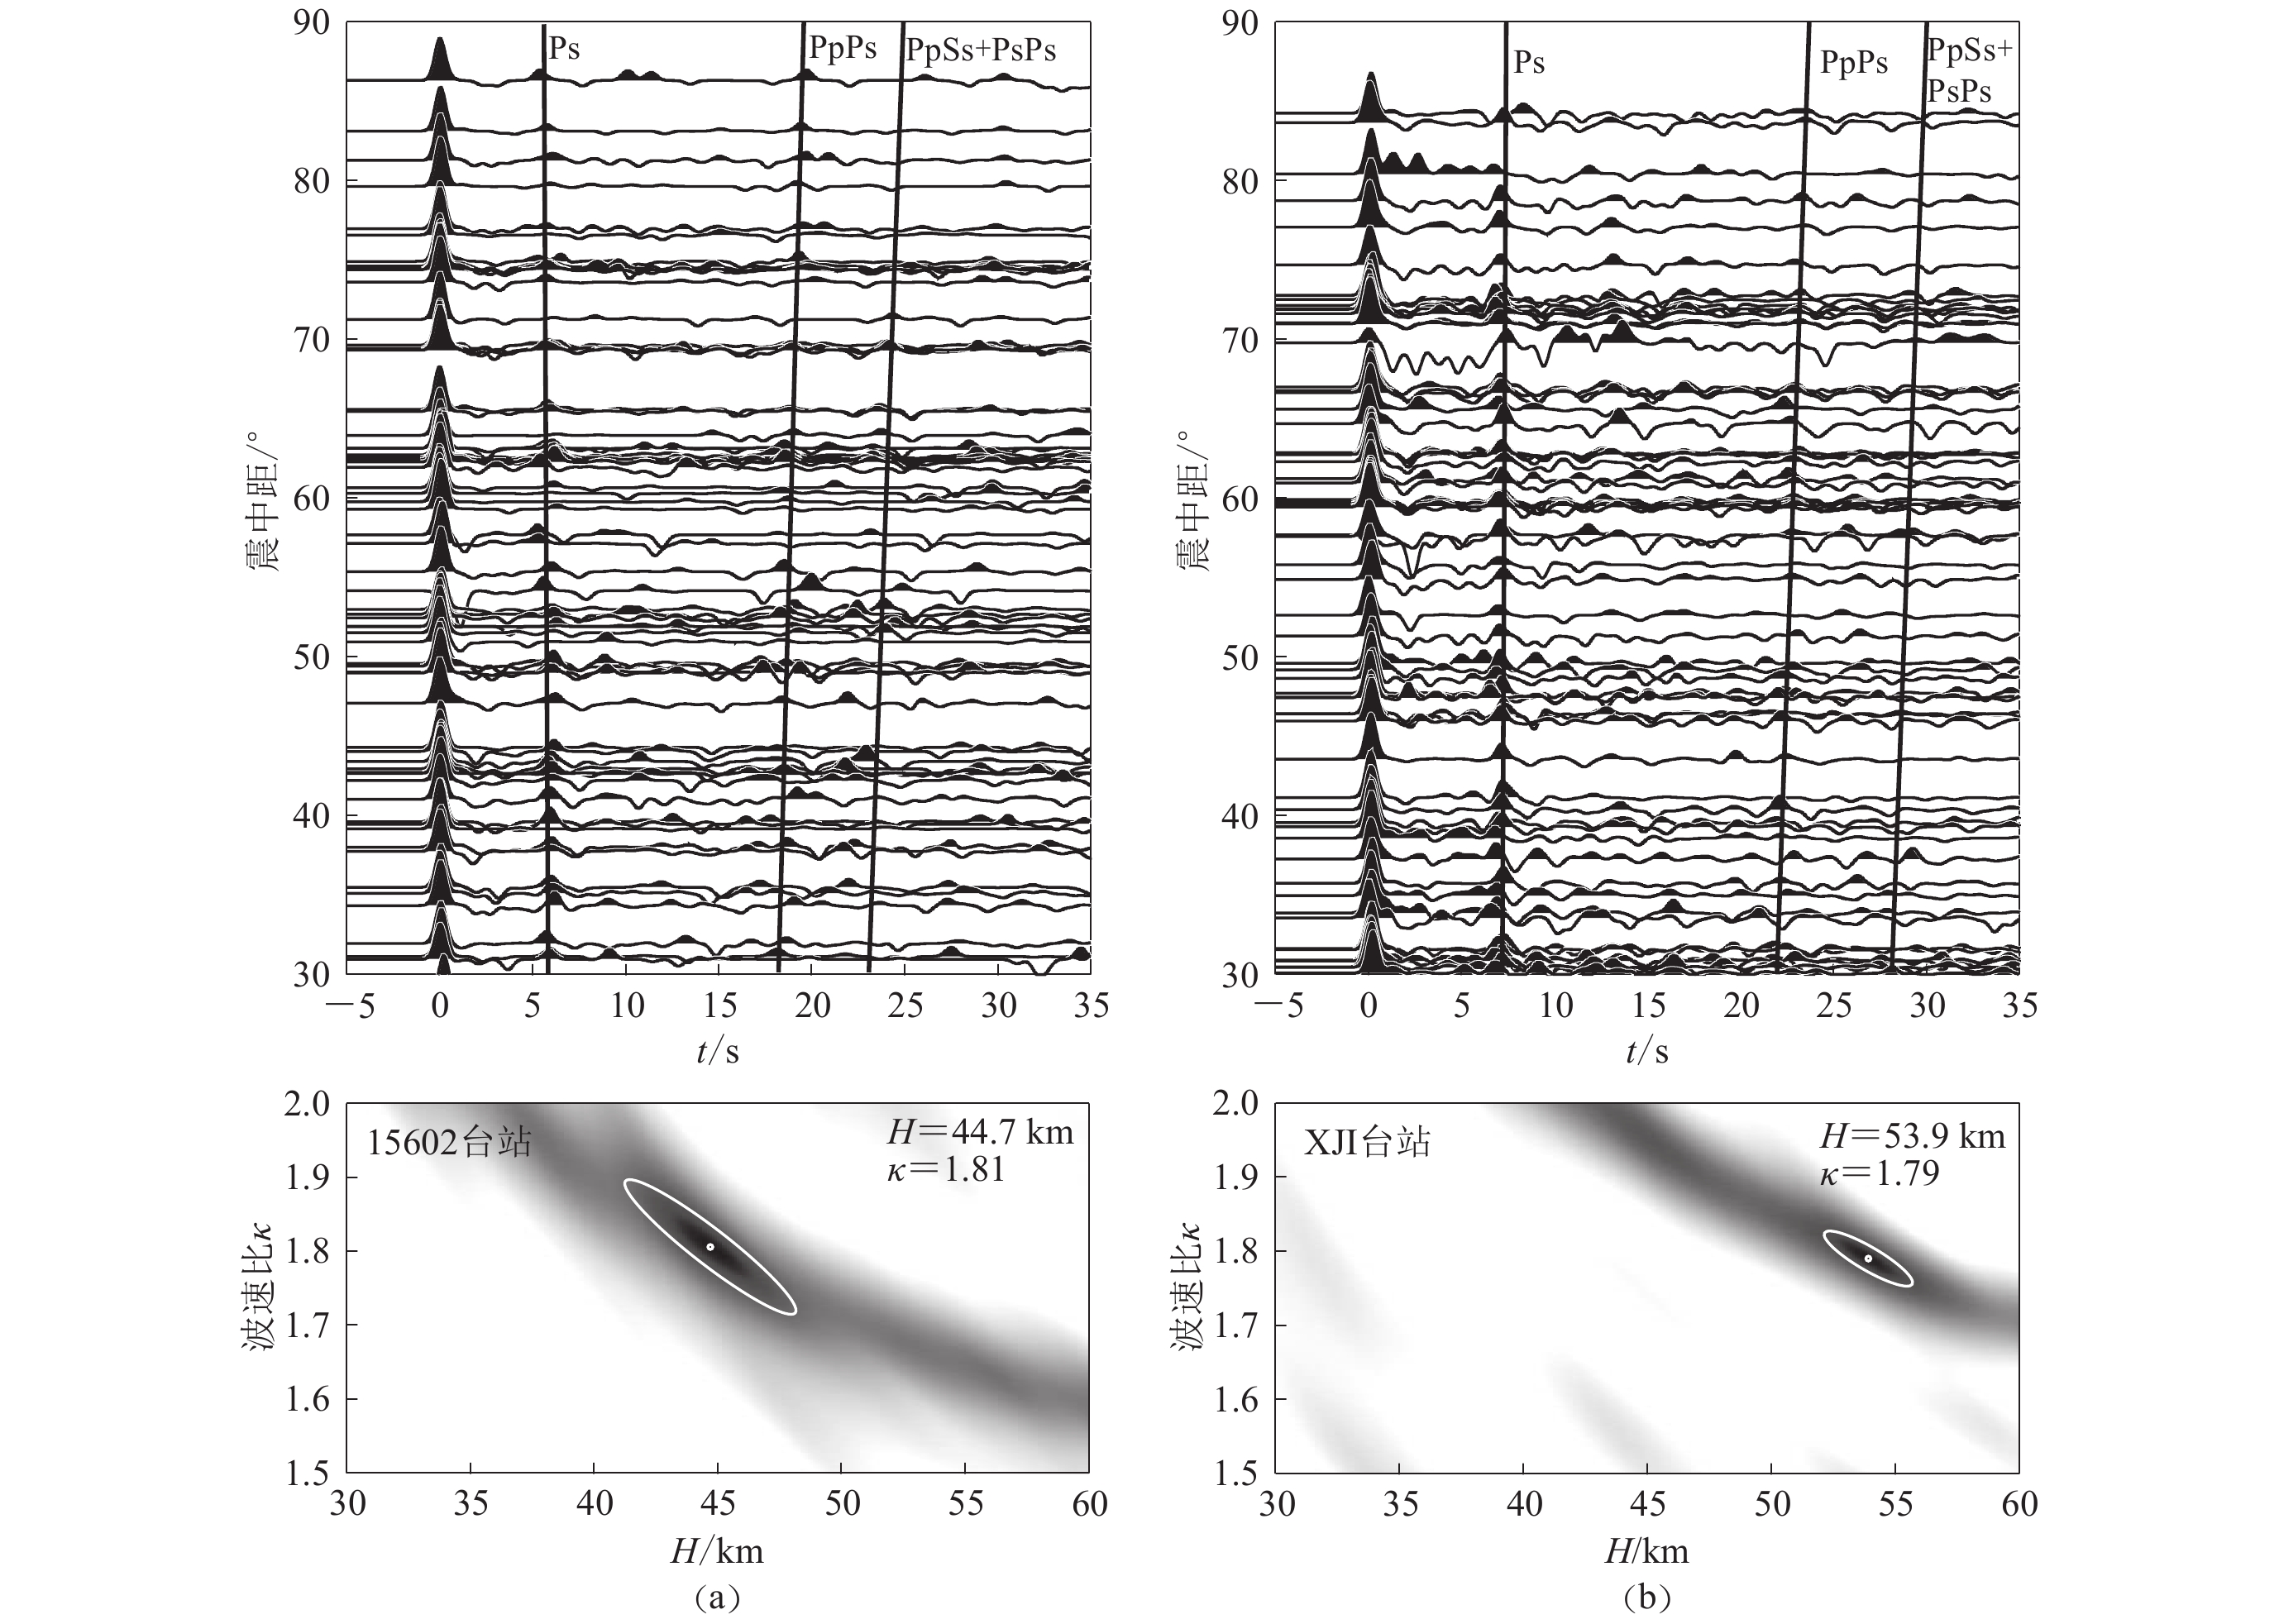
图 3 中国科学台阵(a)和宁夏区域地震台网(b)台站的接收函数及其H-Kappa结果
竖黑线为最优莫霍面深度和波速比所对应的Ps波,PpPs波及PpSs+PsPs波的震相到时
Figure 3. Receiver functions of the two stations from China Array (a) and Ningxia regional seismic network (b) and their H-Kappa results for example
The vertical black lines are the arrival times of Ps,PpPs and PpSs+PsPs phases corresponding to the optimum Moho depth and velocity ratio
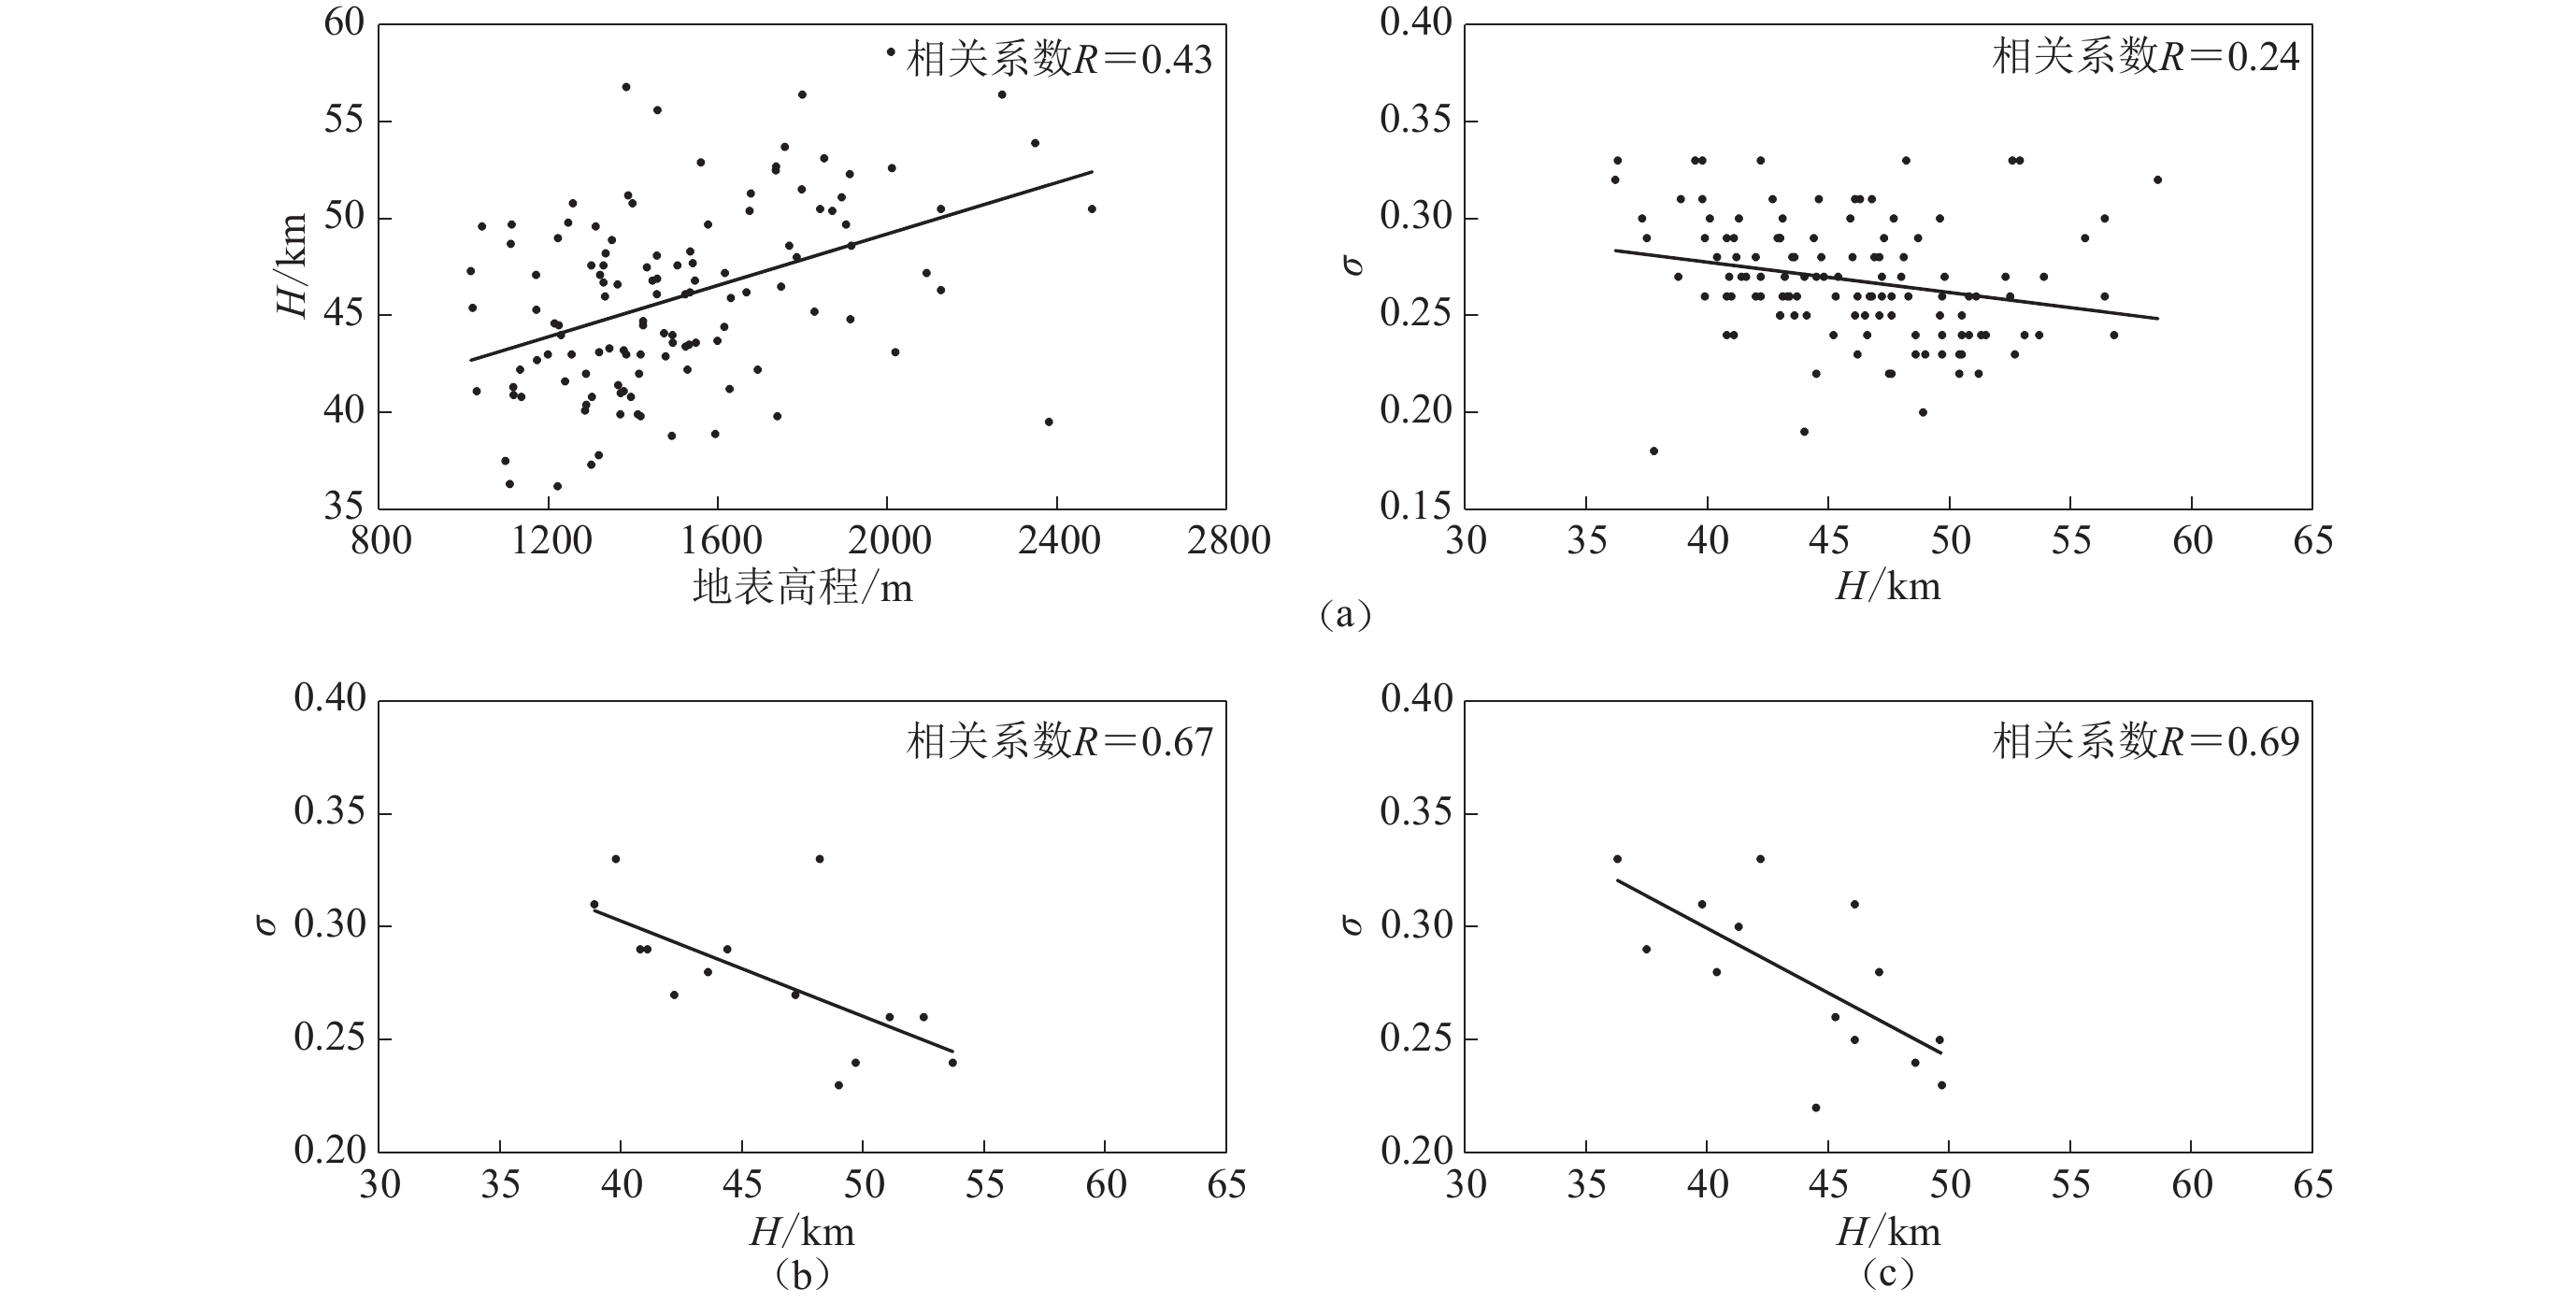
图 5 莫霍面深度与地表高程、泊松比的关系(黑色直线为线性回归线)
(a) 整个研究区;(b) 海原断裂与香山—天景山断裂之间区域;(c) 贺兰山东麓断裂两侧区域
Figure 5. The relationship between Moho depth and surface elevation or Poisson’s ratio (Black line represents the linear regression line)
(a) The whole studied area;(b) The area between Haiyuan fault and Xiangshan-Tianjingshan fault;(c) Both sides of the Helanshan eastern piedmont fault
表 1 鄂尔多斯地块西缘各台站下方的地壳结构参数
Table 1 The parameters of crustal structure beneath stations in the western edge of Ordos block
编号 台名 H/km κ σ N 编号 台名 H/km κ σ N 1 15590 46.2±1.5 1.75±0.03 0.26 64 47 LWU 49.7±1.3 1.69±0.03 0.23 43 2 15592 41.1±1.3 1.70±0.02 0.24 29 48 15660 44.5±1.6 1.77±0.02 0.27 48 3 15593 47.6±1.3 1.76±0.03 0.26 70 49 15733 40.8±1.0 1.76±0.03 0.26 21 4 15594 50.8±1.7 1.70±0.03 0.24 55 50 64038 42.2±1.4 1.75±0.03 0.26 24 5 15702 42.0±1.6 1.82±0.03 0.28 39 51 15637 42.9±1.3 1.83±0.02 0.29 54 6 15602 44.7±2.1 1.81±0.04 0.28 70 52 15646 48.1±1.3 1.80±0.02 0.28 71 7 15603 51.2±0.9 1.66±0.02 0.22 55 53 15650 47.5±1.9 1.67±0.03 0.22 90 8 15595 47.3±1.5 1.83±0.04 0.29 15 54 64036 40.8±1.5 1.70±0.04 0.24 20 9 15596 49.6±1.7 1.86±0.03 0.30 38 55 15635 48.3±1.1 1.75±0.03 0.26 62 10 15607 46.8±1.3 1.75±0.03 0.26 78 56 15657 47.6±2.0 1.67±0.02 0.22 46 11 15706 43.4±1.3 1.75±0.02 0.26 50 57 64034 44.0±1.0 1.79±0.03 0.27 63 12 15608 46.6±1.9 1.72±0.02 0.24 75 58 YCI 41.0±1.3 1.75±0.02 0.26 41 13 15707 43.0±1.3 1.73±0.03 0.25 38 59 64043 43.6±1.9 1.73±0.02 0.25 28 14 WUH 40.9±1.3 1.78±0.02 0.27 29 60 15653 43.0±1.5 1.84±0.03 0.29 52 15 15614 49.8±1.7 1.77±0.03 0.27 53 61 SGS 49.7±1.9 1.70±0.02 0.24 65 16 15615 48.7±1.5 1.83±0.04 0.29 16 62 15643 44.4±1.3 1.83±0.02 0.29 27 17 15597 44.5±1.0 1.66±0.03 0.22 44 63 NSS 44.0±1.3 1.61±0.04 0.19 46 18 15711 44.1±1.4 1.73±0.04 0.25 43 64 15647 40.8±1.5 1.85±0.03 0.29 27 19 15628 44.6±1.3 1.92±0.02 0.31 34 65 64030 41.6±1.0 1.79±0.03 0.27 26 20 SZS 39.8±1.8 1.89±0.03 0.31 46 66 61078 39.9±2.2 1.75±0.02 0.26 21 21 15717 43.3±1.7 1.76±0.02 0.26 50 67 ZHW 49.0±1.9 1.69±0.03 0.23 39 22 15619 37.3±1.1 1.88±0.03 0.30 19 68 64035 42.7±1.5 1.89±0.04 0.31 23 23 64054 40.4±1.6 1.80±0.02 0.28 45 69 15641 39.8±1.3 2.00±0.03 0.33 53 24 15618 46.1±1.5 1.90±0.02 0.31 40 70 61074 39.9±1.5 1.83±0.03 0.29 20 25 15722 43.0±1.9 1.74±0.03 0.25 44 71 64027 41.1±2.3 1.85±0.04 0.29 24 26 64049 41.3±1.8 1.87±0.04 0.30 23 72 61073 41.2±0.9 1.80±0.03 0.28 43 27 TLE 37.5±1.5 1.85±0.03 0.29 49 73 TXN 39.5±1.2 1.98±0.03 0.33 49 28 15638 37.8±1.7 1.60±0.02 0.18 54 74 62421 43.6±1.3 1.81±0.03 0.28 35 29 64046 42.2±1.2 1.98±0.03 0.33 17 75 64024 55.6±2.0 1.84±0.03 0.29 21 30 15740 43.0±1.5 1.83±0.03 0.29 38 76 64041 38.9±1.7 1.89±0.03 0.31 50 31 15639 46.7±1.8 1.76±0.03 0.26 16 77 JTA 47.2±1.2 1.77±0.04 0.27 42 32 YCH 48.6±0.9 1.72±0.03 0.24 55 78 64023 42.2±1.5 1.79±0.03 0.27 33 33 15659 49.6±2.1 1.74±0.03 0.25 41 79 64022 50.4±1.7 1.66±0.03 0.22 23 34 15642 47.1±1.6 1.73±0.04 0.25 38 80 64019 56.8±1.3 1.71±0.02 0.24 25 35 15644 43.1±1.2 1.88±0.03 0.30 21 81 62417 52.5±1.9 1.76±0.04 0.26 18 36 15651 47.6±1.5 1.74±0.03 0.25 38 82 61066 43.7±1.3 1.76±0.03 0.26 21 37 64047 36.3±1.3 1.98±0.02 0.33 35 83 62415 51.1±1.3 1.75±0.04 0.26 54 38 15735 43.2±1.3 1.78±0.03 0.27 24 84 62416 48.2±1.1 1.99±0.03 0.33 30 39 15734 41.4±1.1 1.79±0.03 0.27 55 85 62411 43.5±1.7 1.82±0.03 0.28 22 40 64042 47.1±1.6 1.82±0.02 0.28 31 86 62406 52.9±1.5 1.97±0.03 0.33 46 41 15658 46.1±2.3 1.73±0.02 0.25 45 87 62407 53.7±2.0 1.71±0.02 0.24 21 42 15655 38.8±1.6 1.79±0.03 0.27 45 88 64017 46.8±1.5 1.90±0.02 0.31 34 43 15645 48.9±1.7 1.63±0.02 0.20 28 89 64016 50.5±1.7 1.68±0.04 0.23 38 44 15640 42.0±1.4 1.75±0.02 0.26 39 90 HYU 56.4±1.8 1.75±0.03 0.26 51 45 15649 46.0±1.8 1.81±0.03 0.28 18 91 62400 46.9±1.2 1.81±0.02 0.28 39 46 64039 45.3±1.2 1.75±0.02 0.26 19 92 62393 51.3±1.5 1.71±0.02 0.24 32 表 2 A和B两区域内的台站莫霍面深度和泊松比
Table 2 The Moho depth and Poisson’s ratios beneath stations in the regions A and B
台站
编号台站
代码A区域 台站
编号台站
代码B区域 H/km σ H/km σ 61 SGS 49.7 0.24 17 15597 44.5 0.22 62 15643 44.4 0.29 20 SZS 39.8 0.31 64 15647 40.8 0.29 23 64054 40.4 0.28 67 ZHW 49.0 0.23 24 15618 46.1 0.31 69 15641 39.8 0.33 26 64049 41.3 0.30 71 64027 41.1 0.29 27 TLE 37.5 0.29 74 62421 43.6 0.28 29 64046 42.2 0.33 76 64041 38.9 0.31 32 YCH 48.6 0.24 77 JTA 47.2 0.27 33 15659 49.6 0.25 78 64023 42.2 0.27 37 64047 36.3 0.33 81 62417 52.5 0.26 40 64042 47.1 0.28 83 62415 51.1 0.26 41 15658 46.1 0.25 84 62416 48.2 0.33 46 64039 45.3 0.26 87 62407 53.7 0.24 47 LWU 49.7 0.23 注:H为莫霍面深度,σ为泊松比。 -
陈九辉,刘启元,李顺成,郭飙,赖院根. 2005. 青藏高原东北缘—鄂尔多斯地块地壳上地幔S波速度结构[J]. 地球物理学报,48(2):333–342 Chen J H,Liu Q Y,Li S C,Guo B,Lai Y G. 2005. Crust and upper mantle S-wave velocity structure across northeastern Tibetan Plateau and Ordos block[J]. Chinese Journal of Geophysics,48(2):333–342 (in Chinese)
崔笃信,郝明,李煜航,王文萍,秦姗兰,李长军. 2016. 鄂尔多斯块体周缘地区现今地壳水平运动与应变[J]. 地球物理学报,59(10):3646–3661 doi: 10.6038/cjg20161012 Cui D X,Hao M,Li Y H,Wang W P,Qin S L,Li Z J. 2016. Present-day crustal movement and strain of the surrounding area of Ordos block derived from repeated GPS observations[J]. Chinese Journal of Geophysics,59(10):3646–3661 (in Chinese)
邓起东,程绍平,闵伟,杨桂枝,任殿卫. 1999. 鄂尔多斯块体新生代构造活动和动力学的讨论[J]. 地质力学学报,5(3):13–21 Deng Q D,Cheng S P,Min W,Yang G Z,Ren D W. 1999. Discussion on Cenozoic tectonics and dynamics of Ordos block[J]. Journal of Geomechanics,5(3):13–21 (in Chinese)
范俊喜,马瑾,刁桂苓. 2003. 由小震震源机制解得到的鄂尔多斯周边构造应力场[J]. 地震地质,25(1):88–99 Fan J X,Ma J,Diao G L. 2003. Contemporary tectonic stress field around the Ordos fault block inferred from earthquake focal mechanisms[J]. Seismology and Geology,25(1):88–99 (in Chinese)
方盛明,赵成彬,柴炽章,刘保金,酆少英,刘明军,雷启云,刘皓. 2009. 银川断陷盆地地壳结构与构造的地震学证据[J]. 地球物理学报,52(7):1768–1775 Fang S M,Zhao C B,Chai C Z,Liu B J,Feng S Y,Liu M J,Lei Q Y,Liu H. 2009. Seismic evidence of crustal structures in the Yinchuan faulted basin[J]. Chinese Journal of Geophysics,52(7):1768–1775 (in Chinese)
酆少英,高锐,龙长兴,方盛明,赵成彬,寇昆朋,谭雅丽,何和英. 2011. 银川地堑地壳挤压应力场:深地震反射剖面[J]. 地球物理学报,54(3):692–697 Feng S Y,Gao R,Long C X,Fang S M,Zhao C B,Kou K P,Tan Y L,He H Y. 2011. The compressive stress field of Yinchuan graben:Deep seismic reflection profile[J]. Chinese Journal of Geophysics,54(3):692–697 (in Chinese)
葛粲,郑勇,熊熊. 2011. 华北地区地壳厚度与泊松比研究[J]. 地球物理学报,54(10):2538–2548 doi: 10.3969/j.issn.0001-5733.2011.10.011 Ge C,Zheng Y,Xiong X. 2011. Study of crustal thickness and Poisson ratio of the North China Craton[J]. Chinese Journal of Geophysics,54(10):2538–2548 (in Chinese)
宫猛,李信富,张素欣,罗燕,曾祥芳,刘丽. 2015. 利用接收函数研究河北及邻区地壳厚度与泊松比分布特征[J]. 地震,35(2):34–42 Gong M,Li X F,Zhang S X,Luo Y,Zeng X F,Liu L. 2015. Crustal thickness and Poisson’s ratio of Hebei and adjacent areas from teleseismic receiver functions[J]. Earthquake,35(2):34–42 (in Chinese)
国家地震局地学断面编委会. 1992a. 青海门源至福建宁德地学断面1 ∶ 100万说明书[M]. 北京: 地震出版社: 1–6. Editorial Board of Geoscience Transect, State Seismological Bureau. 1992a. Manual on the Geoscience Transection From Menyuan, Qinghai to Ningde, Fujian (1 ∶ 1 000 000) [M]. Beijing: Seismological Press: 1–6 (in Chinese).
国家地震局地学断面编委会. 1992b. 上海奉贤至内蒙古阿拉善左旗地学断面1 ∶ 100万说明书[M]. 北京: 地震出版社: 1–5. Editorial Board of Geoscience Transect, State Seismological Bureau. 1992b. Manual on the Geoscience Transect From Fengxian, Shanghai to Alxa Zuoqi, Inner Mongolia (1 ∶ 1 000 000) [M]. Beijing: Seismological Press: 1–5 (in Chinese).
国家地震局" 鄂尔多斯周缘活动断裂系”课题组. 1988. 鄂尔多斯周缘活动断裂系[M]. 北京: 地震出版社: 1–27. Research Group on Active Fault System Around Ordos Massif, State Seismological Bureau. 1988. Active Fault System Around Ordos Massif [M]. Beijing: Seismological Press: 1–27 (in Chinese).
嵇少丞,王茜,杨文采. 2009. 华北克拉通泊松比与地壳厚度的关系及其大地构造意义[J]. 地质学报,83(3):324–330 Ji S C,Wang Q,Yang W C. 2009. Correlation between crustal thickness and Poisson’s ratio in the North China Craton and its impli-cation for lithospheric thinning[J]. Acta Geologica Sinica,83(3):324–330 (in Chinese)
贾萌,王显光,李世林,陈永顺. 2015. 鄂尔多斯块体及周边区域地壳结构的接收函数研究[J]. 地球物理学进展,30(6):2474–2481 doi: 10.6038/pg20150605 Jia M,Wang X G,Li S L,Chen Y S. 2015. Crustal structures of Ordos block and surrounding regions from receiver functions[J]. Progress in Geophysics,30(6):2474–2481 (in Chinese)
李海鸥,徐锡伟,姜枚. 2008. 青藏高原中南部的深部地球动力学过程:Hi-Climb剖面北段接收函数和走时残差分析[J]. 中国科学:D辑,38(5):622–629 Li H O,Xu X W,Jiang M. 2008. Deep dynamical processes in the central-southern Qinghai-Tibet Plateau:Receiver functions and travel-time residuals analysis of north Hi-Climb[J]. Science in China:Series D,51(9):1297–1305 doi: 10.1007/s11430-008-0096-2
李松林,张先康,任青芳,张成科,石金虎,赵金仁,刘宝峰,潘素珍,张建狮,刘建军. 2001a. 西吉—中卫地震测深剖面及其解释[J]. 地震地质,23(1):86–92 Li S L,Zhang X K,Ren Q F,Zhang C K,Shi J H,Zhao J R,Liu B F,Pan S Z,Zhang J S,Liu J J. 2001a. Seismic sounding profile and its interpretation in the region of Xiji-Zhongwei[J]. Seismology and Geology,23(1):86–92 (in Chinese)
李松林,张先康,张成科,赵金仁,成双喜. 2001b. 玛沁—兰州—靖边地震测深剖面地壳速度结构的初步研究[J]. 地球物理学报,45(2):210–217 Li S L,Zhang X K,Zhang C K,Zhao J R,Cheng S X. 2001b. A preliminary study on the crustal velocity structure of Maqin-Lanzhou-Jingbian by means of deep seismic sounding profile[J]. Chinese Journal of Geophysics,45(2):210–217 (in Chinese)
李永华,吴庆举,田小波,曾融生,张瑞青,李红光. 2006. 青藏高原拉萨及羌塘块体的地壳结构研究[J]. 地震学报,28(6):586–595 Li Y H,Wu Q J,Tian X B,Zeng R S,Zhang R Q,Li H G. 2006. The crustal structure beneath Qiangtang and Lhasa terrane from receiver function[J]. Acta Seismologica Sinica,28(6):586–595 (in Chinese)
刘保金,酆少英,姬计法,王帅军,张建狮,袁洪克,杨国俊. 2017. 贺兰山和银川盆地的岩石圈结构和断裂特征:深地震反射剖面结果[J]. 中国科学:地球科学,47(2):179–190 Liu B J,Feng S Y,Ji J F,Wang S J,Zhang J S,Yuan H K,Yang G J. 2017. Lithospheric structure and faulting characteristics of the Helan mountains and Yinchuan basin:Results of deep seismic reflection profiling[J]. Science China Earth Sciences,60(3):589–601 doi: 10.1007/s11430-016-5069-4
刘建辉,张培震,郑德文,万景林,王伟涛,杜鹏,雷启云. 2010. 贺兰山晚新生代隆升的剥露特征及其隆升模式[J]. 中国科学:地球科学,40(1):50–60 Liu J H,Zhang P Z,Zheng D W,Wan J L,Wang W T,Du P,Lei Q Y. 2010. Pattern and timing of Late Cenozoic rapid exhumation and uplift of the Helan Mountain,China[J]. Science China Earth Sciences,53(3):345–355 doi: 10.1007/s11430-010-0016-0
刘启民,赵俊猛,卢芳,刘宏兵. 2014. 用接收函数方法反演青藏高原东北缘地壳结构[J]. 中国科学:地球科学,44(4):668–679 Liu Q M,Zhao J M,Lu F,Liu H B. 2014. Crustal structure of northeastern margin of the Tibetan Plateau by receiver function inversion[J]. Science China Earth Sciences,57(4):741–750 doi: 10.1007/s11430-013-4772-5
罗艳,崇加军,倪四道,陈棋福,陈颙. 2008. 首都圈地区莫霍面起伏及沉积层厚度[J]. 地球物理学报,51(4):1135–1145 Luo Y,Chong J J,Ni S D,Chen Q F,Chen Y. 2008. Moho depth and sedimentary thickness in Capital region[J]. Chinese Jour-nal of Geophysics,51(4):1135–1145 (in Chinese)
唐明帅,郑勇,葛粲,王海涛,冀战波,孔祥艳,魏斌,李志海. 2014. 帕米尔东北缘地壳结构的P波接收函数研究[J]. 地球物理学报,57(10):3176–3188 doi: 10.6038/cjg20141007 Tang M S,Zheng Y,Ge C,Wang H T,Ji Z B,Kong X Y,Wei B,Li Z H. 2014. Study on crustal structure in the northeastern Pamir region by P receiver functions[J]. Chinese Journal of Geophysics,57(10):3176–3188 (in Chinese)
童蔚蔚,王良书,米宁,徐鸣洁,李华,于大勇,李成,刘绍文,Liu M,Sandvol E. 2007. 利用接收函数研究六盘山地区地壳上地幔结构特征[J]. 中国科学:D辑,37(增刊1):193–198 Tong W W,Wang L S,Mi N,Xu M J,Li H,Yu D Y,Li C,Liu S W,Liu M,Sandvol E. 2007. Receiver function analysis for seismic structure of the crust and uppermost mantle in the Liupanshan area,China[J]. Science in China:Series D,50(S2):227–233 doi: 10.1007/s11430-007-6008-z
屈健鹏,朱佐全,杨国栋,李柱国,师水月. 1998. 鄂尔多斯地块西缘定边—景泰地壳和上地幔电性结构分析[J]. 西北地震学报,20(2):70–75 Qu J P,Zhu Z Q,Yang G D,Li Z G,Shi S Y. 1998. Analysis on electrical structure of crust and upper mantle along the western border of Ordos block[J]. Northwestern Seismological Journal,20(2):70–75 (in Chinese)
王未来. 2014. 中国西南地区的接收函数和面波层析成像研究[D]. 北京: 中国地震局地球物理研究所: 30–38. Wang W L. 2014. Receiver Function and Surface Wave Tomography Studies of Southwest China[D]. Beijing: Institute of Geophysics, China Earthquake Administration: 30–38 (in Chinese).
王伟涛,张培震,郑德文,庞建章. 2014. 青藏高原东北缘海原断裂带晚新生代构造变形[J]. 地学前缘,21(4):266–274 Wang W T,Zhang P Z,Zheng D W,Pang J Z. 2014. Late Cenozoic tectonic deformation of the Haiyuan fault zone in the northeastern margin of the Tibetan Plateau[J]. Earth Science Frontiers,21(4):266–274 (in Chinese)
王兴臣,丁志峰,武岩,朱露培. 2017. 中国南北地震带北段及其周缘地壳厚度与泊松比研究[J]. 地球物理学报,60(6):2080–2090 doi: 10.6038/cjg20170605 Wang X C,Ding Z F,Wu Y,Zhu L P. 2017. Crustal thicknesses and Poisson’s ratios beneath the northern section of the North-South Seismic Belt and surrounding areas in China[J]. Chinese Journal of Geophysics,60(6):2080–2090 (in Chinese)
王有学,钱辉. 2000. 青海东部地壳速度结构特征研究[J]. 地学前缘,7(4):568–579 Wang Y X,Qian H. 2000. Study of crustal velocity structure in east Qinghai[J]. Earth Science Frontiers,7(4):568–579 (in Chinese)
危自根,储日升,陈凌. 2015. 华北克拉通地壳结构区域差异的接收函数研究[J]. 中国科学:地球科学,45(10):1504–1514 Wei Z G,Chu R S,Chen L. 2015. Regional differences in crustal structure of the North China Craton from receiver functions[J]. Science China Earth Sciences,58(12):2200–2210 doi: 10.1007/s11430-015-5162-y
危自根,储日升,陈凌,崇加军,李志伟. 2016. 复杂地壳接收函数H -κ叠加:以安纳托利亚板块为例[J]. 地球物理学报,59(11):4048–4062 doi: 10.6038/cjg20161110 Wei Z G,Chu R S,Chen L,Chong J J,Li Z W. 2016. Analysis of H -κ stacking of receiver functions beneath crust with complex structure:Taking the Anatolia Plate as an example[J]. Chinese Journal of Geophysics,59(11):4048–4062 (in Chinese)
吴庆举,曾融生. 1998. 用宽频带远震接收函数研究青藏高原的地壳结构[J]. 地球物理学报,41(5):669–679 Wu Q J,Zeng R S. 1998. The crustal structure of Qinghai-Xizang Plateau inferred from broadband teleseismic waveform[J]. Chinese Journal of Geophysics,41(5):669–679 (in Chinese)
谢富仁,舒塞兵,窦素芹,张世民,崔效锋. 2000. 海原、六盘山断裂带至银川断陷第四纪构造应力场分析[J]. 地震地质,22(2):139–146 Xie F R,Shu S B,Dou S Q,Zhang S M,Cui X F. 2000. Quaternary tectonic stress field in the region of Haiyuan-Liupanshan fault zone to Yinchuan fault depression[J]. Seismology and Geology,22(2):139–146 (in Chinese)
谢晓峰,崇加军,刘渊远. 2010. 利用H-Kappa方法反演宁夏地区的地壳厚度[J]. 地震研究,33(3):308–313 Xie X F,Chong J J,Liu Y Y. 2010. Inversing the crustal thickness in Ningxia area by H-Kappa method[J]. Journal of Seismological Research,33(3):308–313 (in Chinese)
徐强,赵俊猛,崔仲雄,刘明乾. 2009. 利用接收函数研究青藏高原东南缘的地壳上地幔结构[J]. 地球物理学报,52(12):3001–3008 doi: 10.3969/j.issn.0001-5733.2009.12.009 Xu Q,Zhao J M,Cui Z X,Liu M Q. 2009. Structure of the crust and upper mantle beneath the southeastern Tibetan Plateau by P and S receiver functions[J]. Chinese Journal of Geophysics,52(12):3001–3008 (in Chinese)
许文俊,赵卫明,柴炽章,金延龙,孙立新,郑斯华,三浦哲. 2001. 宁夏地区GPS监测网建设、近期地壳运动特征及应力场与地震活动关系初探[J]. 中国地震,17(1):44–55 Xu W J,Zhao W M,Chai C Z,Jin Y L,Sun L X,Zheng S H,San P Z. 2001. Establishment of the GPS monitoring network in the middle part of Ningxia and preliminary study of relationship between the crustal deformation and the stress field and seismicity[J]. Earthquake Research in China,17(1):44–55 (in Chinese)
许英才,许文俊,李鸿庭,陈继锋. 2011. 利用数字地震波资料研究宁夏地区介质非弹性衰减和场地响应[J]. 大地测量与地球动力学,31(增刊1):33–37 Xu Y C,Xu W J,Li H T,Chen J F. 2011. Study on inelastic attenuation and site response of each station in Ningxia area by using waveform data from digital seismic station network[J]. Journal of Geodesy and Geodynamics,31(S1):33–37 (in Chinese)
杨明芝, 马禾青, 廖玉华. 2007. 宁夏地震活动与研究[M]. 北京: 地震出版社: 1–12. Yang M Z, Ma H Q, Liao Y H. 2007. Ningxia Earthquake Activity and Research[M]. Beijing: Seismological Press: 1–12 (in Chinese).
杨卓欣,段永红,王夫运,赵金仁,潘素珍,李莉. 2009. 银川盆地深地震断层的三维透射成像[J]. 地球物理学报,52(8):2026–2034 Yang Z X,Duan Y H,Wang F Y,Zhao J R,Pan S Z,Li L. 2009. Tomographic determination of deep earthquake faults in Yinchuan basin by using three-dimensional seismic transmission technology[J]. Chinese Journal of Geophysics,52(8):2026–2034 (in Chinese)
姚志祥,王椿镛,曾融生,楼海,周民都. 2014. 利用接收函数方法研究西秦岭构造带及其邻区地壳结构[J]. 地震学报,36(1):1–19 Yao Z X,Wang C Y,Zeng R S,Lou H,Zhou M D. 2014. Crustal structure in western Qinling tectonic belt and its adjacent regions deduced from receiver functions[J]. Acta Seismologica Sinica,36(1):1–19 (in Chinese)
曾宪伟,莘海亮,陈春梅,蔡新华. 2015. 利用小震震源机制解研究宁夏南部及邻区构造应力场[J]. 地震研究,38(1):51–57 Zeng X W,Xin H L,Chen C M,Cai X H. 2015. Characteristics research of tectonic stress in southern Ningxia and its adjacent areas by focal mechanisms of small earthquakes[J]. Journal of Seismological Research,38(1):51–57 (in Chinese)
张宏仁,张永康,蔡向民,渠洪杰,李海龙,王猛. 2013. 燕山运动的" 绪动”:燕山事件[J]. 地质学报,87(12):1779–1790 Zhang H R,Zhang Y K,Cai X M,Qu H J,Li H L,Wang M. 2013. The triggering of Yanshan movement:Yanshan event[J]. Acta Geologica Sinica,87(12):1779–1790 (in Chinese)
张洪双,高锐,田小波,腾吉文,李秋生,叶卓,刘震,司少坤. 2015. 青藏高原东北缘地壳S波速度结构及其动力学含义:远震接收函数提供的证据[J]. 地球物理学报,58(11):3982–3992 Zhang H S,Gao R,Tian X B,Teng J W,Li Q S,Ye Z,Liu Z,Si S K. 2015. Crustal S-wave velocity beneath the northeastern Tibetan Plateau inferred from teleseismic P-wave receiver functions[J]. Chinese Journal of Geophysics,58(11):3982–3992 (in Chinese)
张培震,王琪,马宗晋. 2002. 中国大陆现今构造运动的GPS速度场与活动地块[J]. 地学前缘,9(2):430–441 Zhang P Z,Wang Q,Ma Z J. 2002. GPS velocity field and active crustal blocks of contemporary tectonic deformation in conti-nental China[J]. Earth Science Frontiers,9(2):430–441 (in Chinese)
张先康,李松林,王夫运,嘉世旭,方盛明. 2003. 青藏高原东北缘、鄂尔多斯和华北唐山震区的地壳结构差异:深地震测深的结果[J]. 地震地质,25(1):52–60 Zhang X K,Li S L,Wang F Y,Jia S X,Fang S M. 2003. Differences of crustal structures in northeastern edge of Tibet Plateau,Ordos and Tangshan earthquake region in North China:Results of deep seismic sounding[J]. Seismology and Geology,25(1):52–60 (in Chinese)
张先康,嘉世旭,赵金仁,张成科,杨健,王夫运,张建狮,刘宝峰,孙国伟,潘素珍. 2008. 西秦岭—东昆仑及邻近地区地壳结构:深地震宽角反射/折射剖面结果[J]. 地球物理学报,51(2):439–450 Zhang X K,Jia S X,Zhao J R,Zhang C K,Yang J,Wang F Y,Zhang J S,Liu B F,Sun G W,Pan S Z. 2008. Crustal structures beneath West Qinling-East Kunlun orogen and its adjacent area:Results of wide-angle seismic reflection and refraction experiment[J]. Chinese Journal of Geophysics,51(2):439–450 (in Chinese)
张晓亮,师昭梦,蒋锋云,朱良玉,王雄. 2011. 海原—六盘山弧型断裂及其附近最新构造变形演化分析[J]. 大地测量与地球动力学,31(3):20–24 Zhang X L,Shi Z M,Jiang F Y,Zhu L Y,Wang X. 2011. Research on late tectonic deformation evolvement of Haiyuan-Liupanshan arc fault and its surrounding area[J]. Journal of Geodesy and Geodynamics,31(3):20–24 (in Chinese)
赵红格,刘池洋,王锋,王建强,李琼,姚亚明. 2007. 贺兰山隆升时限及其演化[J]. 中国科学:D辑,37(增刊1):185–192 Zhao H G,Liu C Y,Wang F,Wang J Q,Li Q,Yao Y M. 2007. Uplift and evolution of Helan Mountain[J]. Science in China:Series D,50(S2):217–226 doi: 10.1007/s11430-007-6010-5
Chen L,Ai Y S. 2009. Discontinuity structure of the mantle transition zone beneath the North China craton from receiver function migration[J]. J Geophys Res,114(B6):B06307
Chevrot S,van der Hilst R D. 2000. The Poisson ratio of the Australian crust:Geological and geophysical implications[J]. Earth Planet Sci Lett,183(1/2):121–132
Christensen N I. 1996. Poisson’s ratio and crustal seismology[J]. J Geophys Res,101(B2):3139–3156 doi: 10.1029/95JB03446
Clark M K,Royden L H. 2000. Topographic ooze:Building the eastern margin of Tibet by lower crustal flow[J]. Geology,28(8):703–706 doi: 10.1130/0091-7613(2000)28<703:TOBTEM>2.0.CO;2
Deng Y F,Shen W S,Xu T,Ritzwoller M H. 2015. Crustal layering in northeastern Tibet:A case study based on joint inversion of receiver functions and surface wave dispersion[J]. Geophys J Int,203(1):692–706 doi: 10.1093/gji/ggv321
Ji S C,Wang Q,Salisbury M H. 2009. Composition and tectonic evolution of the Chinese continental crust constrained by Poisson’s ratio[J]. Tectonophysics,463(1/2/3/4):15–30
Langston C A. 1977. The effect of planar dipping structure on source and receiver responses for constant ray parameter[J]. Bull Seismol Soc Am,67(4):1029–1050
Langston C A. 1979. Structure under Mount Rainier,Washington,inferred from teleseismic body waves[J]. J Geophys Res,84(B9):4749–4762 doi: 10.1029/JB084iB09p04749
Last R J,Nyblade A A,Langston C A,Owens T J. 1997. Crustal structure of the East African Plateau from receiver functions and Rayleigh wave phase velocities[J]. J Geophys Res,102(B11):24469–24483
Ligorria J P,Ammon C J. 1999. Iterative deconvolution and receiver-function estimation[J]. Bull Seismol Soc Am,89(5):1395–1400
Pan S Z,Niu F L. 2011. Large contrasts in crustal structure and composition between the Ordos Plateau and the NE Tibetan Plateau from receiver function analysis[J]. Earth Planet Sci Lett,303(3/4):291–298
Royden L H,Burchfiel B C,van der Hilst R D. 2008. The geological evolution of the Tibetan Plateau[J]. Science,321(5892):1054–1058 doi: 10.1126/science.1155371
Shen X Z,Zhou Y Z,Zhang Y S,Mei X P,Guo X,Liu X Z,Qin M Z,Wei C X,Li C Q. 2014. Receiver function structures beneath the deep large faults in the northeastern margin of the Tibetan Plateau[J]. Tectonophysics,610:63–73 doi: 10.1016/j.tecto.2013.10.011
Tian X B,Zhang Z J. 2013. Bulk crustal properties in NE Tibet and their implications for deformation model[J]. Gondwana Res,24(2):548–559 doi: 10.1016/j.gr.2012.12.024
Wang C Y,Sandvol E,Zhu L,Lou H,Yao Z X,Luo X H. 2014a. Lateral variation of crustal structure in the Ordos block and surrounding regions,North China,and its tectonic implications[J]. Earth Planet Sci Lett,387:198–211 doi: 10.1016/j.jpgl.2013.11.033
Wang H Y,Gao R,Zeng L S,Kuang Z Y,Xue A M,Li W H,Xiong X S,Huang W Y. 2014b. Crustal structure and Moho geometry of the northeastern Tibetan Plateau as revealed by SinoProbe-02 deep seismic-reflection profiling[J]. Tectonophysics,636:32–39 doi: 10.1016/j.tecto.2014.08.010
Wei Z G,Chen L,Wang B Y. 2013. Regional variations in crustal thickness and vP/vS ratio beneath the central-western North China Craton and adjacent regions[J]. Geol J,48(5):531–542 doi: 10.1002/gj.v48.5
Xu X Q,Shen X Z,Chang M,Luo G F,Yao L. 2012. Preliminary analysis of teleseismic receiver functions of the Ningxia and its adjacent area[J]. Earthquake Science,25(1):47–53 doi: 10.1007/s11589-012-0830-x
Zandt G,Ammon C J. 1995. Continental crust composition constrained by measurements of crustal Poisson’s ratio[J]. Nature,374(6518):152–154
Zhu L P,Zeng R S,Wu F T,Owens T J,Randall G E. 1993. Preliminary study of crust-upper mantle structure of the Tibetan Plateau by using broadband teleseismic body waveforms[J]. Acta Seismologica Sinica,6(2):305–316 doi: 10.1007/BF02650943
Zhu L P,Kanamori H. 2000. Moho depth variation in southern California from teleseismic receiver functions[J]. J Geophys Res,105(B2):2969–2980 doi: 10.1029/1999JB900322
-
期刊类型引用(3)
1. 丁逸凡 ,吴立新 ,齐源 ,毛文飞 . 2022年6月阿富汗帕克提卡M6.0级地震前微波亮温异常的多态性及其归因辨析. 遥感学报. 2024(10): 2621-2631 .  百度学术
百度学术
2. 刘善军,纪美仪,宋丽美,魏恋欢. 基于改进两步差法的玛多M_S7.4地震微波异常研究. 地震学报. 2023(02): 328-340 .  本站查看
本站查看
3. 吴立新,齐源,毛文飞,刘善军,丁逸凡,荆凤,申旭辉. 多波段多极化被动微波遥感地震应用研究进展与前沿方向探索. 测绘学报. 2022(07): 1356-1371 .  百度学术
百度学术
其他类型引用(3)


 下载:
下载:


