
Video Player is loading.
This is a modal window.
The media could not be loaded, either because the server or network failed or because the format is not supported.
Figures of the Article
-
![]() Reconstruction of simulated natural earthquake data
Reconstruction of simulated natural earthquake data
-
![]() Comparison of the simulated seismic data with the reconstruction data
Comparison of the simulated seismic data with the reconstruction data
-
![]() Complete (a) and 60% random sampling (b) simulated seismic data (left) and distribution of their curvelet coefficients (right)
Complete (a) and 60% random sampling (b) simulated seismic data (left) and distribution of their curvelet coefficients (right)
-
![]() Distribution of curvelet domain coefficients of complete (a) and 60% random sampling (b) partial natural earthquake observed data
Distribution of curvelet domain coefficients of complete (a) and 60% random sampling (b) partial natural earthquake observed data
-
![]() The reconstruction test of P-waveform data for natural earthquakes
The reconstruction test of P-waveform data for natural earthquakes
-
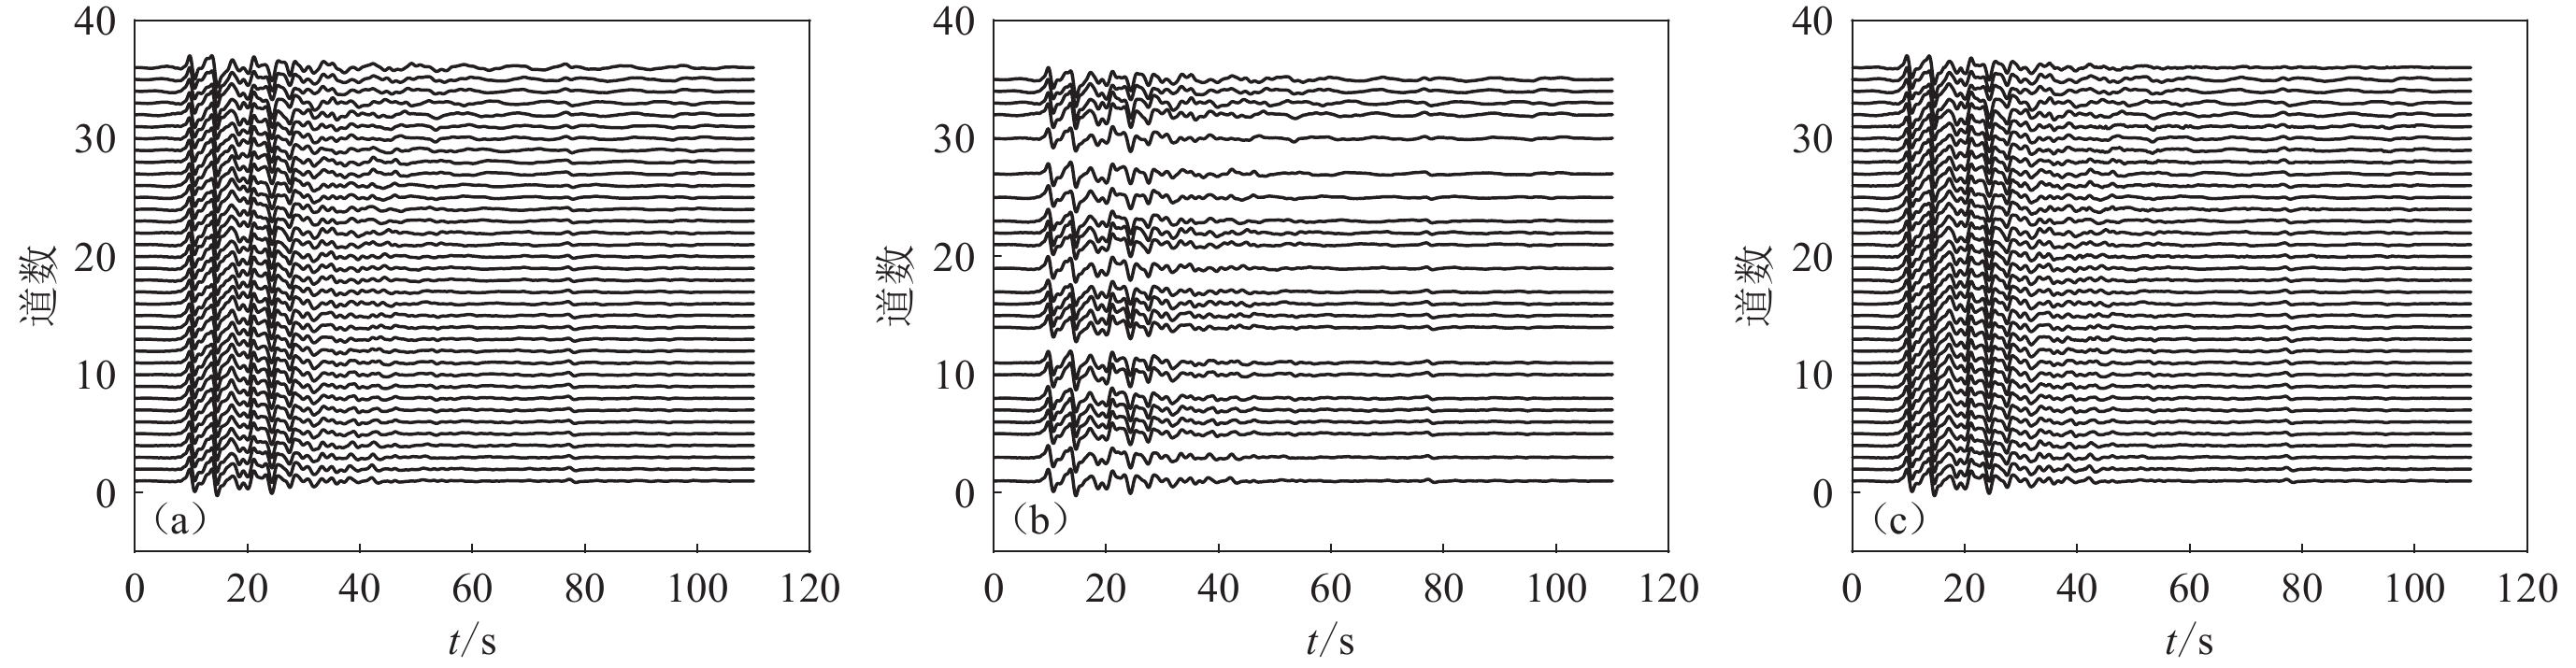
![]() Comparison of the real recorded seismic data from partial stations of portable array at Inner Mongolia with the reconstruction data
Comparison of the real recorded seismic data from partial stations of portable array at Inner Mongolia with the reconstruction data
-
![]() The distribution of mobile seismic observation stations
The distribution of mobile seismic observation stations
-
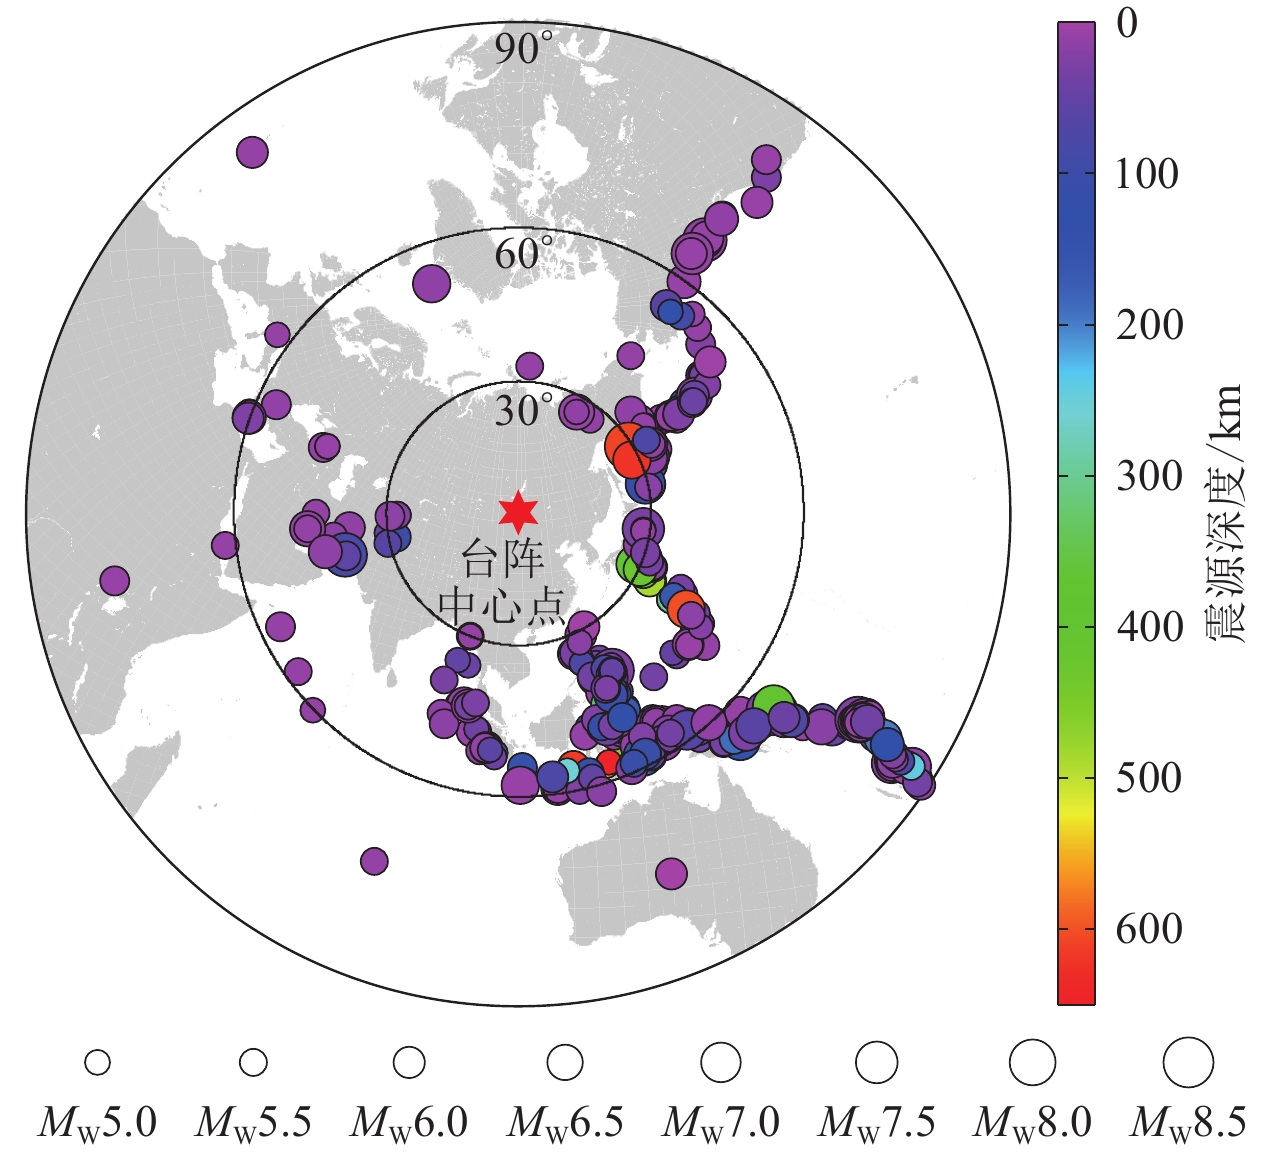
![]() Distribution of seismic events
Distribution of seismic events
-
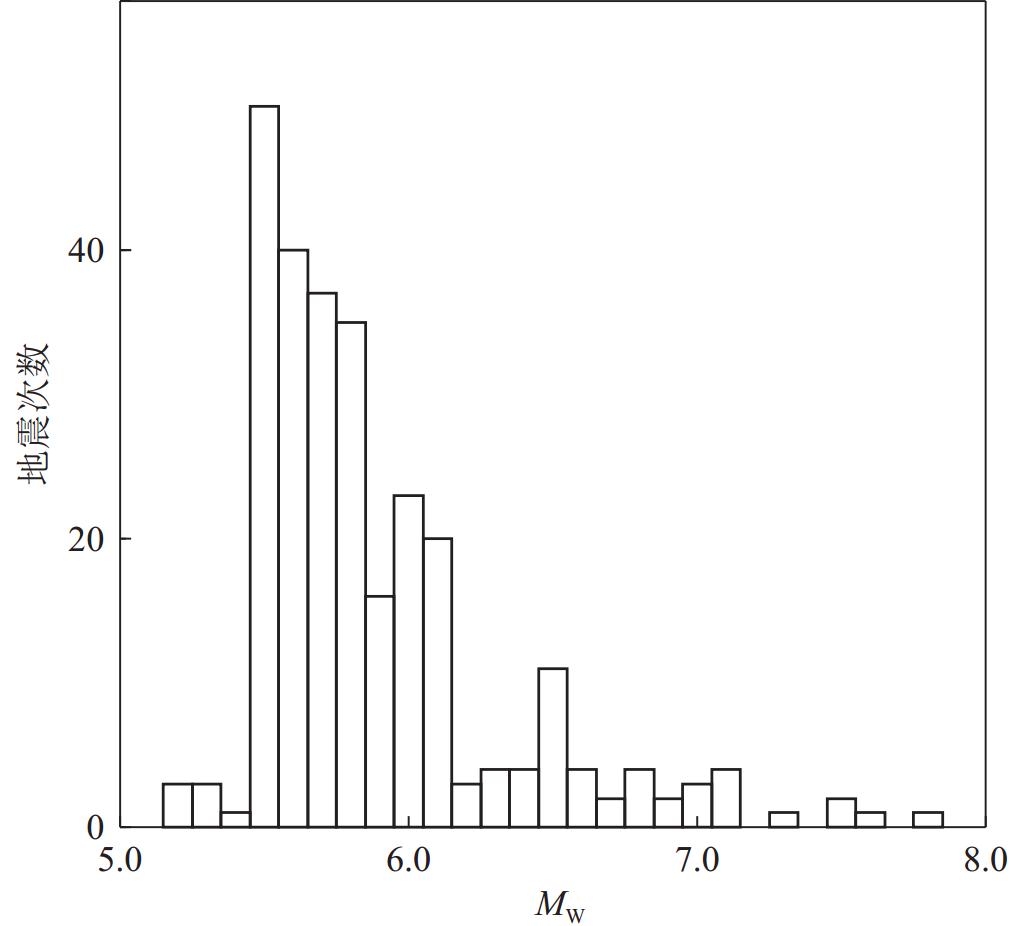
![]() Distribution of seismic event magnitude
Distribution of seismic event magnitude
-
![]() Horizontal slices of P-wave velocity disturbance results at a depth of 600 km
Horizontal slices of P-wave velocity disturbance results at a depth of 600 km
-
![]() Schematic diagram of P-wave velocity vertical profile
Schematic diagram of P-wave velocity vertical profile


Related articles
-
2024, 46(5): 825-843. DOI: 10.11939/jass.20230025
-
2023, 45(2): 246-257. DOI: 10.11939/jass.20220003
-
2004, 26(2): 223-227.
-
1997, 19(3): 327-330.
-
1987, 9(4): 364-374.
-
1984, 6(3): 264-270.
-
1983, 5(2): 195-206.
-
1983, 5(2): 129-144.
-
1983, 5(1): 65-72.
-
1982, 4(4): 327-336.
